


- Nutraceuticals & Functional Foods
- Carob Extract Market
Carob Extract Market Size, Share, and Growth Forecast 2026 - 2033
Carob Extract Market By Form (Powder, Gum), Application (Bakery and Confectionery, Nutrition and Supplements, Dairy Product, Pharmaceuticals, Others), Distribution Channel (Online, Supermarkets / Hypermarkets, Specialty Stores, B2B), and Regional Analysis, 2026 - 2033
Carob Extract Market Share and Trends Analysis
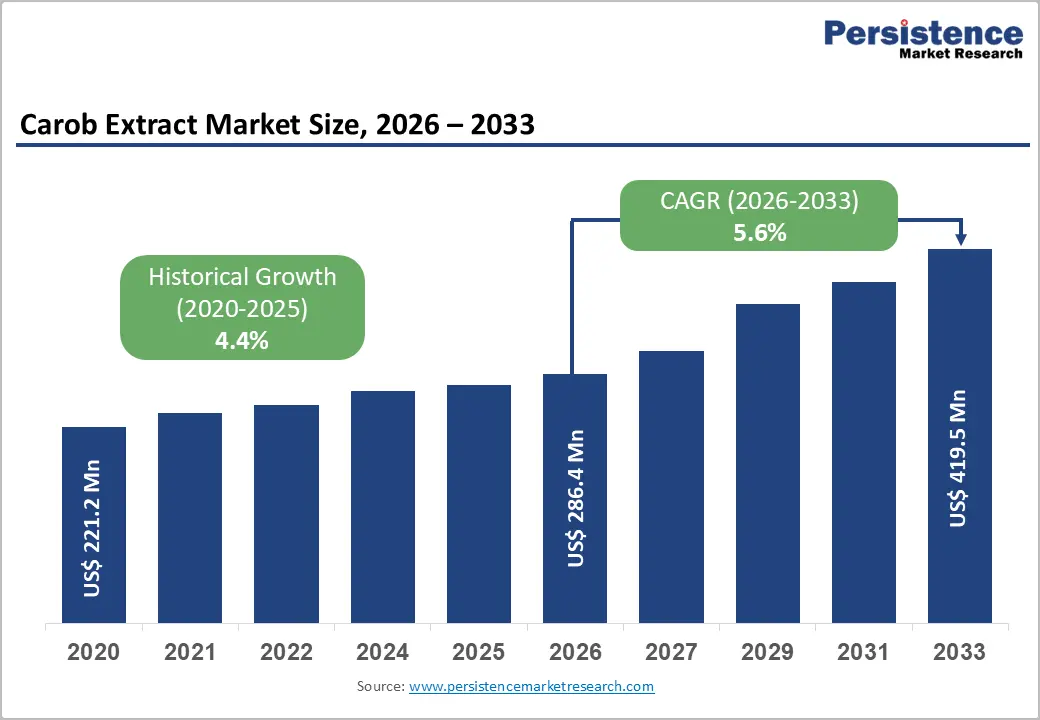
The global carob extract market size is expected to be valued at US$ 286.4 million in 2026 and projected to reach US$ 419.5 million by 2033, growing at a CAGR of 5.6% between 2026 and 2033. Robust demand for clean-label, plant-based ingredients in bakery, confectionery, dairy and nutritional products is accelerating the adoption of carob-derived powders and gums as natural cocoa replacers, stabilizers and fiber sources.
At the same time, rising consumer awareness of the health benefits of polyphenol- and fiber-rich carob, together with regulatory support for locust bean gum (E410) as a safe food additive, is reinforcing the long-term growth outlook for carob extract solutions across mature and emerging markets.
Key Industry Highlights:
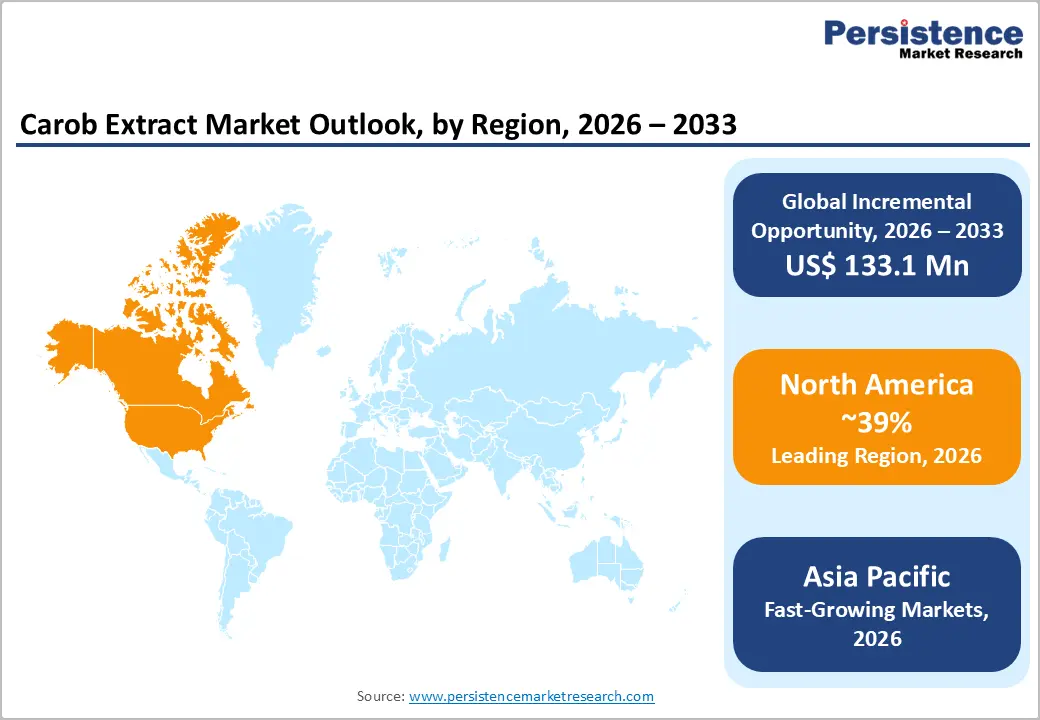
- Regional Leadership: North America is expected to remain the leading regional market for carob extract, driven by strong demand for clean-label stabilizers and cocoa alternatives in the United States and Canada, as well as a mature innovation ecosystem in dairy, bakery and snacks.
- Fast-growing Region: Asia Pacific is projected to witness the fastest growth in carob extract consumption, supported by rapid expansion of food and beverage processing in China, India, Japan and ASEAN, along with increasing adoption of plant-based and functional products.
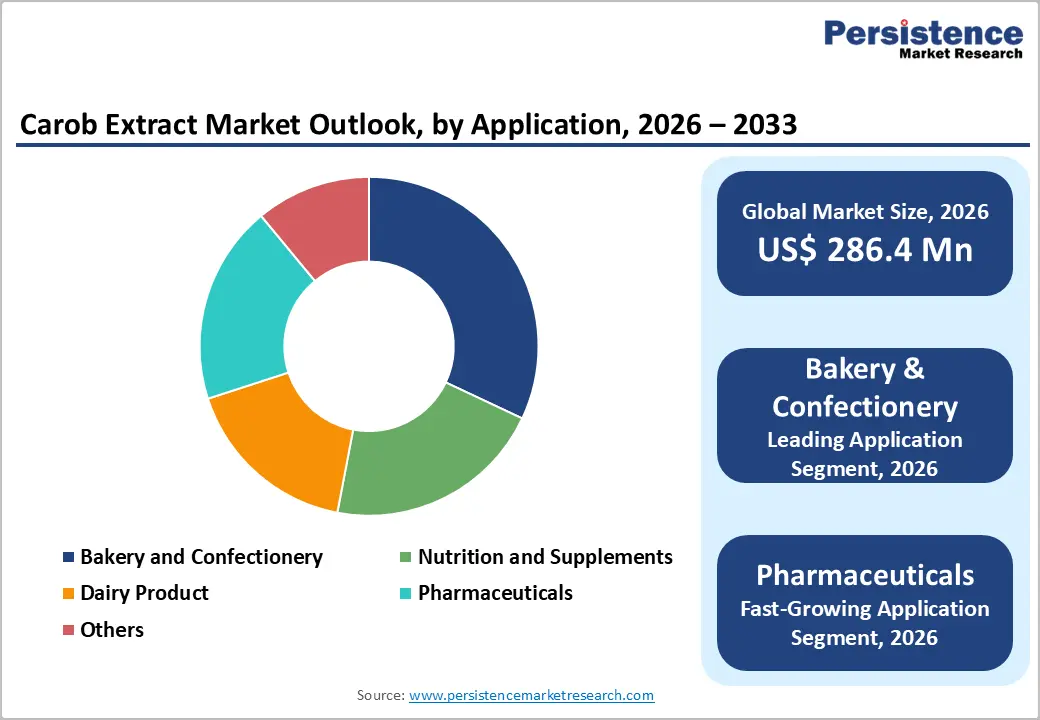
- Leading Application: Within applications, bakery and confectionery will continue to dominate global demand, with carob powder enabling recipe cost optimization and sugar reduction while catering to caffeine-free and allergen-conscious consumer preferences in multiple regions.
- Fast-growing Application: Pharmaceuticals and nutraceuticals represent the fastest-growing end-use segment, as clinical and preclinical data on carob’s polyphenols and fibers support new product development targeting digestive, cardiometabolic and antioxidant health platforms.
- Opportunity: A key opportunity for market participants lies in developing integrated, clean-label texturizing and cocoa-replacement systems that combine carob extracts with complementary ingredients, enabling brand owners to accelerate reformulation and differentiation in highly competitive categories.
| Key Insights | Details |
|---|---|
| Carob Extract Market Size (2026E) | US$ 286.4 million |
| Market Value Forecast (2033F) | US$ 419.5 million |
| Projected Growth CAGR (2026 - 2033) | 5.6% |
| Historical Market Growth (2020 - 2025) | 4.4% |
Market Dynamics
Drivers - Clean-label and plant-based nutrition tailwinds
The most powerful demand driver for carob extract is the global pivot toward clean-label, plant-based and allergen-friendly ingredients in food and beverage formulations. Carob pods and seeds deliver naturally sweet, caffeine-free and low-fat components that allow manufacturers to reduce or replace cocoa and synthetic stabilizers while maintaining sensory appeal in bakery, confectionery and dairy products. Scientific reviews show that carob-based ingredients are rich in dietary fiber and polyphenols linked with antioxidant, anti-diabetic and lipid-lowering effects, reinforcing their positioning in better-for-you snacks, nutrition bars and functional beverages. This convergence of wellness, label transparency and vegan product development is expected to keep both carob powder and locust bean gum in strong demand among global and regional brands.
Regulatory acceptance and broad functional versatility
The robust safety and regulatory profile of locust bean gum and other carob-derived hydrocolloids across major markets. The U.S. Food and Drug Administration (FDA) recognizes locust bean gum as generally recognized as safe (GRAS) for multiple uses such as thickening, stabilizing and texturizing in processed foods, while the European Food Safety Authority (EFSA) has repeatedly evaluated E410 and confirmed its safety for the general population at typical exposure levels. These approvals, also supported by JECFA and other international bodies, enable carob gum to be incorporated in a wide range of dairy, infant nutrition, dessert and beverage formulations without restrictive maximum use levels. The ability of carob gums to create creamy textures, control syneresis, prevent ice crystal formation and synergize with other gums further enhances their value in premium and reformulated product lines.
Restraints - Supply concentration and agricultural variability
One of the primary restraints is the geographic concentration and climatic sensitivity of carob cultivation, which can constrain consistent supply and pricing for extract processors. Global carob production is heavily centered in Mediterranean countries such as Portugal, Spain, Italy, Morocco and Turkey, where yield variability due to drought, ageing orchards and limited replanting can lead to raw material shortages or cost spikes. For carob extract buyers in North America and Asia Pacific that depend on imported pods and seeds, these agricultural fluctuations may translate into higher procurement risk and discourage rapid reformulation in high-volume, cost-sensitive product categories.
Competition from alternative hydrocolloids and cocoa replacers
The market also faces competition from other widely used hydrocolloids and cocoa alternatives that are deeply entrenched in food manufacturing supply chains. Ingredients such as guar gum, xanthan gum, carrageenan and pectin often provide similar thickening, gelling or stabilizing functionality at competitive costs and benefit from extensive application know-how at large food companies. In cocoa replacement, carob powder must overcome sensory and color differences versus conventional cocoa and newer ingredients like dark roasted chicory or specialty fibers. Where formulators are primarily motivated by cost or texture, these substitutes can slow the pace at which carob extract captures share, especially in regions with less familiarity with carob-based products.
Opportunities - Rising use in functional foods, nutraceuticals and sports nutrition
A major opportunity lies in the accelerating adoption of carob extract in functional foods, dietary supplements and sports nutrition, supported by emerging clinical and preclinical evidence. Recent studies highlight the antioxidant, anti-hyperlipidemic and anti-diabetic potential of carob polyphenols and fibers, including improvements in cholesterol profiles and oxidative stress markers. These findings are encouraging formulators to incorporate carob powder and fiber into bars, shakes, ready-to-drink beverages and digestive health supplements positioned for cardiometabolic and gut health support. As regulatory agencies and scientific bodies publish more data on carob’s bioactive properties, branded ingredient suppliers can develop standardized extracts and health-positioned blends, creating premium, higher-margin opportunities across both developed and emerging markets.
Expansion of clean-label texturizing systems in dairy and plant-based alternatives
Another attractive opportunity is the expanding use of carob-based gums in clean-label texturizing systems for dairy and plant-based dairy alternatives. Locust bean gum is widely recognized as a natural, label-friendly stabilizer that can replace or reduce synthetic emulsifiers and modified starches in ice cream, yogurt, cream cheese and plant-based analogues while improving mouthfeel and freeze-thaw stability. Leading ingredient companies are already commercializing custom texturizing blends that combine locust bean gum with pectin, gellan gum or citrus fiber to achieve tailored textures in premium and reduced-fat formulations. As consumer demand for additive-lite and plant-based dairy products grows, especially in North America and Europe, carob extract suppliers that invest in application support, pilot plant capabilities and collaborative product development stand to capture significant incremental demand.
Category-wise Analysis
Form Insights
Within the carob extract market, gum (locust bean gum) is estimated to account for around 57% of value share in 2025, making it the leading form segment. This dominance reflects its critical role as a multifunctional hydrocolloid in dairy, frozen desserts, processed cheese, sauces and infant nutrition, where it delivers viscosity, stability and texture at relatively low inclusion levels. The broad regulatory approval of E410 across numerous food categories in the European Union (EU), United States and other jurisdictions further supports its widespread use by global multinationals and regional brands. Powdered carob ingredients, including roasted carob powder and fiber-enriched fractions, represent a smaller but rapidly expanding share, particularly in cocoa-replacement and functional snack applications, and are expected to be the fastest-growing form over the forecast period.
Application Insights
By application, bakery and confectionery is the leading segment, accounting for approximately 32% of the carob extract market in 2025. Carob powder provides a naturally sweet, caffeine-free and low-fat alternative to cocoa powder in cakes, cookies, muffins, chocolate-like coatings and fillings, allowing manufacturers to partially replace cocoa and reduce recipe costs amid volatile cocoa pricing. In confectionery, carob-based coatings and inclusions are leveraged in diabetic-friendly and children’s products because of their mild flavor and lower allergenic potential. At the same time, the pharmaceuticals segment is poised to be the fastest-growing application, as carob gums and fibers find increased use in drug delivery systems, medicated lozenges, antidiarrheal preparations and fiber supplements targeting gastrointestinal health.
Distribution Channel Insights
In terms of distribution, B2B channels dominate the carob extract market, contributing an estimated 62% of value in 2025 as most carob powders and gums are supplied directly to food, beverage, nutraceutical and pharmaceutical manufacturers. Large ingredient companies and specialized processors typically contract with industrial buyers through long-term supply agreements, ensuring consistent specifications and technical support. While supermarkets/hypermarkets and specialty stores play a role in retail-packaged carob powder and health-food products, these outlets represent a smaller portion of overall extract volumes. Online channels, including e-commerce platforms and direct-to-consumer websites, are expected to be the fastest-growing route to market, particularly for premium organic carob powders, gluten-free baking mixes and niche nutraceutical offerings.
Regional Insights
North America Carob Extract Market Trends and Insights
North America represents the largest regional market for carob extract, with an estimated 39% share of global revenues in 2025, underpinned by the strong presence of multinational food, beverage, and ingredient companies in the United States and Canada. In the United States, rising consumer interest in plant-based diets, sugar reduction, and digestive health is supporting increased utilization of carob powder in better-for-you snacks, dairy alternatives, and nutrition bars, while locust bean gum is deeply embedded in formulations for ice creams, cream cheese, and specialty desserts. The region benefits from a robust innovation ecosystem, with R&D centers and application labs operated by leading hydrocolloid suppliers and branded food manufacturers that actively explore carob-based solutions for texture optimization and clean-label reformulation.
A well-defined regulatory framework further reinforces market confidence, as agencies such as the U.S. Food and Drug Administration (FDA) provide clear guidance on the GRAS status and permitted uses of locust bean gum in foods. Growing penetration of natural and organic product lines in mainstream retail, coupled with the rapid growth of e-commerce channels for specialty ingredients and functional foods, is expected to sustain healthy demand growth for carob extracts across North America.
Asia Pacific Carob Extract Market Trends and Insights
Asia Pacific is projected to be the fastest-growing regional market for carob extract between 2025 and 2032, supported by rapid expansion of the food processing, bakery, confectionery and dairy industries in China, India, Japan and ASEAN countries. Manufacturers in these markets are increasingly incorporating imported carob powders and gums to enhance texture, improve freeze-thaw stability and support clean-label claims in ice creams, yogurts, flavored milks, chocolate confectionery, and bakery products. The region also offers cost-competitive manufacturing for nutraceuticals and dietary supplements, which is encouraging greater use of carob extracts in digestive health and metabolic wellness formulations.
Although large-scale carob cultivation is still limited in Asia Pacific compared with the Mediterranean, interest in cultivating drought-tolerant carob trees is rising in countries such as Australia, which seek resilient crops amid climate variability. Growing urban middle-class populations, rising disposable incomes and the rapid proliferation of modern retail and e-commerce channels are expected to further boost awareness and trial of carob-based products across the region. As local formulators gain experience with carob ingredients and partner with global hydrocolloid suppliers, Asia Pacific is set to emerge as a key demand engine for the global carob extract market.
Competitive Landscape
The carob extract market is moderately fragmented, characterized by the presence of global ingredient manufacturers and regional processors competing on quality, pricing, and functional performance. Companies focus on developing high-purity extracts and improving processing technologies to enhance texture, stability, and flavor applications. Innovation is driven by rising demand for clean-label, plant-based, and natural alternatives to cocoa and synthetic additives. Strategic collaborations with food and nutraceutical manufacturers, along with expansion into emerging markets, are key growth strategies.
Key Developments:
- In May 2025, Planttech Biotech launched its NOW® Ingredient System at the Vitafoods Europe event, introducing two new carob-derived functional ingredients NOW® Energy and NOW® Weight. These products were developed using 100% natural carob fruit and advanced processing technologies to support metabolic health, including blood glucose control, energy balance, and weight management.
- In November 2025, an international study found that plant extracts derived from carob leaves and pomegranate husks were effective in reducing the impact of olive anthracnose (“soapy olive” disease). The research demonstrated that these natural extracts inhibited fungal growth by reducing spore production and preventing infection mechanisms, while also enhancing the plant’s antioxidant defenses.
- In November 2025, CarobWay entered into an exclusive distribution agreement with GRA Nutra Corp. to commercialize its carob-based ingredients in the U.S. market. As part of this development, the company prepared for the launch of its first commercial product, CarobBiome, scheduled for 2026.
Companies Covered in Carob Extract Market
- Cargill, Incorporated
- CP Kelco
- Tate & Lyle
- Ingredion Incorporated
- Ashland Global Holdings Inc.
- DuPont Nutrition & Biosciences
- Altrafine Gums
- AEP Colloids
- Colony Gums Inc.
- Foodchem International Corporation
- CAROB S.A.
- Carob Ingredients
Frequently Asked Questions
The global carob extract market is estimated to reach US$ 286.4 million in 2026, supported by steady demand growth in bakery, confectionery, dairy, nutrition, and pharmaceutical applications worldwide.
Demand is primarily driven by the shift toward clean-label, plant-based and functional products, with carob providing natural cocoa replacement, fiber enrichment and texturizing benefits backed by emerging clinical evidence on health advantages.
North America holds the leading share of the carob extract market, owing to strong utilization of locust bean gum and carob powders in the United States and Canada across dairy, frozen desserts, bakery, snacks, and nutrition categories.
A major opportunity lies in developing specialized, clean-label texturizing and cocoa-replacement systems that integrate carob powders and gums with complementary ingredients to support reformulation, sugar reduction, and premiumization initiatives.
Key players include Cargill, Incorporated, CP Kelco, Tate & Lyle, Ingredion Incorporated, Ashland Global Holdings Inc., DuPont Nutrition & Biosciences, CAROB S.A., Carob Ingredients and various regional specialists in carob powders and gums.


