


- Non-food Packaging
- Sleeve Labels Market
Sleeve Labels Market Size, Share, and Growth Forecast 2026 – 2033
Sleeve Labels Market by Product Type (Stretch, Shrink), Material Type (PVC, PET-G, PE, OPS, Others), Printing Technology (Flexographic, Rotogravure, Offset, Digital, Other), End-user (Food & Beverage, Beauty and Personal Care, Pharmaceuticals & Healthcare, Household & Industrial Chemicals), and Regional Analysis for 2026–2033
Sleeve Labels Market Size and Trend Analysis
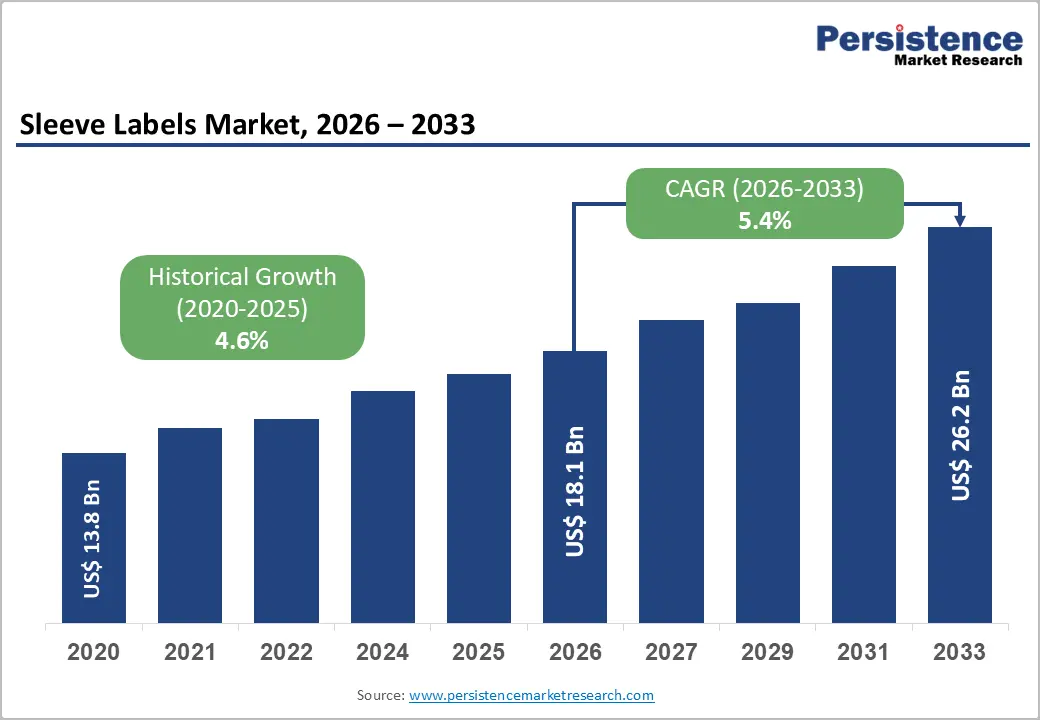
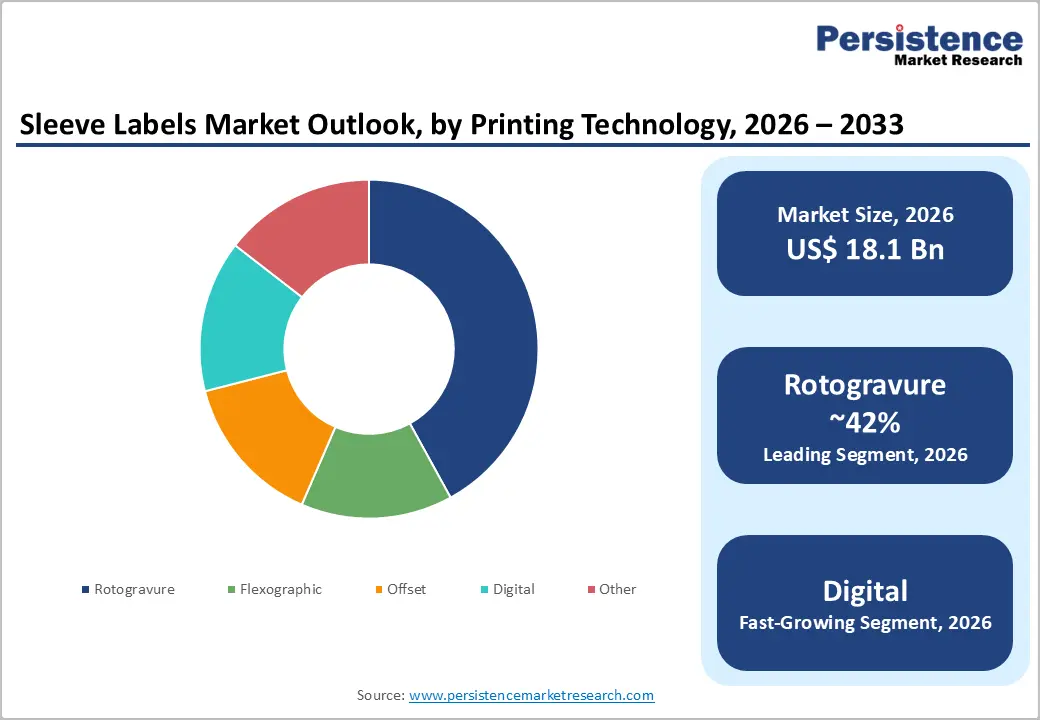
The global sleeve labels market is valued at US$ 18.1 billion in 2026 and is projected to reach US$ 26.2 billion, growing at a CAGR of 5.4% between 2026 and 2033.
This sustained growth is driven by the growing demand for consumer goods packaging, accelerating brand premiumization in food, beverage, and personal care sectors, and the unmatched design flexibility that sleeve labels offer over conventional pressure-sensitive and glue-applied labels.
Expanding modern retail trade globally, particularly private-label growth and shelf-differentiation imperatives, compels brand owners to invest in high-impact, 360-degree decorated packaging solutions. Regulatory compliance labeling requirements in pharmaceutical and chemical end-use sectors, combined with technological advances in digital and rotogravure printing, further reinforce steady volume and value expansion through the forecast period.
Key Industry Highlights:
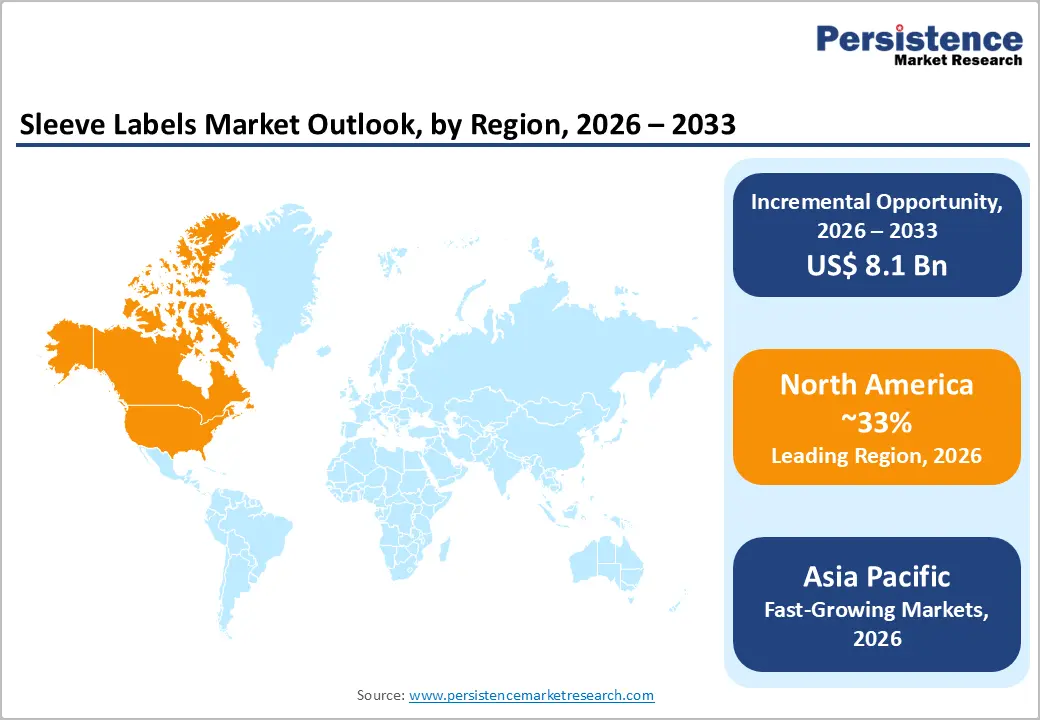
- Leading Region: North America leads the global sleeve labels market with approximately 33% revenue share in 2026, driven by the U.S.'s large CPG industry, high packaged beverage consumption, and stringent FDA tamper-evidence requirements fueling premium shrink sleeve label adoption.
- Fastest Growing Region: Asia Pacific is the fast-growing region at an estimated CAGR of 6.8%, supported by rapid FMCG growth in China and India, expanding organized retail formats, and Southeast Asian converter capacity absorbing supply chains realigned amid U.S.-China trade tensions.
- Dominant Product Type: Shrink sleeve labels dominate the product type category with approximately 74% share, preferred for 360-degree full-body graphic coverage, tamper-evidence functionality, and design flexibility across complex container geometries in beverage and personal care categories.
- Fast-Growing Segment: Digital printing is the fast-growing printing technology segment, enabling cost-effective short-run sleeve production, rapid SKU versioning, and variable data printing, catering to craft beverage, seasonal packaging, and premium personalization trends among brand owners.
- Key Opportunity: Sustainable mono-material recyclable sleeve substrates, including PE-based and all-PET systems, represent the largest strategic opportunity as EU PPWR, EPR frameworks, and brand owner sustainability commitments compel the industry-wide transition away from non-recyclable PVC sleeve materials.
DRO Analysis
Drivers - Rising Brand Premiumization and Consumer Demand for High-Impact Packaging
Brand owners across the food, beverage, and personal care sectors are intensifying investment in visually differentiating packaging to capture consumer attention in increasingly competitive retail environments. Sleeve labels, particularly heat-shrink sleeves applied over complex container geometries, enable full 360-degree print coverage, photographic image quality, and tamper-evidence features that conventional labels cannot replicate.
According to the Association for Packaging and Processing Technologies, North American consumer packaged goods manufacturers consistently cite packaging aesthetics and functionality as top investment priorities. The global beverage industry, which accounted for over 1.9 trillion litres of packaged drinks per year, according to Euromonitor International, drives high sleeve label volumes for water, carbonated soft drinks, energy drinks, and ready-to-drink tea categories, where brand visibility on shelf is a primary purchase driver.
Growth in Pharmaceutical Packaging and Regulatory Labeling Compliance Requirements
The pharmaceutical and healthcare packaging sector is a structurally growing end-use for sleeve labels, driven by serialization mandates, tamper-evident requirements, and multilingual labeling obligations across regulated markets. The U.S. Food and Drug Administration (FDA) and the European Medicines Agency (EMA) both mandate tamper-evident packaging for over-the-counter and prescription drug products, making shrink sleeve labels a compliance-enabling technology.
The World Health Organization (WHO) estimates that counterfeit medicines represent up to 10% of the global drug supply, reinforcing demand for authenticated, tamper-indicating sleeve label solutions. Furthermore, aging populations in developed markets and expanding healthcare access in emerging economies are increasing pharmaceutical unit volumes, directly translating into higher sleeve label demand across tablets, capsules, syrups, and medical device packaging.
Restraints - Environmental Concerns and Regulatory Pressure on PVC and Single-Use Plastics
Environmental scrutiny of plastic-based sleeve labels, particularly those manufactured from PVC (Polyvinyl Chloride), represents a significant and intensifying market headwind. PVC shrink sleeves are classified as a contaminant in PET bottle recycling streams by the Association of Plastic Recyclers (APR) and RecyClass (the European recycling classification body), discouraging their use on recyclable PET containers.
The EU Single-Use Plastics Directive (SUPD) and Extended Producer Responsibility (EPR) frameworks being adopted across 30+ countries are imposing eco-modulated fees on non-recyclable label materials, increasing the total cost of PVC sleeve label ownership and compelling brand owners and converters to seek alternative substrate solutions.
Volatility in Raw Material Prices Impacting Converter Margins
Sleeve label converters are exposed to significant raw material price volatility, as substrate films (PVC, PET-G, OPS, PE) are petrochemical derivatives whose prices fluctuate with crude oil prices, naphtha spreads, and polymer supply-demand dynamics. The International Energy Agency (IEA) has documented sustained crude oil price volatility since 2021, with downstream impacts on polymer feedstock pricing.
Converters operating on thin margins in competitive label markets face difficulty passing through raw material cost increases to brand-owner customers on short-term contracts. Additionally, geopolitical disruptions, including U.S.-Iran tensions affecting Middle East petrochemical supply chains and U.S. tariff actions on polymer imports, have introduced further pricing unpredictability that compresses converter profitability and constrains capital investment capacity.
Opportunities - Shift Toward Sustainable and Mono-Material Recyclable Sleeve Label Substrates
The packaging industry's transition toward recyclable, compostable, and bio-based materials is creating a significant commercial opportunity for sleeve label innovators. PET-G and oriented polystyrene (OPS) are gaining market traction as more environmentally compatible alternatives to PVC. More significantly, PE-based shrink sleeves and all-PET mono-material sleeve systems are enabling full container recyclability in HDPE and PET bottle streams, respectively, aligning with RecyClass and APR Design® Guide compliance requirements.
The Ellen MacArthur Foundation's New Plastics Economy initiative, supported by over 500 global brand signatories, commits members to using 100% reusable, recyclable, or compostable packaging by 2025, catalyzing converter R&D investment in next-generation sleeve label film innovation and creating material supply chain differentiation opportunities.
Digital Printing Adoption Enabling Short-Run Personalization and SKU Proliferation
Digital printing technology is disrupting the traditionally offset- and rotogravure-dominated sleeve label market by enabling cost-effective short-run production, rapid SKU versioning, and variable data printing without plate change-over costs. Brand owners in the food, beverage, and personal care sectors are increasingly launching limited-edition, seasonal, and region-specific packaging campaigns, strategies that require agile, short-run print capabilities not economically served by conventional printing.
Converters investing in digital inkjet and electrophotographic press technology gain the ability to serve the craft beverage, premium spirits, and nutraceuticals segments, high-growth niches where design differentiation and rapid market responsiveness command premium pricing and stronger customer loyalty.
Category-wise Analysis
Product Type Insights
The shrink sleeve labels segment dominates the product type category, likely to command approximately 74% of the global sleeve labels market. Shrink sleeves, applied over containers and conformed to shape through heat tunneling, offer unparalleled design flexibility, enabling full-body 360-degree graphics on irregularly shaped containers that brand owners increasingly demand for product differentiation. Their tamper-evidence functionality, ability to cover multi-component packaging, and compatibility with diverse substrates give them a decisive structural advantage over stretch sleeve labels.
Growth in the beverage and personal care sectors, where container shape distinctiveness is a key brand strategy, further reinforces shrink sleeve dominance. The Flexible Packaging Association (FPA) notes that shrink-applied labels remain the preferred decoration method for premium beverage and personal care SKUs globally.
Material Type Insights
PET-G (Glycol-modified Polyethylene Terephthalate) has emerged as the leading material by revenue, currently holding approximately 36% market share. PET-G's dominance is driven by its superior optical clarity, excellent shrink performance across a wide temperature range, and, critically, its compatibility with PET bottle recycling streams when appropriately formulated, addressing growing sustainability pressures.
The RecyClass classification body formally approves select PET-G sleeve formulations for use on PET bottles without disrupting recyclability. As brand owners migrate away from PVC to meet EPR and Extended Producer Responsibility compliance, PET-G is the primary beneficiary, supported by investment in PET-G film capacity by producers in Europe and Asia.
Printing Technology Analysis
The rotogravure printing technology segment leads the Printing Technology category, accounting for approximately 42% of sleeve label print volumes. Rotogravure's market leadership stems from its ability to produce consistent, high-quality photographic prints at very high press speeds, critical for the long-run beverage and personal care sleeve label volumes that dominate the market.
Technology offers exceptional color accuracy and metallic/specialty ink compatibility that is difficult to replicate at comparable speed with flexographic or digital methods. According to the Printing Industries of America (PIA), rotogravure remains the preferred technology for runs exceeding 500,000 linear meters, which characterizes the majority of global FMCG sleeve label production.
End-user Insights
The food & beverage segment holds the dominant position in the end-user category, representing approximately 54% of global sleeve labels revenue. Beverage applications, including carbonated soft drinks, bottled water, juices, energy drinks, and beer, account for the largest single application within this segment, driven by the global scale of bottled beverage production and the near-universal adoption of shrink sleeve labels as the preferred decoration method for PET and glass beverage containers.
The International Bottled Water Association (IBWA) reports that global bottled water consumption continues to grow annually, directly sustaining sleeve label volumes. Processed food brands increasingly use full-body sleeves on jars, trays, and multi-packs for promotional campaigns, shelf differentiation, and tamper-evidence, further entrenching Food & Beverage as the structural demand anchor of the sleeve labels market.
Regional Analysis
North America Sleeve Labels Market Trends & Analysis
North America is the leading regional market for sleeve labels, accounting for approximately 33% of global revenue in 2026. The United States is the dominant market, driven by a large and mature consumer packaged goods (CPG) industry, high per-capita packaged beverage consumption, and strong adoption of premium sleeve label decoration by both national and private-label brands. The Grocery Manufacturers Association (GMA) estimates the U.S. CPG sector generates over US$ 2 trillion in annual sales, creating a vast and recurring sleeve label demand base.
U.S. Sleeve Labels Market Size
The United States accounts for approximately 27% of the global sleeve labels market revenue in 2026, anchored by the world's largest packaged beverage market and a highly sophisticated retail environment where brand-owner investment in packaging differentiation is consistently elevated. The U.S. FDA's tamper-evidence requirements for OTC pharmaceutical products and the growing adoption of FDA-compliant serialization sleeves for drug products contribute incremental demand beyond the dominant FMCG segment.
Recent U.S. tariff actions on imported polymer films and printing machinery components from Asia have increased converter input costs, incentivizing domestic film production investment but also temporarily tightening supply and elevating pricing for sleeve label converters in the region.
Europe Sleeve Labels Market Trends, Drivers, & Insights
Europe represents the second-largest regional market, with strong demand concentrated in Germany, the U.K., and France. The region is characterized by heightened sustainability compliance pressure under the EU Packaging and Packaging Waste Regulation (PPWR), which mandates recyclability for all packaging by 2030 and imposes eco-modulation fees on non-compliant materials. This regulatory environment is accelerating the industry's transition from PVC to PET-G and PE-based sleeve substrates.
The geopolitics scenario has indirectly affected the sleeve labels market through energy cost inflation, impacting printing and film extrusion operations, and supply chain disruptions affecting Eastern European label film converters who supply pan-European brand owners. Despite these pressures, Europe's strong FMCG and pharmaceutical base sustains resilient structural demand.
Germany Sleeve Labels Market Size
Germany is likely to register a leading share in 2026 underpinned by its strong consumer goods manufacturing base and the presence of major sleeve label converters and film suppliers, including Klöckner Pentaplast. Germany's advanced recycling infrastructure and stringent GVM packaging compliance standards are accelerating the transition to recyclable sleeve substrates among domestic converters and brand owners.
U.K. Sleeve Labels Market Size
The United Kingdom contributes approximately 5% of global market revenue. The U.K.'s Plastic Packaging Tax (PPT), introduced at £200 per tonne for plastic packaging containing less than 30% recycled content, is a direct policy driver reshaping sleeve label substrate choices, incentivizing converters and brand owners to adopt recycled-content or readily recyclable sleeve materials. Post-Brexit regulatory divergence from EU PPWR timelines adds a layer of compliance complexity for sleeve label converters serving both the U.K. and European markets.
France Sleeve Labels Market Size
France accounts for a substantial regional revenue share in 2026. France's AGEC Law (Loi Anti-Gaspillage pour une Économie Circulaire) has introduced phased restrictions on single-use plastics and mandatory recyclability requirements for packaging, directly influencing sleeve label material specifications. The French food and beverage sector, among Europe's largest, remains a primary demand driver, with premium mineral water, wine, and spirits brands among the heaviest users of shrink sleeve decoration.
Asia Pacific Sleeve Labels Market Trends
Asia Pacific is the fastest-growing regional market for sleeve labels, expanding at an estimated CAGR of 6.8% in the forecast period driven by rapidly expanding packaged food and beverage consumption, rising middle-class purchasing power, and increasing organized retail penetration across China, India, and Southeast Asia.
China Sleeve Labels Market Size
China is likely to register a prominent share making it the world's second-largest regional market. China's massive packaged beverage and food manufacturing base, anchored by domestic FMCG giants and multinationals, generates high-volume sleeve label demand. However, U.S. tariff escalation has constrained some Chinese converter export revenues, accelerating their pivot toward domestic market growth.
India Sleeve Labels Market Size
India accounts for approximately 5% of global market revenue and is among the fastest-growing country markets, driven by booming packaged beverages, pharmaceuticals, and personal care sectors. The Confederation of Indian Industry (CII) has highlighted India's FMCG sector growing at over 10% annually, creating strong and expanding demand for sleeve label solutions. The increasing adoption of modern retail formats across Tier-1 and Tier-2 cities amplifies brand-owner investment in premium sleeve-label packaging as a competitive shelf differentiation tool.
Japan Sleeve Labels Market Size
Japan is likely to account for a leading revenue in 2026 representing a mature but high-value market. Japanese brand owners are among the world's most exacting in terms of print quality and packaging performance standards. The country's well-developed convenience store (konbini) retail culture, with over 55,000 convenience store locations per the Japan Franchise Association, creates sustained, high-volume demand for sleeve-labeled beverages, prepared foods, and personal care products. Japan's focus on the 3R (Reduce, Reuse, Recycle) policy is driving converter investment in mono-material and recyclable sleeve substrate innovation.
Competitive Landscape
The global sleeve labels market is moderately consolidated, with the top five players, including CCL Industries, Berry Global Group, Fuji Seal International, Multi-Color Corporation, and Amcor, collectively accounting for approximately 40–45% of global revenue. Market leaders are investing in acquisitions to consolidate fragmented regional converter markets, while simultaneously advancing R&D in recyclable film formulations and digital printing platforms. Emerging business model trends include offering brand owners integrated label design-to-supply services and sustainability compliance consulting as value-added differentiators beyond commodity label conversion.
Key Developments
- March 2026: CCL Industries announced an agreement to acquire Sleever International for approximately US$151 million to strengthen its global shrink sleeve labeling portfolio. The acquisition expands manufacturing capabilities, application technologies, and sustainable sleeve solutions, creating a combined sleeve business with roughly US$700 million in annual sales potential.
- February 2026: Amcor announced the expansion of its polyethylene (PE) shrink films and shrink label portfolio following its combination with Berry Global. The expanded portfolio includes recycle-ready shrink sleeve label solutions, increased manufacturing capacity, and lightweight packaging technologies designed to strengthen sustainability and support evolving packaging regulations.
- May 2025: Taghleef Industries announced the launch of SHAPE360® TDSW, a high-performance floatable white polyolefin TD shrink sleeve film designed to enhance recyclability in PET bottle applications. The solution supports high-opacity labeling while maintaining low-density properties for easier separation during recycling, strengthening sustainable sleeve label innovations and circular packaging initiatives.
Companies Covered in Sleeve Labels Market
- CCL Industries
- Berry Global Group
- Fuji Seal International, Inc.
- Multi-Color Corporation
- Huhtamaki Oyj
- Klöckner Pentaplast Europe GmbH & Co. KG
- Amcor Plc
- The Dow Chemical Company
- Fort Dearborn Company
- Taghleef Industries
- Cenveo Group
- Hammer Packaging
- Macfarlane Group
- Sleeveco
- Pactiv Evergreen Inc.
- Constantia Flexibles
- Clondalkin Group
- SleeveCo Inc.
Frequently Asked Questions
The global sleeve labels market size is valued at US$ 18.1 Bn in 2026 and is projected to reach US$ 26.2 Bn by 2033, growing at a CAGR of 5.4% during the forecast period.
The primary demand drivers are the global rise in brand premiumization and consumer demand for high-impact 360-degree packaging decoration in food, beverage, and personal care sectors, combined with growing pharmaceutical packaging requirements for tamper-evidence and serialization compliance as mandated by the U.S. FDA and EMA.
Shrink sleeve labels are the dominant product type, commanding approximately 74% of the global market. Their leadership is driven by superior design flexibility for irregular container shapes, tamper-evidence functionality, and broad end-use applicability across beverages, personal care, and pharmaceuticals, making them structurally preferred over stretch sleeve alternatives.
North America leads the global sleeve labels market with approximately 33% of global revenue in 2026, anchored by the United States' large consumer packaged goods industry, high packaged beverage volumes, and FDA-mandated tamper-evidence requirements that drive consistent, high-quality sleeve label demand.
The transition to sustainable, mono-material recyclable sleeve substrates, particularly PE-based and all-PET systems compliant with EU PPWR, APR Design® Guide, and RecyClass standards, is the most significant market opportunity. Brand signatories to the Ellen MacArthur Foundation's New Plastics Economy initiative are compelling converters to accelerate recyclable sleeve film innovation.
The leading companies in the global sleeve labels market include CCL Industries, Berry Global Group, Fuji Seal International, Multi-Color Corporation, Huhtamaki Oyj, Klöckner Pentaplast, Amcor Plc, Taghleef Industries, Fort Dearborn Company, and Macfarlane Group, among others.


