ID: PMRREP32501| 190 Pages | 30 Dec 2025 | Format: PDF, Excel, PPT* | Industrial Automation

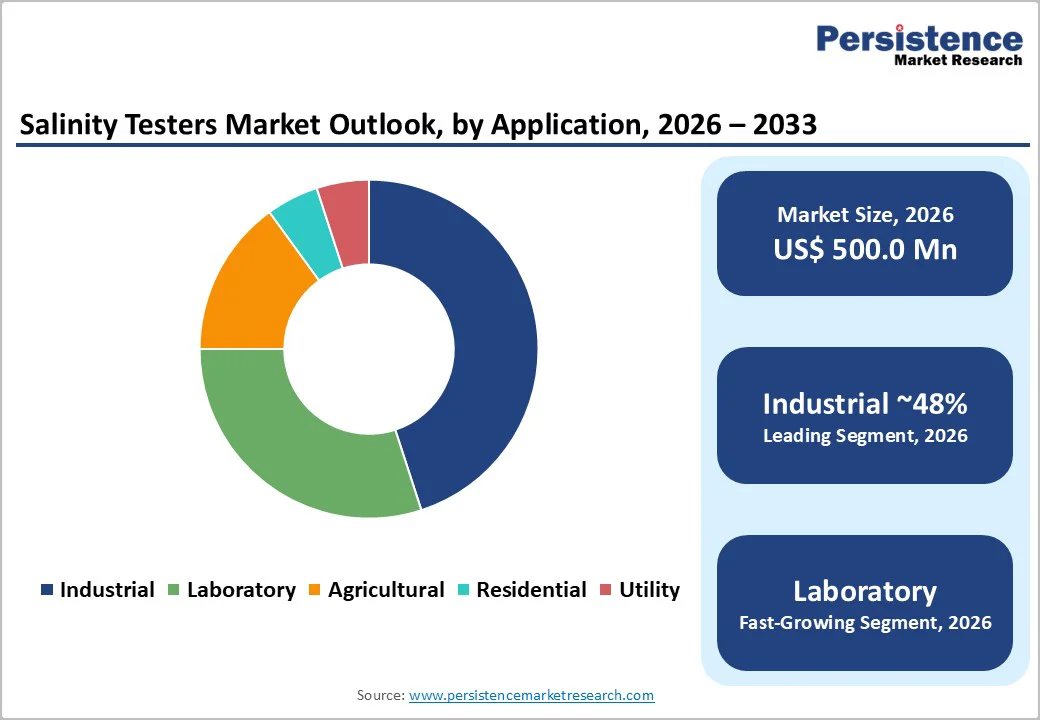
The global salinity testers market size was valued at US$ 500.0 Million in 2026 and is projected to reach US$ 885.1 Million by 2033, growing at a CAGR of 8.5% between 2026 and 2033.
The market expansion is fundamentally driven by three critical factors: accelerating aquaculture production requiring precise water quality management, stringent regulatory requirements across developed nations mandating comprehensive water testing protocols, and rapid technological adoption of IoT-enabled sensors for real-time monitoring. The global aquaculture industry has exceeded 130 million tons in annual production, directly necessitating reliable salinity monitoring systems that enhance survival rates by over 20%.
| Report Attribute | Details |
|---|---|
|
Salinity Testers Market Size (2026E) |
US$ 500 Mn |
|
Market Value Forecast (2033F) |
US$ 885.0 Mn |
|
Projected Growth (CAGR 2026 to 2033) |
8.5% |
|
Historical Market Growth (CAGR 2020 to 2024) |
5.6% |

Expansion of Aquaculture Production and Water Quality Standardization
The global aquaculture sector has emerged as a critical growth engine for the Salinity Testers Market, with production levels surpassing 130 million tons annually as reported by the Food and Agriculture Organization (FAO). This expansion directly correlates with heightened demand for precise water quality monitoring solutions, as optimal salinity levels are fundamental to fish health, growth rates, and disease prevention. Research demonstrates that systematic water quality monitoring using advanced sensors can increase aquaculture survival rates by over 20%, translating into significant economic benefits for fish farmers operating in both freshwater and marine environments. The adoption of IoT-based monitoring systems in aquaculture operations has accelerated, with the sector investing heavily in real-time data collection technologies. In China, the aquaculture monitoring equipment market is experiencing robust expansion driven by government emphasis on sustainable practices and pollution reduction initiatives. Additionally, regulatory frameworks mandating salinity compliance in farmed fish production have become increasingly stringent, compelling producers to implement continuous monitoring protocols.
Strengthened Regulatory Requirements and Environmental Compliance Mandates
Regulatory bodies across major developed economies have substantially tightened water quality standards, creating an inescapable imperative for comprehensive salinity testing infrastructure. The United States Environmental Protection Agency (EPA) announced legally enforceable Maximum Contaminant Levels (MCLs) for six PFAS chemicals in April 2024, with implementation timelines requiring public water systems to complete initial monitoring by 2027 and implement remedial solutions by 2029. The European Union's recast Drinking Water Directive will impose new limits on 20 individual PFAS compounds beginning in 2026, with total PFAS concentrations capped at 0.5g/L. North America accounts for 49.3% of the global water testing market value, estimated at US$ 2.1 billion in 2024, with this dominance directly attributable to the region's comprehensive regulatory frameworks and rigorous compliance enforcement. In Europe, the Water Framework Directive (WFD) remains the primary governance instrument, requiring member states to achieve "good qualitative and quantitative health" status for all water bodies and to establish Environmental Quality Standards (EQS) for priority substances. These regulatory drivers are not confined to developed economies; India has committed to restoring 26 million hectares of degraded land, including salt-affected soils, by 2030, necessitating systematic monitoring of soil and irrigation water salinity across agricultural regions.
High Capital Investment Requirements and Cost Sensitivity in Emerging Markets
Despite robust market fundamentals, deployment of advanced salinity testing infrastructure faces significant financial barriers, particularly in emerging economies and among smallholder agricultural operations. Integrated IoT-based monitoring systems that incorporate multi-parameter sensors, cloud connectivity, and data analytics platforms require substantial capital expenditures of USD 5,000 to USD 50,000 for comprehensive farm- or facility-scale installations. Small and marginally viable farming operations in South Asia, Southeast Asia, and rural Africa operate with severely constrained budgets and limited access to financing, rendering premium sensor technology economically inaccessible. A substantial segment of India's agricultural sector, representing approximately 6.72 million hectares of salt-affected soils where testing would be most beneficial, lacks financial resources for systematic monitoring implementation. Additionally, the lack of standardized sensor calibration services and maintenance infrastructure in developing regions creates long-term cost-of-ownership concerns that deter investment. Many emerging market operators continue relying on traditional salinity assessment methods despite inferior accuracy, as the total cost of ownership for advanced systems remains prohibitive.
Technical Limitations and Data Interpretation Complexity
Sophisticated salinity testing systems generate voluminous real-time data streams that require specialized expertise for proper interpretation and actionable decision-making. Traditional sensors require periodic recalibration using laboratory standards, creating operational friction and downtime that discourages widespread deployment. Many end-users, particularly smallholder farmers and rural aquaculture operators, lack the technical competency to manage complex IoT platforms, interpret multi-parameter datasets, and implement data-driven management adjustments. Research published in peer-reviewed journals demonstrates that 81% of published IoT-based aquaculture studies concentrate on inland freshwater systems, while marine and brackish-water applications remain underdeveloped, suggesting technology gaps in high-salinity environments. Sensor fouling, electrode degradation, and accuracy drift in harsh saline environments present persistent technical challenges that limit sensor lifespan and reliability.
Integration of Artificial Intelligence and Predictive Analytics for Precision Agriculture
The convergence of IoT sensor networks, cloud computing, and machine learning algorithms is creating unprecedented opportunities to transform agricultural water management through data-driven decision systems. Modern research demonstrates that IoT-integrated irrigation systems, coupled with predictive analytics, can reduce water consumption by 20-30% while improving crop yields by 15-25%, representing substantial economic and environmental value creation. Developing nations, particularly in South Asia and Southeast Asia, are increasingly investing in smart agriculture technologies to address water scarcity and salinization, which are affecting agricultural productivity. The agricultural IoT water quality monitoring market is expected to grow rapidly as farmers recognize that real-time salinity data, combined with weather forecasting and soil moisture sensors, enables precise optimization of irrigation schedules and leaching strategies.
AI-powered self-calibration capabilities eliminate the tedious recalibration requirements that currently impede adoption, substantially reducing the total cost of ownership. Emerging solutions that provide SMS alerts and mobile app interfaces with simple visual scoring systems (e.g., "green," "yellow," "red" indicators) are reducing the technical expertise barrier and enabling adoption across less-sophisticated user populations.
Renewable Energy-Powered Desalination Monitoring and Zero-Liquid Discharge Implementation
The global desalination industry faces mounting pressure to transition toward renewable energy integration and sustainable brine management practices, creating substantial demand for advanced salinity and water quality monitoring systems. The International Energy Agency projects that global desalination demand will reach 300 million tons daily by 2040, with 30% powered by renewable energy sources, representing a structural shift toward sustainable operations. Brine discharge from conventional desalination operations generates 1.5 to 2 tons of concentrated saltwater for every ton of freshwater produced, necessitating sophisticated monitoring systems to ensure environmental compliance and facilitate emerging zero-liquid discharge (ZLD) technologies. Innovative desalination plants, including the Shuqaiq facility in Saudi Arabia, are deploying digital twin systems and real-time IoT monitoring to optimize operational parameters, with documented reductions in equipment failure rates exceeding 40%. Emerging hybrid desalination approaches combining reverse osmosis, membrane distillation, and forward osmosis require continuous salinity monitoring to optimize process integration and energy efficiency.
The European Union's Blue Economy Observatory mandate, which requires new desalination facilities to maximize renewable energy utilization and safely manage brine discharges, is catalyzing demand for advanced monitoring instrumentation across Southern Europe, the Mediterranean, and coastal regions experiencing severe water stress.
LCD Display technology commands a dominant position within the Salinity Testers Market, capturing approximately 62% market share, driven by its superior suitability for portable handheld instruments and consumer-oriented applications. LCD displays offer significant advantages in battery efficiency, cost-effectiveness, and readability across diverse lighting conditions attributes for field-based aquaculture operations, agricultural assessments, and laboratory environments. The technology's low power consumption enables extended battery life in portable devices, reducing operational costs and maintenance burden for rural users operating in areas with limited electrical infrastructure. HANNA INSTRUMENTS' widely-adopted HI98319 Marine Salinity Tester exemplifies the market leadership of LCD-based solutions, featuring a large display that provides stability indicators, calibration tags, and multi-unit readout capabilities (parts per thousand, PSU, specific gravity) essential for professional applications. LCD technology also demonstrates superior durability in harsh marine and agricultural environments, maintaining functionality across temperature extremes and exposure to moisture without performance degradation.
Offline distribution channels maintain market leadership with approximately 64% market share, reflecting entrenched preferences for hands-on product evaluation, professional consultation, and post-purchase support services, particularly in rural and semi-urban geographies. Laboratory instrument distributors, specialty agricultural suppliers, and aquaculture equipment retailers provide essential technical consultation and product customization services that internet-based commerce cannot fully replicate. Industrial buyers and institutional customers (municipal water utilities, research institutions, pharmaceutical manufacturers) continue favoring direct sales relationships with equipment suppliers, enabling customized solutions and integrated service contracts. However, online distribution channels are expanding at substantially elevated growth rates, estimated at 6.1% CAGR compared to offline channels' 3.8% CAGR across comparable water quality instruments markets. E-commerce platforms offering comprehensive product catalogs, peer reviews, competitive pricing, and convenient home delivery are capturing growing market share among cost-sensitive agricultural producers, smaller aquaculture operations, and laboratory managers seeking procurement efficiency. Emerging digital commerce models, including manufacturer-direct subscription services bundling sensors with replacement accessories, calibration standards, and cloud analytics platforms, are creating new value propositions that traditional distributors struggle to match.
Industrial applications dominate the Salinity Testers Market with 48% market share, encompassing desalination facilities, chemical processing operations, food manufacturing, pharmaceutical production, and power generation facilities requiring continuous salinity monitoring for process optimization and regulatory compliance. Industrial-scale operations necessitate sophisticated monitoring infrastructure with multi-unit deployments, automated data logging, integration with control systems, and documentary evidence trails satisfying regulatory audits. The desalination industry, operating approximately 21,000 plants globally with energy demand approaching doubling by 2030, represents the largest industrial end-user segment. Laboratory applications capture 26% market share, driven by research institutions, clinical diagnostic centers, pharmaceutical quality assurance departments, and academic facilities conducting water quality characterization, product development, and regulatory compliance testing. Laboratory segment growth is supported by rising research investment across pharmaceutical and biotechnology sectors, with governments in India and China substantially increasing R&D funding to accelerate drug discovery and environmental compliance.
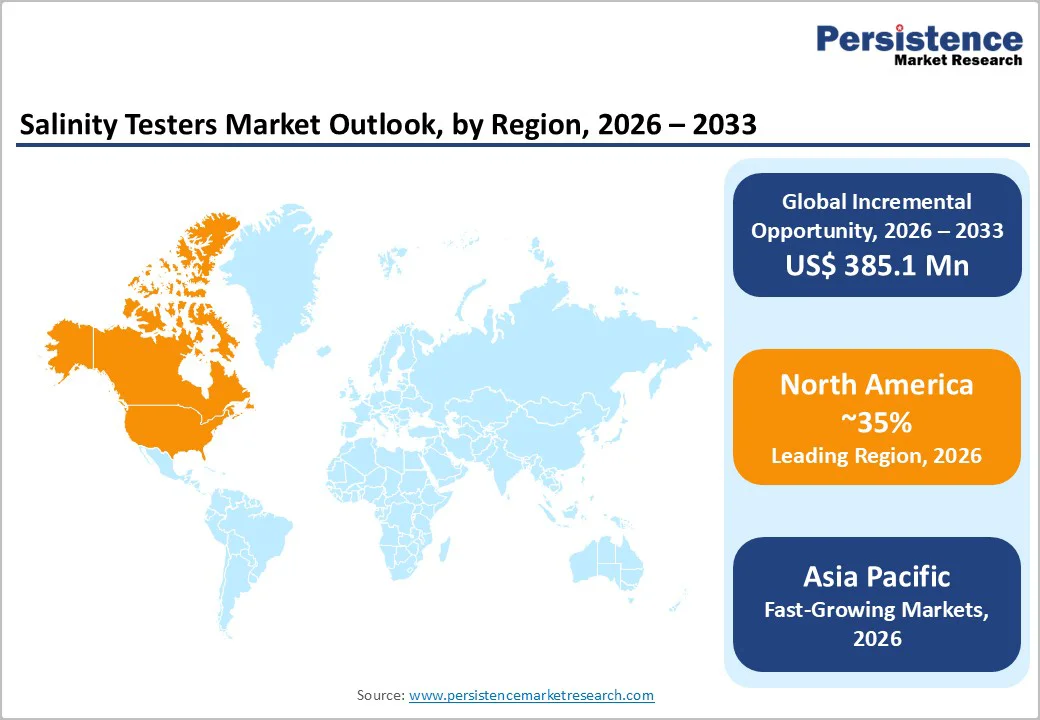
North America maintains commanding market dominance, accounting for approximately 38% of global salinity testers market value, driven by stringent regulatory frameworks, substantial public and private investment in water infrastructure, and early adoption of advanced monitoring technologies. The United States leads the region, with the EPA's April 2024 announcement of legally enforceable Maximum Contaminant Levels (MCLs) for PFAS chemicals catalyzing accelerated investment in water testing infrastructure across municipal utilities, industrial facilities, and laboratory operations. The region's robust innovation ecosystem, characterized by presence of major water technology providers including Danaher Corporation, Xylem, and Teledyne Technologies, fosters continuous product development and integration of IoT capabilities, artificial intelligence analytics, and cloud-based monitoring platforms. Investment in renewable energy-powered desalination facilities, particularly in California and other water-stressed states, is accelerating adoption of advanced monitoring systems optimized for renewable energy integration and operational efficiency.
Europe commands the second-largest regional market share at approximately 28% of global value, driven by rigorous environmental governance frameworks and coordinated regulatory harmonization across European Union member states. The European Union's Water Framework Directive (WFD) establishes the foundational governance instrument, requiring all member states to achieve "good qualitative and quantitative health" status for aquatic ecosystems while establishing Environmental Quality Standards (EQS) for pollutants of regional concern. The region's emphasis on circular economy principles and sustainable resource management is driving adoption of zero-liquid discharge (ZLD) technologies requiring continuous salinity monitoring, creating opportunities for premium-tier monitoring instruments. Government research initiatives, including the Horizon Europe framework's IBAIA project (4-year effort with Γé¼5.1 million funding to develop in-situ sensors for real-time water quality monitoring), underscore Europe's commitment to advancing monitoring technology capabilities.
Asia Pacific is emerging as the fastest-growing regional market, with projected CAGR of 9.8% through 2033, reflecting rapid aquaculture expansion, accelerating precision agriculture adoption, and escalating water stress across the region. China dominates the regional market, accounting for approximately 34% of Asia Pacific value, with the nation's aquaculture industry producing over 60 million tons annually and increasingly leveraging IoT-based monitoring systems for production optimization and environmental compliance. The Chinese government's emphasis on sustainable aquaculture practices and pollution reduction initiatives is catalyzing widespread adoption of digital water quality monitoring infrastructure, with the aquaculture monitoring equipment market expanding robustly. Innovative IoT solutions utilizing LoRaWAN and cellular communication technologies are enabling cost-effective monitoring of multi-pond operations, addressing the short communication distance and poor anti-interference limitations of traditional wireless technologies. Japan maintains premium-market positioning through advanced sensor technology and precision instrumentation, with ATAGO and other domestic manufacturers maintaining global market leadership through innovation in optical and digital salinity measurement.
The Salinity Testers Market demonstrates moderate fragmentation characteristics, with no single player commanding a dominant market share exceeding 8-10%. The competitive landscape comprises three distinct tiers: established multinational water quality instrument manufacturers leveraging global distribution networks and comprehensive product portfolios; specialized regional players focused on specific geographies or application segments; and emerging technology-driven companies emphasizing IoT integration, artificial intelligence capabilities, and subscription-based service models.
Market leaders, including HANNA INSTRUMENTS, ATAGO, and Environmental & Scientific Instruments, compete through differentiation across product features (multi-parameter capabilities, wireless connectivity, data logging sophistication), distribution excellence, and comprehensive support services including calibration and maintenance. Regional manufacturers in India, China, and Southeast
The global Salinity Testers Market is projected to reach US$ 885.1 Million by 2033, representing growth from US$ 500.0 Million in 2026 at a CAGR of 8.5%, driven by expanding aquaculture production, regulatory compliance mandates, and IoT integration in water quality monitoring systems.
Primary drivers include expanding global aquaculture production surpassing 130 million tons annually requiring precise water quality management; stringent regulatory frameworks including EPA PFAS MCLs (2024) and EU Drinking Water Directive (2026).
Industrial applications command the largest market share at 48%, encompassing desalination facilities, chemical processing, food manufacturing, and power generation operations requiring continuous salinity monitoring for process optimization and regulatory compliance, with particularly strong growth in renewable energy-powered desalination facilities.
Asia Pacific is the fastest-growing region with 9.8% CAGR through 2033, propelled by China's aquaculture sector producing over 60 million tons annually, India's 6.72 million hectares of salt-affected soils requiring systematic monitoring, and widespread precision agriculture adoption incorporating IoT water quality monitoring.
Market leaders include HANNA INSTRUMENTS (Italy) specializing in portable marine and aquaculture instruments with LCD display technology; ATAGO CO. LTD (Japan).
| Report Attribute | Details |
|---|---|
|
Historical Data/Actuals |
2020 – 2024 |
|
Forecast Period |
2026 – 2033 |
|
Market Analysis Units |
Value: US$ Bn, Volume: Units |
|
Geographical Coverage |
|
|
Segmental Coverage |
|
|
Competitive Analysis |
|
|
Report Highlights |
|
Testers Type
Distribution Channel
Application
Delivery Timelines
For more information on this report and its delivery timelines please get in touch with our sales team.
About Author