


- Energy Storage Solutions
- Net-Zero Energy Buildings Market
Net-Zero Energy Buildings Market Size, Share, and Growth Forecast, 2026 - 2033
Net-Zero Energy Buildings Market by Component type (Equipment (HVAC Systems, Lighting Systems, Renewable Energy Systems, Energy Storage Systems, Building Envelope Solutions, and Others), Solution and Services (Software, Designing Services, and Consulting Services)), Building Type (Residential, Commercial, and Industrial/Manufacturing), and Regional Analysis for 2026 - 2033
Net-Zero Energy Buildings Market Size and Trends Analysis
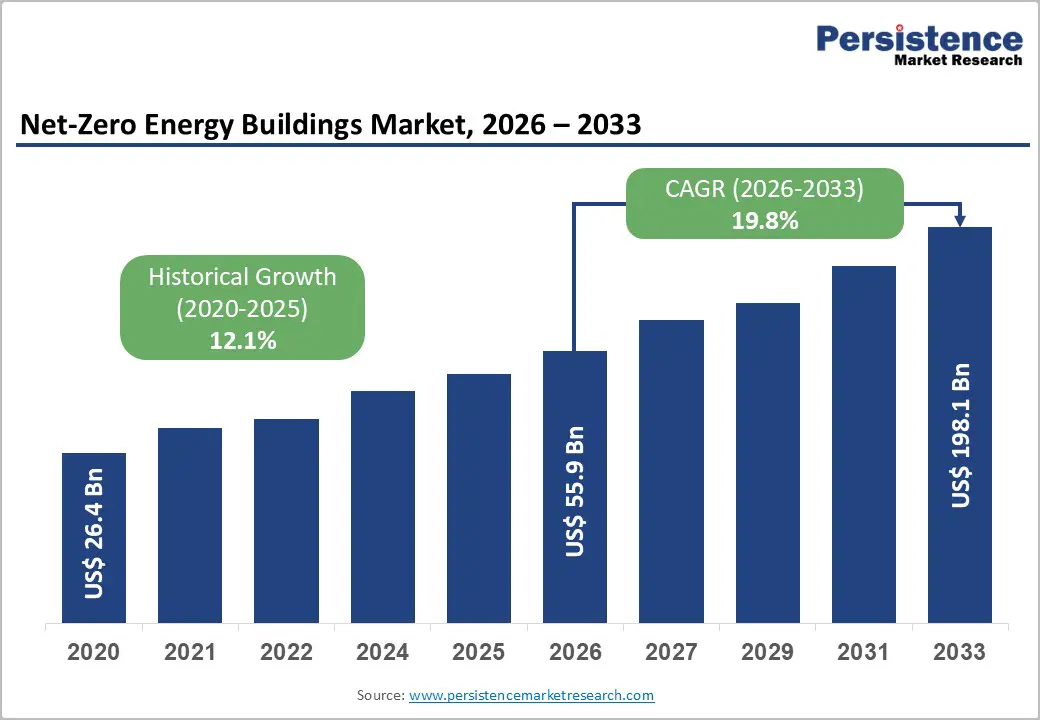
The global net-zero energy buildings market size is likely to be valued at US$ 55.9 billion in 2026 and is projected to reach US$ 198.1 billion by 2033, growing at a CAGR of 19.8% between 2026 and 2033. This transformation is fundamentally driven by stringent regulatory frameworks mandating near-zero emissions standards for new construction, rapid electrification of heating and cooling infrastructure replacing fossil fuel-based systems, and accelerated deployment of on-site renewable energy generation technologies across residential and commercial building portfolios.
The market expansion reflects a structural shift from conventional energy-consuming buildings toward self-sustaining, grid-interactive structures capable of producing equivalent or greater energy than consumed annually through integrated solar photovoltaic systems, advanced HVAC configurations, intelligent building automation, and high-performance envelope solutions.
Key Industry Highlights:
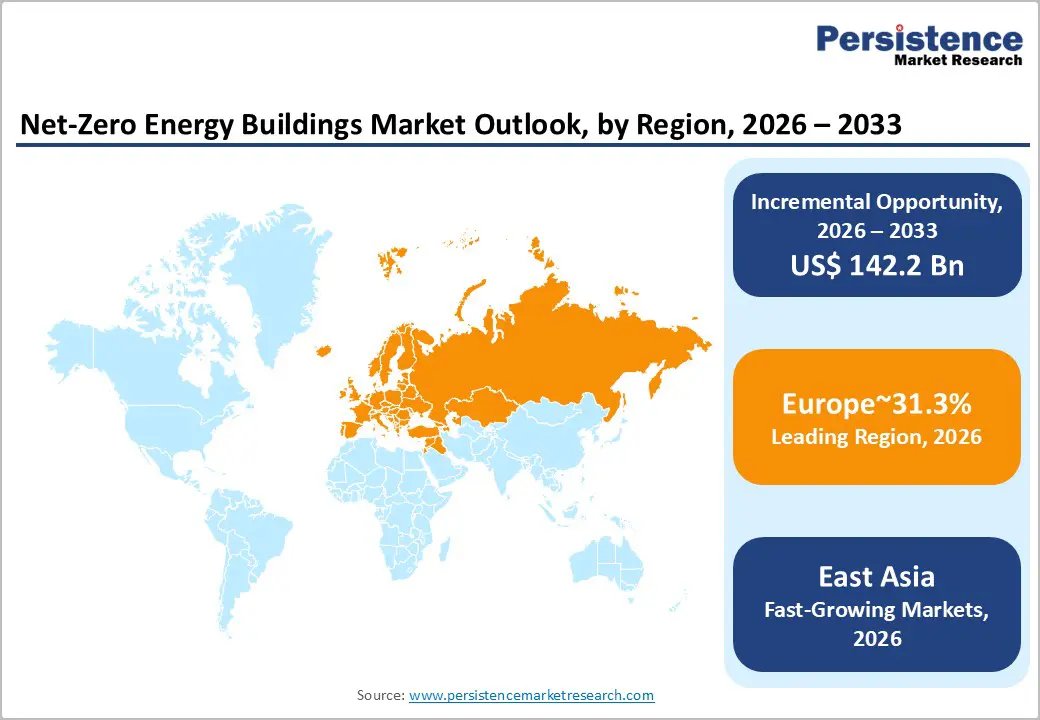
- Regional Leadership: Europe leads the global Net-Zero Energy Buildings market with 31.4% share, driven by comprehensive regulatory frameworks, deep renovation incentives, and strong public financing for new and existing building decarbonization.
- Second Largest Hub: North America holds 27% market share, supported by federal and state initiatives, industry programs like Architecture 2030 and AIA 2030 Commitment, and corporate sustainability commitments.
- Emerging Market: East Asia captures 23% of the market, leveraging rapid urbanisation, industrial decarbonization targets, strong renewable energy manufacturing capacity, and advanced smart building technology adoption.
- Building Type Dominance: Commercial buildings remain the primary segment with 45% share, due to higher energy consumption, concentrated ownership enabling faster decision-making, and regulatory targeting of non-residential structures.
- Fastest-Growing Segment: Residential buildings are the fastest-growing segment, fueled by rooftop solar adoption, electrification of heating, distributed renewable energy systems, and policies targeting building stock renovation.
- Regulatory Scenario: Mandatory zero-emission building standards, Nearly Zero Energy Building codes, and international climate commitments (e.g., Paris Agreement) are accelerating adoption and establishing baseline compliance across major economies.
- Technology & Business Model Development: Integration of smart building platforms, AI-enabled energy management, and Energy-as-a-Service frameworks enables predictive optimization, grid-interactive capabilities, and performance-based financing, reducing capital barriers and enhancing economic and operational value.
| Key Insights | Details |
|---|---|
|
Net-Zero Energy Buildings Market Size (2026E) |
US$ 55.6 Bn |
|
Market Value Forecast (2033F) |
US$ 198.1 Bn |
|
Projected Growth (CAGR 2026 to 2033) |
19.8% |
|
Historical Market Growth (CAGR 2020 to 2025) |
12.1% |
Market Dynamics
Drivers - Regulatory Mandates for Zero-Emission Building Standards Across Major Economies
Global policy frameworks are establishing legally binding requirements for net-zero construction, fundamentally reshaping building development practices. The European Union mandates that all new buildings achieve Zero-Emission Building status from 2030 onward, requiring extremely high energy efficiency with any residual demand met through renewables, efficient district systems, or local energy communities, while publicly owned buildings must comply from 2028. In parallel, the Nearly Zero Energy Building standards implemented since 2020 deliver approximately 70 percent improved energy performance compared to 2006 baseline levels. The directive requires Member States to implement national renovation strategies targeting zero-emission building stock by 2050, supported by monitoring and long-term renovation plans ensuring alignment with decarbonization pathways.
In the United States, the Energy Independence and Security Act of 2007 and regional initiatives such as California's Zero Net Energy Commercial Building Action Plan establish federal and state frameworks supporting NZEB adoption, while industry programs, including Architecture 2030, AIA 2030 Commitment, and ASHRAE Vision 2030, provide certification pathways accelerating the transition to carbon-neutral buildings.
The World Green Building Council mandates that all new buildings must operate at net zero carbon from 2030 and 100 percent of buildings, including existing stock, must reach net zero carbon by 2050 to achieve Paris Agreement climate targets, establishing legally binding timelines that fundamentally reshape construction specifications and renovation requirements throughout the net-zero energy buildings market. These regulatory interventions eliminate market optionality, converting net-zero specifications from voluntary certifications to baseline compliance requirements, directly stimulating demand for advanced building technologies, renewable integration systems, and energy management solutions.
Renewable Energy Integration and Solar Adoption Acceleration
Technological advancement in on-site renewable energy generation and storage systems represents a critical catalyst propelling the net-zero energy buildings market forward. According to the International Energy Agency, global rooftop solar PV adoption is projected to accelerate significantly from approximately 25 million installed households in 2020 to around 100 million by 2030 and reaching nearly 240 million by 2050, reflecting sustained long-term residential solar uptake worldwide. Solar thermal and geothermal system adoption in buildings is targeted to increase from around 2 percent in 2020 to about 8 percent by 2030 and further reach nearly 12 percent by 2050, indicating a steady shift toward renewable heating solutions.
The IEA net-zero pathway requires renewables to supply nearly 90 percent of worldwide electricity by 2050, with solar PV and wind alone delivering close to 70 percent of total generation, fundamentally transforming power sector carbon intensity that currently represents the largest contributor to global CO2 output. Buildings capable of reducing electricity use by 40 to 60 percent through advanced insulation, high-performance building envelopes, and Building-Integrated Photovoltaics demonstrate commercial viability, while Daikin Industries' energy-recovery ventilation and air-conditioning systems minimize overcooling and reduce building power consumption by up to 40 percent.
These technology deployments enable the Net-Zero Energy Buildings Market to achieve IEA projections showing heating and cooling energy consumption in new buildings declining from a baseline index of 100 in 2020 to approximately 50 by 2030, representing a 50 percent reduction, further decreasing to around 20 by 2040 and approaching nearly zero by 2050 through electrification via heat pumps and enhanced building systems.
Economic Viability Through Energy Efficiency and Cost Reduction
The net-zero energy buildings market demonstrates compelling economic value propositions that accelerate adoption beyond regulatory compliance through operational savings and lifecycle cost advantages. European analysis indicates that increasing renovation rates to 3.5 percent annually could halve heating energy demand, reducing reliance on imported fossil fuels while lowering household energy bills, with average heating costs potentially falling by up to 50 percent as heat pumps and district heating become cost-competitive with gas boilers by 2028. The transition is expected to deliver substantial socio-economic benefits, including a 0.8 percent GDP increase by 2030 and 1 percent by 2050, while creating around 1.2 million net additional jobs mainly in construction and clean energy sectors across Europe.
Reduced fossil fuel use could lower Europe's gas import spending by €15 billion in 2030 and €43 billion by 2050, strengthening energy independence and budget stability. The IEA pathway demonstrates that the global economy becomes about 40 percent larger by 2030 while using 7 percent less energy, driven by energy-efficiency gains averaging 4 percent annually, three times the historical pace, indicating decoupling of economic growth from energy consumption. Buildings offer lower operating costs, improved resiliency, and enhanced energy security, with early action reducing retrofit expenses while delivering benefits including job creation and long-term emissions reduction, positioning net-zero carbon buildings as economically superior compared to conventional construction throughout the Net-Zero Energy Buildings Market value chain.
Restraint - High Capital Investment Requirements and Financial Barriers
The Net-Zero Energy Buildings Market confronts substantial adoption challenges stemming from elevated upfront capital expenditure requirements for advanced building technologies and comprehensive retrofitting projects. Deep renovations aiming to transform buildings into nearly zero-energy or zero-emission structures require integrated investments spanning building envelope upgrades, HVAC system replacements, renewable energy installations, energy storage systems, and building automation platforms, creating financial barriers particularly acute for small to medium building owners and residential property holders operating on constrained budgets.
The global building stock projected to expand from 223 billion square meters to approximately 415 billion square meters by 2050 necessitates nearly 5.5 billion square meters of new space added annually, requiring massive capital mobilisation that exceeds current financing mechanisms and investment flows. Existing buildings pose even greater challenges, with current renovation rates at less than 1 percent annually needing to increase to at least 3 percent per year globally, demanding coordinated financing frameworks including green bonds, preferential loans, and subsidy programs that remain underdeveloped in many jurisdictions, constraining market penetration despite demonstrated lifecycle cost advantages.
Opportunity - Energy-as-a-Service Business Models and Performance-Based Financing Mechanisms
The emergence of Energy-as-a-Service frameworks represents a transformative opportunity to overcome capital barriers and accelerate Net-Zero Energy Buildings Market adoption across building portfolios. These subscription-based models provide comprehensive decarbonization solutions where third-party providers assume upfront investment costs, technology risks, and performance obligations, while building owners pay predictable monthly fees linked to guaranteed energy savings and carbon reduction outcomes.
Johnson Controls launched OpenBlue Net Zero Buildings as a Service, delivering turnkey solutions with customised decarbonization roadmaps, integrated energy and sustainability technologies, and real-time dashboards tracking energy, water, materials, and greenhouse gas emissions with guaranteed net-zero outcomes and predictable costs, simplifying risk management across commercial, healthcare, campus, and industrial facilities.
Siemens introduced Energy-as-a-Service models linking payments directly to guaranteed energy and carbon savings, addressing capital constraints identified as primary barriers in infrastructure investment planning. These performance-based structures eliminate traditional financing hurdles, enable immediate deployment without capital budgets, transfer technology obsolescence risks to experienced providers, and align incentives around actual measured outcomes rather than projected savings. The model particularly suits commercial building portfolios, public sector facilities with budget constraints, and organisations seeking to monetise decarbonization commitments without balance sheet impacts. Energy-as-a-Service enables rapid scaling of net-zero retrofits across existing building stock, accelerates technology deployment timelines, and expands the addressable market to include customers previously unable to pursue capital-intensive projects within the Net-Zero Energy Buildings Market.
Integration of Smart Building Technologies and Grid-Interactive Capabilities
Advanced digitalisation, artificial intelligence, and Internet of Things technologies create substantial opportunities to enhance net-zero energy buildings market value propositions through intelligent energy management, predictive optimisation, and grid interaction capabilities. Smart building platforms enable real-time monitoring of energy flows, automated optimisation of HVAC and lighting systems, predictive maintenance reducing equipment failures, occupancy-based demand management, and integration of distributed energy resources, including solar generation, battery storage, and electric vehicle charging infrastructure.
Siemens launched Building X, an open, AI-enabled, cloud-based smart building suite integrating energy, operations, and security systems on a single platform to support net-zero targets, utilising real-time analytics, digital twins, and Energy Manager functionality to track consumption, costs, and carbon dioxide footprints while enabling corrective actions and efficiency gains for both new and existing buildings.
Schneider Electric enhanced its EcoStruxure Energy Hub, providing cloud-based IoT energy management with real-time visibility into building energy use, costs, and carbon emissions to support net-zero goals, simplifying compliance, performance tracking, and optimisation across single or multi-building portfolios. GE Appliances partnered with Savant Systems to launch the EcoBalance System, a whole-home smart energy platform integrating energy-efficient appliances, solar panels, battery storage, EV chargers, and demand management tools through connected ecosystems, enabling monitoring and optimisation via a single application.
European policies promote smart systems, including storage, demand response, and grid-interactive technologies, to enhance flexibility and reduce overall energy load. These intelligent building capabilities enable participation in demand-response programs, provision of grid services generating revenue streams, optimisation of time-of-use electricity pricing, maximisation of self-consumption from on-site renewables, and continuous performance improvement through machine learning algorithms, substantially enhancing economic value propositions and operational performance within the Net-Zero Energy Buildings Market.
Category-wise Analysis
Component Type Insights
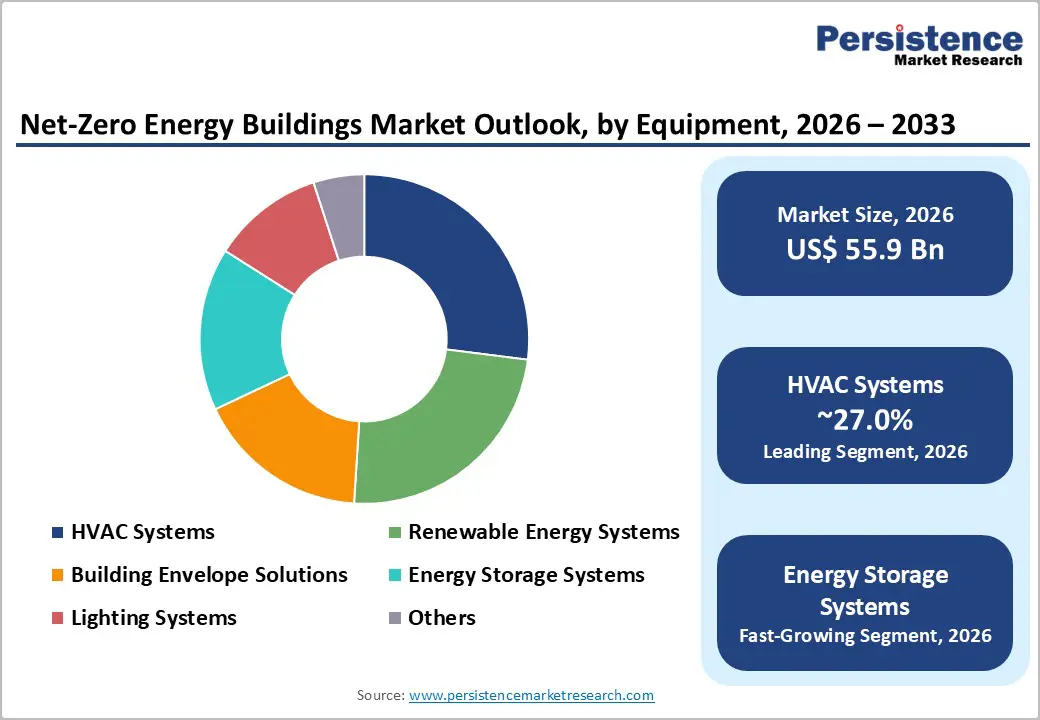
Equipment constitutes the dominant segment, representing 74% share in 2026, encompassing HVAC systems, lighting systems, renewable energy systems, energy storage systems, building envelope solutions, and related technologies. This segment leadership reflects the capital-intensive nature of physical infrastructure required to achieve net-zero performance specifications. HVAC systems undergo fundamental transformation through heat pump deployment, with Daikin showcasing advanced energy-recovery ventilation and air-conditioning systems that minimise overcooling and reduce building power consumption by up to 40 percent, directly supporting decarbonization objectives and operational carbon reduction.
Building envelope solutions incorporating high-performance insulation and Building-Integrated Photovoltaics enable structures such as the steel-based Zero Energy Building inaugurated in Bhubaneswar, India, utilising Light-Gauge Steel Frame technology with integrated rooftop solar and BIPV generating equivalent energy to annual consumption. Renewable energy systems transition to mainstream building components, with European policies mandating solar-ready buildings and promoting the deployment of photovoltaics and thermal systems as core renovation strategy elements. Energy storage systems enable optimization of self-consumption, time-shifting of renewable generation, and grid interaction capabilities.
Solution and services represent the fastest-growing component segment, driven by the complexity of system integration, performance optimization requirements, and the emergence of outcome-based business models. This segment encompasses energy management platforms, building automation services, performance monitoring and verification, commissioning and optimization services, energy-as-a-service offerings, and ongoing system management. Rapid growth reflects the recognition that achieving and maintaining net-zero performance requires continuous optimization beyond initial equipment installation.
Building Type Insights
Commercial buildings constitute the leading building type segment, holding approximately 45% market share in 2026, reflecting priority focus on non-residential structures within regulatory frameworks and corporate sustainability commitments. Commercial building emphasis is driven by larger per-building energy consumption, concentrated ownership enabling faster decision-making, stronger economic incentives through operational cost reduction, and regulatory targeting of worst-performing buildings, including non-residential structures, to accelerate decarbonization.
Major implementations demonstrate commercial segment leadership, including Schneider Electric's partnership with Landsec delivering smart energy management and IoT-enabled building solutions for The Forge in London's Bankside, the UK's first commercial building designed under the UKGBC net-zero carbon framework for both construction and operations, powered by 100 percent renewable electricity and achieving approximately 25 percent lower embodied carbon during construction.
Residential buildings represent the fastest-growing building type segment, driven by policy frameworks targeting renovation of housing stock, deployment of distributed renewable energy, and electrification of household heating systems. Growth acceleration reflects recognition that residential buildings constitute the largest portion of total building stock globally, with projections showing rooftop solar PV adoption rising from approximately 25 million installed households in 2020 to around 100 million by 2030 and reaching nearly 240 million by 2050.
Regional Insights and Trends
East Asia Net-zero Energy Buildings Market Trends
East Asia commands approximately 23% of the global net-zero energy buildings market, with regional dynamics shaped by rapid urbanization, industrial decarbonization commitments, and technology leadership in renewable energy and advanced manufacturing. The region's building stock expansion is particularly pronounced, contributing substantially to the projected global increase from 223 billion square meters currently to approximately 415 billion square meters by 2050, with nearly 5.5 billion square meters of new space added annually worldwide, creating a critical imperative to construct to net-zero standards immediately to avoid massive future retrofit requirements.
China, Japan, and South Korea demonstrate leadership in deploying building-integrated photovoltaics, heat pump manufacturing, and smart building technologies. The region benefits from strong domestic manufacturing capabilities across solar PV equipment, energy storage systems, HVAC technologies, and building automation platforms, supporting cost-competitive implementation. Japan's technological contributions include Daikin Industries' showcase of advanced HVAC solutions featuring energy-recovery ventilation and air-conditioning systems minimizing overcooling and reducing building power consumption by up to 40 percent, alongside Daikin's certification for science-based net-zero greenhouse gas reduction targets committing to eliminate lifecycle emissions across HVAC-R products and operations by 2050, with near-term goals including 46.2 percent Scope 1 and 2 emissions reduction by 2031.
North America Market Trend
North America accounts for approximately 27% of the global market, characterized by state-level policy leadership, voluntary industry commitments, and innovation in financing mechanisms and technology platforms. Regional market development is shaped by programs including the Energy Independence and Security Act, state initiatives such as California's Zero Net Energy Commercial Building Action Plan, and industry frameworks including Architecture 2030, AIA 2030 Commitment, ASHRAE Vision 2030, and the Living Building Challenge, providing certification pathways that accelerate carbon-neutral building adoption.
Net-zero energy buildings in North America are designed to balance energy needs with energy produced from renewable, zero-emission sources, extending beyond energy to encompass water, waste, and overall emissions, targeting net zero across multiple resource dimensions. These buildings offer lower operating costs, improved resiliency, and enhanced energy security benefits supporting market adoption.
The competitive landscape features technology platform providers, integrated equipment manufacturers, energy service companies, and specialised net-zero design and engineering firms. North America benefits from mature green building professional networks, established performance verification protocols, and growing corporate commitments to carbon-neutral real estate portfolios, driving market expansion.
Europe Net-zero Energy Buildings Market Trends
Europe represents the largest regional market, capturing approximately 31.4% of global market share, driven by the world's most comprehensive regulatory framework for building decarbonization and substantial public financing mechanisms supporting renovation and new construction. The European Union mandates that all new buildings achieve Zero-Emission Building status from 2030, requiring extremely high energy efficiency with residual demand met through renewables, while publicly owned buildings must comply from 2028. Nearly-Zero Energy Building standards implemented since 2020 deliver approximately 70 percent improved energy performance compared to 2006 baseline levels.
The Renovation Wave strategy targets doubling annual energy renovation rates to renovate 35 million units by 2030, emphasising deep renovations, fossil fuel phase-out, and on-site renewable integration. Analysis projects that renovation rates reaching 3.5 percent annually could halve heating energy demand, reducing gas import spending by 15 billion euros in 2030 and 43 billion euros by 2050, while creating approximately 1.2 million net additional jobs mainly in construction and clean energy sectors, alongside 0.8 percent GDP increase by 2030 and 1 percent by 2050.
Competitive Landscape
The global net-zero energy buildings (NZEB) market exhibits a moderately consolidated structure with competitive fragmentation at the regional and technology level, where a handful of multinational players dominate large-scale projects while several niche firms address specialised solutions. Leading companies such as Schneider Electric, Siemens Smart Infrastructure, Johnson Controls International, Daikin Industries, GE Appliances (Savant), and Integrated Environmental Solutions (IES) command strong positions through integrated offerings that combine HVAC systems, smart controls, building automation, and cloud-based energy management platforms. These players leverage end-to-end capabilities, digital twins, IoT connectivity, and Energy-as-a-Service models to deliver measurable carbon and energy reductions across commercial and institutional buildings.
Envelope specialists, renewable integrators, and analytics providers like Kingspan, Sage Electrochromics, and SunPower contribute to a fragmented ecosystem by focusing on high-performance materials and onsite clean energy technologies. Strategic partnerships, software integrations, and performance-based contracts are common competitive tactics to secure long-term client relationships. Regulatory mandates for decarbonization and efficiency standards further strengthen the position of established firms with proven compliance expertise.
Key Developments:
- In March, 2024, Mahindra Group, in collaboration with Johnson Controls, introduced a first-of-its-kind Net Zero Buildings Initiative in India aimed at accelerating decarbonization across commercial, residential, and public buildings. The program provides facility owners with comprehensive toolkits, energy conservation strategies, training modules, and financing guidance to support net-zero adoption. Buildings adopting this initiative can reduce electricity consumption by 40 to 60%, enhancing energy efficiency while contributing to India’s long-term sustainable construction and net-zero goals. This initiative exemplifies a practical, large-scale approach to achieving NZEB targets through integrated policy, technology, and stakeholder engagement.
- In Dec 2025, Tata Steel and Constructsteel (World Steel Association) completed a 1,836 sq. ft. steel-framed Zero Energy Building using Light-Gauge Steel Frame (LGSF) technology in Bhubaneswar, India. The project integrates high-performance insulation, rooftop solar, and Building-Integrated Photovoltaics (BIPV) to generate as much energy annually as it consumes, achieving net-zero energy operation. Constructed within 3.5 months, this building demonstrates scalable, low-carbon, fast-track construction methods. It establishes steel-based solutions as a viable, climate-resilient pathway for mainstream NZEBs, offering a model for low-carbon materials, rapid deployment, and energy-positive designs in urban infrastructure.
Companies Covered in Net-Zero Energy Buildings Market
- Schneider Electric
- Siemens Aktiengesellschaft
- Daikin Industries Ltd.
- Integrated Environmental Solutions Ltd.
- Johnson Controls International plc
- Altura Associates LLC
- Canadian Solar Inc.
- DABITRON Group Canary Islands
- General Electric Company
- GreenTree Global
- Honeywell International Inc.
- Kingspan Group Plc
- Sage Electrochromics Inc. (Compagnie de Saint-Gobain S.A.)
- Solatube International Inc.
- SunPower Corporation (Total SE)
Frequently Asked Questions
The global net-zero energy buildings market is projected to be valued at US$ 55.6 Bn in 2026.
The HVAC Systems segment is expected to account for approximately 27% of the global net-zero energy buildings market by Equipment in 2026.
The net-zero energy buildings market is expected to witness a CAGR of 19.8% from 2026 to 2033.
The growth of the Net-Zero Energy Buildings market is driven by strict regulatory mandates for zero-emission buildings, accelerated adoption of renewable energy and smart building technologies, and strong economic incentives through energy efficiency and operational cost savings.
The key market opportunities in the Net-Zero Energy Buildings market lie in Energy-as-a-Service and performance-based financing models that lower capital barriers, alongside the integration of smart building technologies and grid-interactive capabilities to optimise energy use, reduce costs, and enable revenue-generating services.
Key players in the Net-Zero Energy Buildings Market include Schneider Electric, Siemens Smart Infrastructure, Johnson Controls International, Daikin Industries, GE Appliances (Savant), and Integrated Environmental Solutions (IES).


