


- Display Technologies
- Large Format Displays Market
Large Format Displays Market Size, Share, and Growth Forecast 2026 - 2033
Large Format Displays Market By Screen Size (32
Market Overview
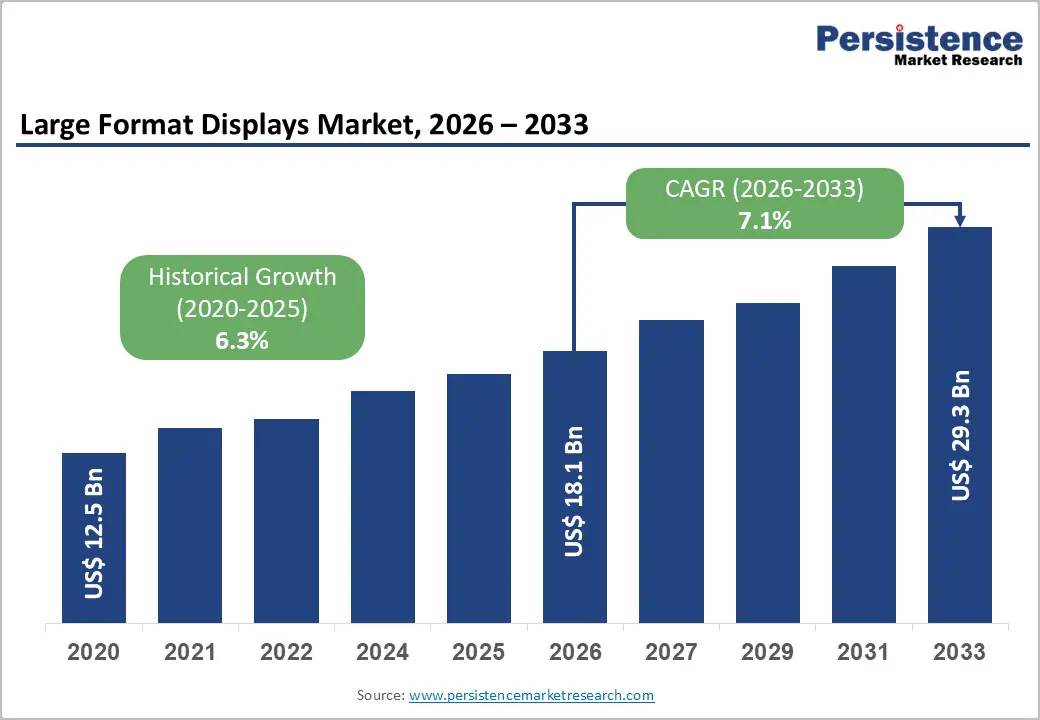
The global Large Format Displays Market size is projected to be valued at US$18.1 Billion in 2026 and is anticipated to reach US$29.3 Billion by 2033, growing at a CAGR of 7.1% between 2026 and 2033. This expansion is driven by accelerating digital signage adoption across retail environments with installations exceeding 28 million units globally, increasing demand for collaborative workplace technologies supporting 1.88 billion remote workers, and smart city infrastructure investments surpassing US$189 billion worldwide. Declining display panel costs by 42%, advancing LED and OLED technologies enabling 8K resolution capabilities, and expanding advertising expenditure significantly further propel market growth.
Key Market Highlights
- Above 80" displays lead with 39% share and are the fastest-growing; 41"–80" displays expand at 7.1% CAGR for mainstream commercial applications.
- Video Walls dominate with 40% share, while Touchscreens grow fastest at 7.8% CAGR, enabling interactive wayfinding and self-service solutions.
- Installed deployments command 67% share; Rental grows 8.0% CAGR, driven by the global events industry.
- LED Backlit displays hold 81% share, offering 35–50% energy savings; Retail leads end-use, with Corporate adoption growing fastest at 7.5% CAGR.
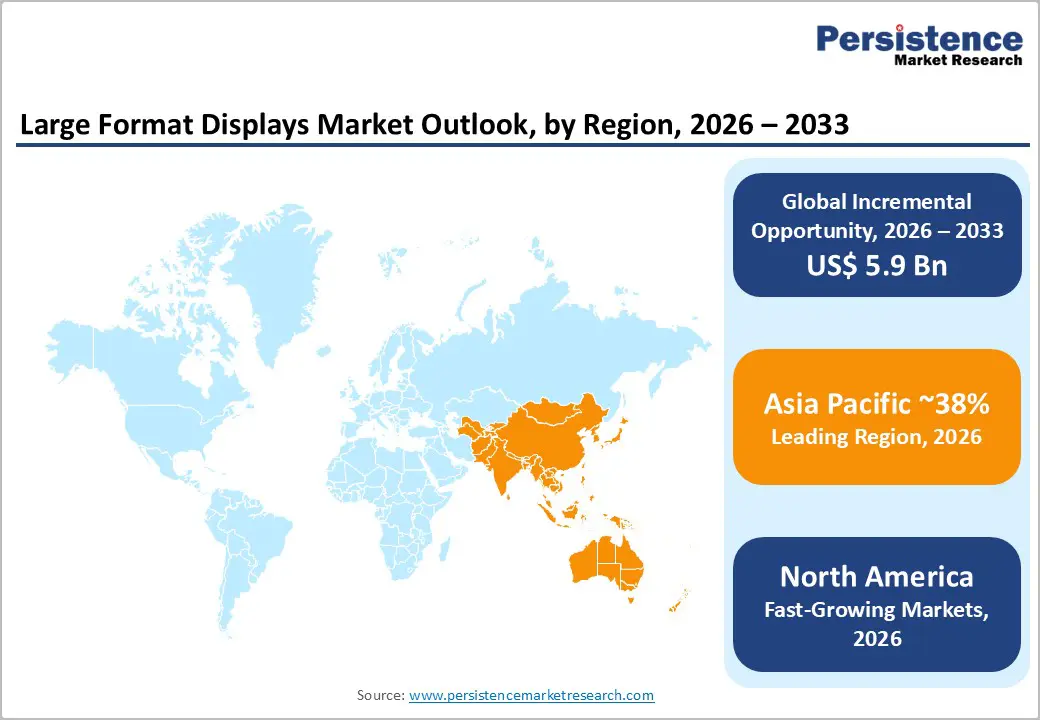
- Asia Pacific holds 38% share fueled by China’s retail growth; North America grows 6.9% CAGR via enterprise technology spending.
- Strategic initiatives include US$520M direct view LED acquisition, 8K modular setups across 240 flagships, and a US$420M cloud CMS supporting 850,000 displays globally.
| Key Insights | Details |
|---|---|
| Large Format Displays Market Size (2026E) | US$ 18.1 billion |
| Market Value Forecast (2033F) | US$ 29.3 billion |
| Projected Growth CAGR (2026-2033) | 7.1% |
| Historical Market Growth (2020-2025) | 6.3% |
Market Dynamics Analysis
Market Drivers
Proliferation of Digital Signage and Retail Experience Enhancement
The global digital signage market has expanded rapidly, with over 28 million installed displays worldwide in 2024, growing at 12.4% annually. Retail investments in customer engagement technologies reached US$178 billion in 2023, with digital displays accounting for 34% of in-store technology spending. Rising e-commerce penetration, up 42% since 2020, is pushing physical retailers to enhance experiential environments. Large format displays enable dynamic content, real-time inventory visibility, and personalized engagement, delivering 27–35% higher dwell time and 18% conversion improvement. With 67% of purchase decisions made in-store, retailers continue prioritizing visual merchandising technologies to strengthen brand differentiation across modern global retail ecosystems.
Corporate Workplace Transformation and Hybrid Collaboration Technologies
Corporate adoption of large format displays is accelerating due to hybrid work models and collaboration needs. The International Labour Organization estimates 1.88 billion workers globally operate remotely or in hybrid settings, increasing demand for advanced visualization tools. Enterprise spending on unified communications reached US$62.4 billion in 2023, with interactive displays accounting for 23% of conference room investments. Government mandates, including U.S. federal video collaboration requirements, drive procurement exceeding US$2.8 billion annually. Workplaces using large interactive displays report 44% shorter meetings and 38% faster decisions. Fortune 500 firms spend about US$4,200 per conference room, prioritizing 4K resolution and touch-enabled collaboration capabilities.
Market Restraints
High Initial Investment and Total Cost of Ownership Challenges
Large format display deployments demand high capital investment, with enterprise installations averaging US$15,000–45,000 per unit including hardware, software, and integration. Total ownership costs, covering energy, maintenance, content, and networks, exceed purchase prices by 180–240% over five years. SMEs face adoption barriers, with 58% citing upfront costs. Professional installation adds 25–35%, proprietary CMS licensing averages US$2,400 annually, and 80+ inch displays consuming 350–580 watts raise operating expenses, especially for continuous retail and transport use across large-scale commercial environments worldwide today globally.
Technology Obsolescence and Rapid Product Lifecycle Challenges
The large format display market faces rapid technology evolution, creating obsolescence risks and shortening product lifecycles to 3–5 years versus traditional commercial displays. Resolution shifts from Full HD to 4K and emerging 8K quickly outdated installations, weakening content differentiation and competitiveness. Connectivity transitions from HDMI to USB-C and wireless standards demand infrastructure upgrades. Technology obsolescence influences 68% of purchases, while 42% of large deployments face cross-generation compatibility issues. Display residual values drop 75% within three years, elevating replacement costs significantly.
Market Opportunities
Expansion of LED Direct View Display Technologies
Direct view LED display technology represents a US$24.8 billion opportunity by 2030, delivering brightness above 5,000 nits, seamless modularity, and operational lifespans exceeding 100,000 hours. Bezel-free LED architectures enable unlimited configurations, from compact video walls to stadium installations surpassing 10,000 square feet. IAAPA reports LED deployments across 340 global theme parks, improving content visibility and visitor engagement. Annual manufacturing cost reductions near 18% from miniaturization enhance affordability. Energy-efficiency mandates in Japan, South Korea, and Europe favor LEDs using 40–60% less power than LCDs. Enterprise adoption accelerates across corporate lobbies, control rooms, and broadcast studios demanding premium visual performance and reliability.
Integration with Artificial Intelligence and Interactive Technologies
The convergence of large format displays with artificial intelligence, gesture recognition, and interactivity creates substantial value opportunities. AI-driven content optimization analyzes audience demographics and engagement, dynamically adjusting messaging and delivering a reported 34% improvement in conversion rates. Touch and gesture-enabled displays support wayfinding, product configuration, and self-service, reducing labor costs by 28% in retail and hospitality. Facial recognition, projected to reach US$12.4 billion by 2030, enables personalized content and analytics. Object recognition and computer vision convert displays into intelligent systems detecting interest and triggering contextual information. This convergence represents a US$16.7 billion opportunity across retail, hospitality, and corporate applications globally.
Segmentation Analysis
Screen Size Analysis
Above 80-inch displays lead with 39% market share, valued near US$7.05 billion in 2026, supporting high-impact uses such as video walls, outdoor advertising, corporate lobbies, and large venues. They serve control rooms, broadcast studios, convention centers, and flagship retail where visibility drives decisions. Bezel-free tiling, 4K/8K support, and brightness above 700 nits expand usability. Scale economies cut costs 42% since 2018, accelerating adoption across diverse commercial and public environments.
41-inch to 80-inch displays grow at 7.1% CAGR, serving conference rooms, retail stores, restaurants, and education. This range delivers optimal size-to-cost balance, supports existing infrastructure, offers flexible mounting, and represents the highest-volume commercial deployment segment globally across diverse industry applications.
Product Type Analysis
Video wall configurations lead the product type segment with 40% market share, valued near US$7.23 billion in 2026, serving control rooms, retail environments, corporate lobbies, and entertainment venues requiring large-scale visual presence. They combine multiple panels into seamless displays from 2x2 layouts to systems exceeding 100 screens. Narrow bezel technology at 0.9mm, advanced controllers, real-time visualization, and dynamic zone management support transportation centers, flagship retail, and broadcast studios globally today.
Touchscreen displays are the fastest-growing product type at 7.8% CAGR through 2033, driven by interactive wayfinding, collaborative workspaces, education, and self-service kiosks. Capacitive touch supporting over 40 simultaneous touch points enables intuitive multi-user interaction across transport hubs and retail showrooms.
Deployment Type Analysis
Installed deployments dominate with 67% market share, valued near US$12.11 billion in 2026, reflecting permanent use across retail stores, corporate offices, transport facilities, and public venues. These installations are long-term capital assets with 5–10-year lifespans, supporting premium quality, professional installation, and warranties. Buyers emphasize reliability, energy efficiency, and building system integration. The segment benefits from recurring revenues via maintenance contracts, subscriptions, and refresh cycles driven by infrastructure projects globally today.
Rental deployment grows at 8.0% CAGR, fueled by event industry recovery, trade shows, and temporary marketing. Applications include conferences, launches, sports, and pop-up retail. The US$1,100 billion global events industry sees 68% adoption of digital displays for visual engagement impact.
Backlight Technology Analysis
LED Backlit displays dominate with 81% market share, valued near US$14.64 billion in 2026, delivering high brightness, accurate color, energy efficiency, and long operational lifespans versus CCFL. LED backlighting supports local dimming, slimmer panels, installation flexibility, and mercury-free compliance. Power savings of 35–50% cut ownership costs, recovering premiums within 18–24 months while CCFL phase-out and direct-view LED expansion accelerate global market transition across commercial and public display applications.
CCFL backlight technology declines yet retains about 5.0% CAGR within cost-sensitive segments and replacement markets serving legacy installations where lower pricing outweighs performance, efficiency, and regulatory requirements for advanced display solutions in emerging regions and budget constrained commercial use cases.
End Use Industry Analysis
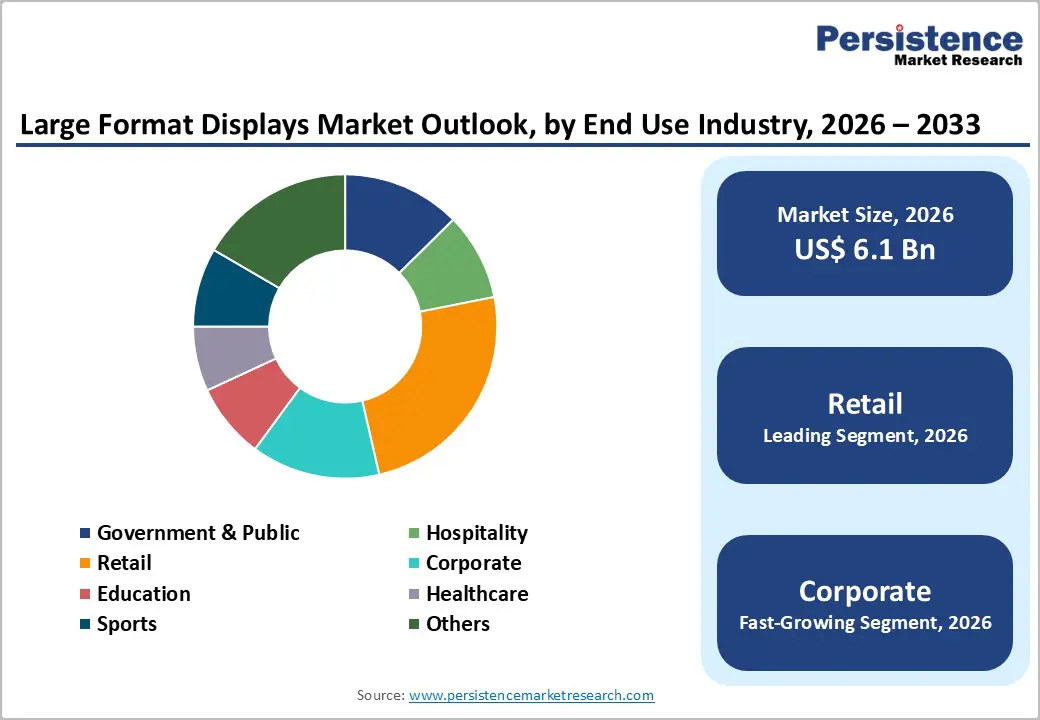
Retail leads end-use with 25% market share, valued near US$4.52 billion in 2026, covering malls, department stores, specialty outlets, QSRs, and convenience stores using displays for ads, menus, and branding. Digital signage lifts dwell time 27%, conversions 18%, and brand value 32%. QSRs deploy digital menus across 420,000 sites, while fashion and grocery retailers use immersive visuals and promotions driving impulse purchases contributing 12% of revenue across global retail environments.
Corporate is the fastest-growing end-use at 7.5% CAGR, driven by hybrid work, collaboration investments, and real estate upgrades. Organizations deploy interactive displays in meeting rooms, lobbies, and shared spaces, supporting communication, productivity, and employee engagement as spending hits US$62.4 billion.
Regional Market Insights
North America
North America exhibits strong growth at a 6.9% CAGR, supported by mature commercial real estate, high corporate technology adoption, and extensive retail infrastructure undergoing digital transformation. The United States leads with 8.2 million installed commercial displays across retail, corporate, education, and transportation sectors. Enterprise technology spending above US$1.8 trillion annually includes sizable collaboration investments, with large format displays accounting for 14% of conference room budgets. Retail recovery accelerates signage spending, while Smart Cities initiatives across 108 municipalities boost public deployments. Competitive dynamics emphasize advanced integration, content management, and innovation in interactive, 8K, and AI-driven display technologies, positioning North America as a premium, high-value market.
Europe
Europe holds 25% market share, expanding at a 6.5% CAGR, driven by retail modernization, corporate sustainability goals, and smart city investments. Germany leads adoption through strong retail presence, automotive showrooms, and industrial facilities. The United Kingdom shows high activity across transport infrastructure, including London Underground, Heathrow Airport, and national rail networks. France and Spain record rising adoption in hospitality, retail, and public sectors. EU Ecodesign regulations favor energy-efficient LED technologies, while the Digital Europe Programme allocates €7.5 billion for public display infrastructure. Sustainability priorities, circular economy mandates, and GDPR requirements shape procurement, lifecycle expectations, and interactive analytics across the region.
Asia Pacific
Asia Pacific holds a dominant 38% market share, driven by retail infrastructure expansion, smart city development, and manufacturing cost advantages enabling affordable display solutions. China leads through domestic manufacturing strength, retail growth, and smart city investments exceeding US$58 billion, with retail sales reaching US$6.3 trillion in 2023 and digital signage penetration above 78% in major malls. Japan supports growth via transportation deployments across metros, rail stations, and airports. India is the fastest-growing market, supported by retail expansion, smart city programs in 100 cities, and corporate real estate development. ASEAN markets benefit from tourism recovery, mall construction, and factory monitoring needs.
Competitive Landscape
Strategic Developments
- In November 2025, Samsung Electronics expanded its LED display lineup with The Wall MPF series featuring enhanced brightness, AI upscaling to support up to 8K content, and simplified installation, targeting corporate spaces, lobbies, and premium environments with modular configurations globally demonstrating streamlined deployment and improved visual performance compared to traditional video walls.
Business Strategies
Market leaders pursue ecosystem strategies integrating hardware, software, and services creating comprehensive digital signage solutions with recurring revenue models. Technology differentiation emphasizes direct view LED innovation, 8K resolution capabilities, and AI-powered content optimization delivering superior visual quality and operational intelligence. Strategic partnerships with content management platforms, system integrators, and vertical market specialists expand market access and solution completeness. Geographic expansion targets high-growth emerging markets through local manufacturing and distribution partnerships, while vertical market specialization addresses sector-specific requirements in retail, corporate, transportation, and hospitality applications.
Companies Covered in Large Format Displays Market
- Samsung Electronics Co., Ltd.
- LG Electronics Inc.
- Sony Corporation
- Sharp NEC Display Solutions
- Panasonic Corporation
- Barco NV
- Planar Systems, Inc.
- ViewSonic Corporation
- Leyard Optoelectronic Co., Ltd.
- Daktronics, Inc.
- Christie Digital Systems
Frequently Asked Questions
The Large Format Displays Market is projected at US$18.08 Billion in 2026, expanding to US$29.30 Billion by 2033.
Primary drivers include widespread digital signage adoption, rising retail technology investments enhancing conversions, growing hybrid workforces demanding collaboration tools, and global smart city infrastructure expansion.
The market is projected to grow at a CAGR of 7.1% between 2026 and 2033.
Major opportunities lie in direct view LED technology with superior brightness and seamless setups, AI-powered interactive displays boosting engagement and conversions, and expanding retail infrastructure across emerging markets driving substantial growth.
Leading players include Samsung Electronics, LG Electronics, Sony Corporation, Sharp NEC Display Solutions, Panasonic Corporation, Barco NV, Planar Systems, ViewSonic Corporation, Leyard Optoelectronic, Daktronics Inc., Christie Digital Systems, Elo Touch Solutions, BenQ Corporation, AU Optronics, and BOE Technology Group.


