


- Oil & Gas
- Flare Gas Recovery System Market
Flare Gas Recovery System Market Size, Share, and Growth Forecast, 2025 - 2032
Flare Gas Recovery System Market by by Technology Type (Compressor-Based Systems and Ejector-Based Systems), by Pressure Type (Upto 5 Bar, 6 to 10 Bar, 11 to 15 Bar, 16 to 20 Bar, Above 20 Bar), by End-User (Oil & Gas, Petrochemical & Chemical, Power Generation, Others), by Installation (Onshore and Offshore), and Regional Analysis for 2025 - 2032
Flare Gas Recovery System Market Size and Trends Analysis
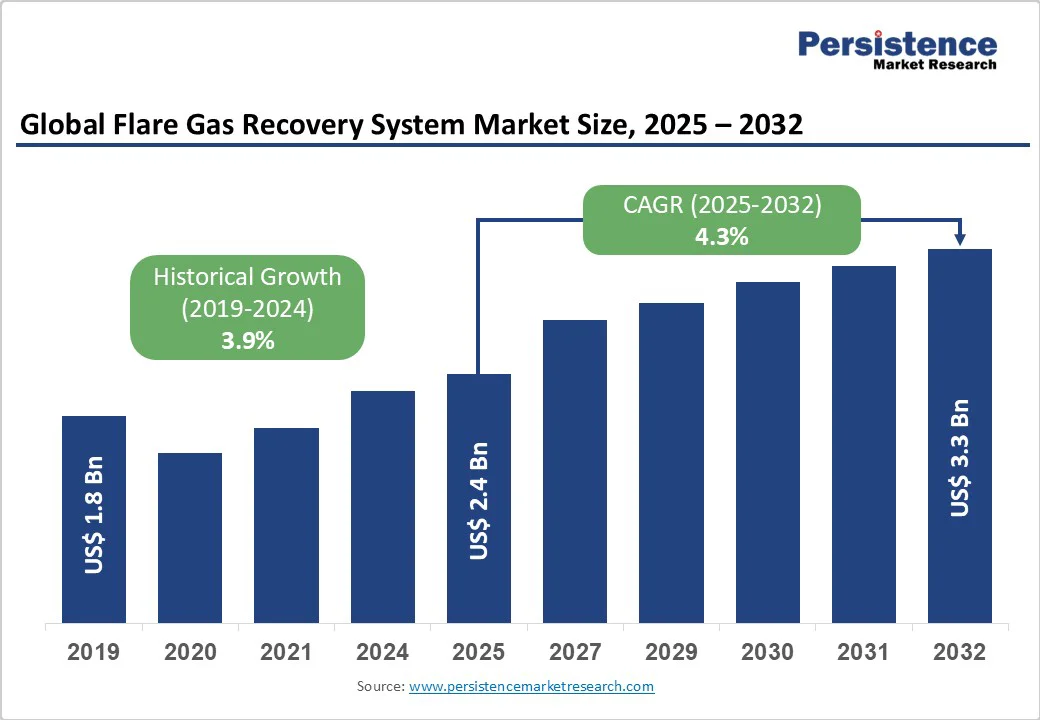
The global flare gas recovery system market size is likely to value at US$ 2.4 billion in 2025 and is projected to reach US$ 3.3 billion by 2032, growing at a CAGR of 5.2% between 2025 and 2032. The market demonstrated steady historical expansion from US$ 1.8 billion in 2019, reflecting a 3.5% CAGR. This growth trajectory is primarily driven by stringent environmental regulations targeting methane emissions reduction.
Key Industry Highlights:
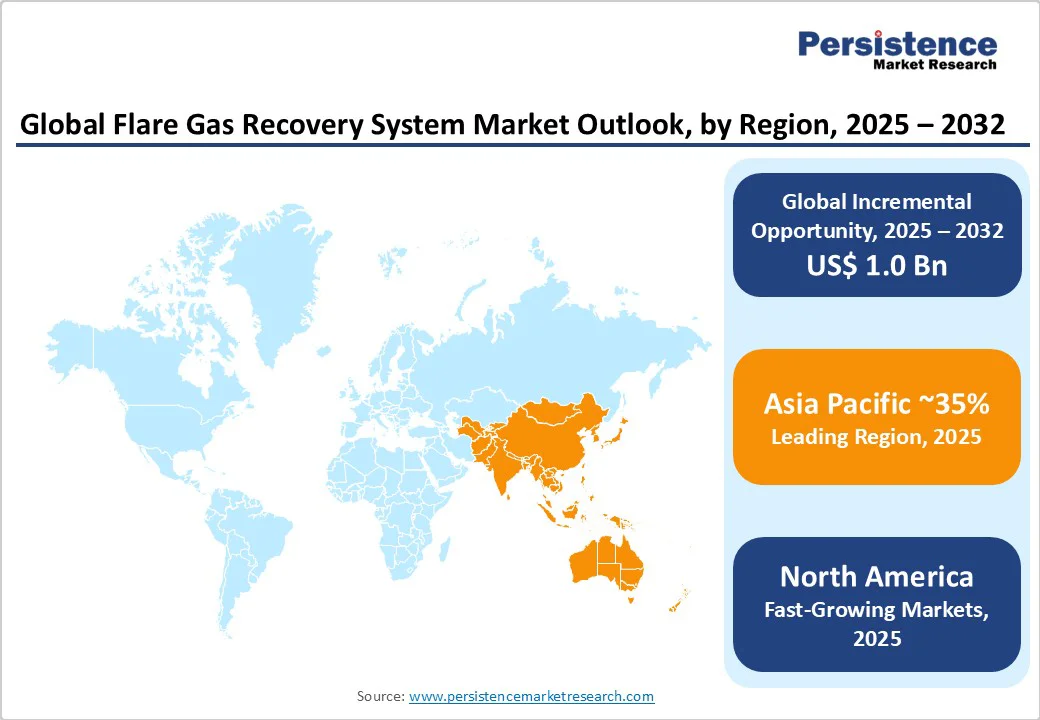
- Regional Leaders: Asia-Pacific leads with a 35% market share in 2025, recording the fastest growth at 6.8% CAGR. China’s commitment to 50% flaring reduction and the deployment of 650 new systems in 2024 remain central to regional leadership.
- Leading Segments: Compressor-based systems dominate with 44% technology share, while Oil & Gas applications account for 63.4% of total demand. Onshore installations represent the largest share at 71.2% of overall market value.
- Technology Performance: Advanced systems achieve up to 98% recovery efficiency, with more than 4,200 installations worldwide in 2024, capturing over 15 million metric tons of CO2 equivalent emissions annually.
- Regulatory Drivers: Global initiatives such as the World Bank’s Zero Routine Flaring by 2030, endorsed by 34 governments and 53 oil companies covering 60% of flaring volumes, alongside US EPA’s $1.36 billion funding, accelerate adoption.
- Growth Opportunities: Power generation emerges as the fastest-growing application, offshore installations expand at 21% annually, and emerging markets attract over US$210 million in development funding.
| Key Insights | Details |
|---|---|
|
Flare Gas Recovery System Market Size (2025E) |
US$ 2.4 Bn |
|
Market Value Forecast (2032F) |
US$ 3.3 Bn |
|
Projected Growth (CAGR 2025 to 2032) |
4.3% |
|
Historical Market Growth (CAGR 2019 to 2024) |
3.9% |
Market Dynamics
Growth Drivers - Stringent Environmental Regulations and Global Climate Initiatives
The implementation of comprehensive environmental regulations worldwide is the primary catalyst driving flare gas recovery system adoption. The U.S. EPA's Methane Emissions Reduction Program under the Inflation Reduction Act provides $1.36 billion in financial assistance and establishes a Waste Emissions Charge for methane emissions, compelling operators to invest in recovery systems.
The European Union's Regulation 2024/1787 on methane emissions reduction mandates similar requirements for importers, creating consistent global demand. The World Bank's Zero Routine Flaring by 2030 initiative has secured commitments from endorsers representing approximately 60% of global gas flaring, with participation growing from governments and oil companies seeking to eliminate routine flaring.
These regulatory pressures translate to potential penalties of $50,000 per day for non-compliance in key markets, creating substantial economic incentives for system deployment.
Technological Advancement and Digitalization
Advanced technology integration is revolutionizing flare gas recovery system performance and operational efficiency. Modern systems achieve recovery efficiencies exceeding 98% through enhanced compressor technologies, with efficiency improvements of 7-10% over 2023 models in offshore and FPSO applications. The adoption of AI-driven monitoring and control systems has increased by 17%, enabling predictive maintenance, real-time performance optimization, and automated response to varying gas compositions.
IoT-enabled remote monitoring capabilities facilitate continuous system oversight, reducing downtime and maintenance costs while improving overall reliability. Modular and skid-mounted system designs now account for 32% of new installations, offering reduced deployment times by 25% and lower installation costs, particularly valuable for remote and offshore operations.
Restraint - High Capital Costs and Operational Complexity Hinder Adoption
The adoption of flare gas recovery systems faces significant barriers due to high capital investment requirements and complex implementation processes. Medium-sized units typically cost around US$1.2 million, while larger systems can exceed US$3.5 million, creating financial challenges for smaller operators and facilities with limited regulatory pressure.
Integration with existing flare infrastructure demands specialized engineering and custom designs, extending project timelines by 6–9 months and increasing costs by 20–30%. Retrofitting older plants further escalates expenses, often doubling total costs due to structural modifications and operational disruptions.
In addition, variability in flare gas composition, such as high hydrogen sulfide or carbon dioxide concentrations causes reliability issues, with 17% of failures in 2024 linked to feed inconsistencies. These challenges require advanced gas conditioning, separation, and control systems, increasing both complexity and operational expenses.
Opportunity - Emerging Market Expansion and Infrastructure Development
Developing economies present substantial growth opportunities for flare gas recovery systems, with over 35% of flared gas remaining untapped in regions including Nigeria, Indonesia, and Mexico. Government incentives and grant programs in these markets are accelerating project development, with African nations attracting over $210 million in funding for gas flaring reduction infrastructure in 2024.
Asia-Pacific markets offer particularly strong potential, with China and India implementing government initiatives targeting 30-50% reductions in gas flaring volumes over the next decade. The expansion of offshore oil and gas development in Brazil and West Africa is driving FPSO-related system installations, which grew 21% in 2024, creating significant opportunities for specialized offshore recovery solutions.
Integration with Power Generation and Value-Added Applications
The convergence of flare gas recovery with distributed power generation represents a high-growth opportunity segment. Recovered gas utilization for on-site electricity production has expanded to 18% of total recovered volumes, enabling facilities to reduce energy costs and improve grid independence. Small-scale LNG production from recovered flare gas presents substantial revenue potential, with modular LNG plants capable of producing 10,000 gallons per day being deployed on portable platforms. The development of gas-to-liquid fuel (GTL) production, methanol synthesis, and synthetic fuel manufacturing creates additional value streams from recovered gas, with investment in these integrated solutions exceeding $2.8 billion globally in 2024.
Category-wise Analysis
Technology Type Insights - Compressor Systems Lead While Ejector Technologies Gain Ground
Compressor-based systems hold a dominant 44% market share, driven by their reliability and suitability for large-scale operations. These systems compress flare gas for reinjection or processing, proving effective in petroleum refineries, chemical facilities, and offshore platforms where high-volume, continuous processing is essential. Their leadership is reinforced by established maintenance networks and compatibility with existing industrial gas infrastructures.
In contrast, ejector-based systems are emerging as a cost-effective alternative, particularly for smaller or remote sites. Leveraging high-pressure motive fluids such as steam, water, or fuel gas, ejectors provide compact designs, reduced maintenance, and operational simplicity.
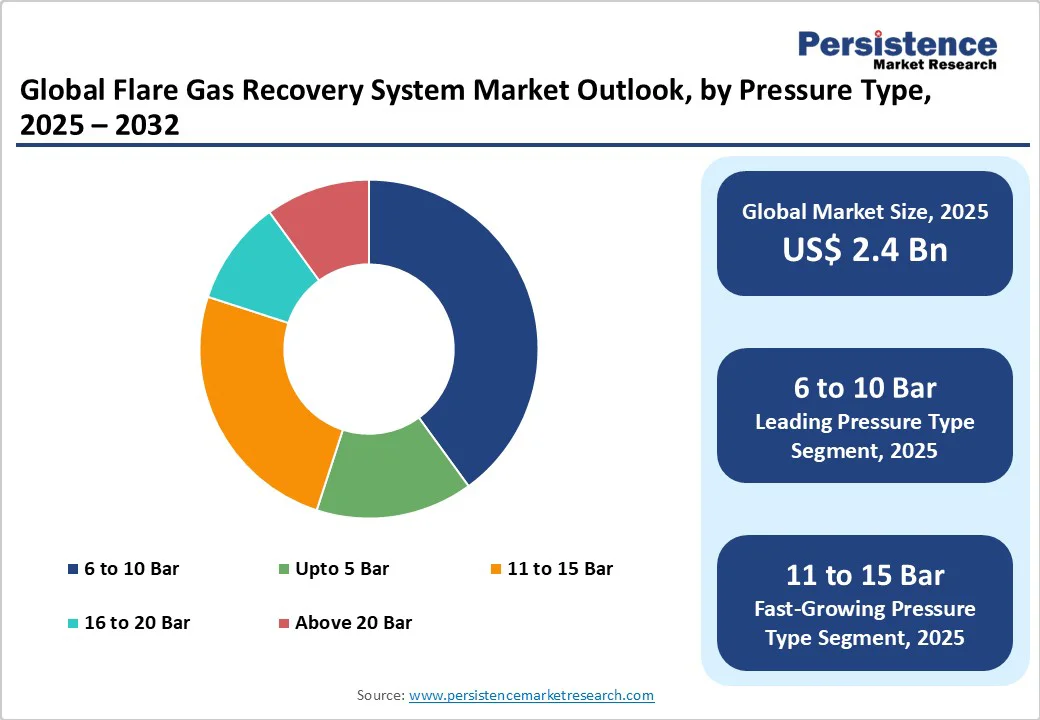
Pressure Type Insights - 6–10 Bar Range Leads While 11–15 Bar Segment Records Fastest Growth
The 6–10 bar pressure range leads the flare gas recovery market with a 31.2% share, valued at about US$ 0.75 billion in 2025. This range offers the ideal balance between compression energy efficiency and downstream processing needs, making it widely adopted across petroleum refineries, chemical facilities, and gas processing plants. Its dominance is attributed to cost-effective system design and suitability for medium-pressure industrial processes where moderate reinjection or utilization is sufficient.
The 11–15 bar range is the fastest-growing segment, fueled by rising demand for high-pressure applications in power generation and advanced gas processing. Growth is supported by gas-to-power projects using recovered gas in high-efficiency turbines and engines, along with advances in compression efficiency and broader adoption of combined heat and power (CHP) systems.
End-use Insights - Oil & Gas Sector Leads While Power Generation Emerges as Fastest-Growing Application
Oil & gas applications dominate the flare gas recovery market with a 63.4% share. This leadership reflects the sector’s reliance on flare gas recovery across upstream facilities, offshore platforms, refineries, and gas processing plants, where recovered gas enhances efficiency and ensures regulatory compliance. The market is reinforced by strict environmental mandates, rising production volumes, and the economic potential of captured hydrocarbons, with leading operators such as ExxonMobil, BP, and Shell investing heavily to meet methane reduction targets.
In contrast, power generation is the fastest-growing application segment, driven by the use of recovered gas for distributed and grid-scale power projects. On-site generation via gas engines, microturbines, and CHP systems provides cost savings, energy security, and sustainability benefits, supported by global incentives.
Installation Insights - Onshore Installations Lead While Offshore Segment Expands Rapidly
Onshore installations dominate the flare gas recovery market with a 71.2% share. Their leadership is attributed to the prevalence of land-based oil and gas operations and industrial facilities, supported by lower installation costs, simpler logistics, and easier system maintenance. Onshore applications span shale operations, conventional fields, refineries, chemical plants, and gas processing facilities, where space availability and utility connections enable flexible system design and expansion.
In contrast, offshore installations are the fastest-growing segment, driven by rising deepwater oil and gas projects and the technical challenges of flare management in marine environments. Growth is pronounced in FPSOs, which recorded 21% expansion in 2024, and in regions such as Brazil, West Africa, and the North Sea, where specialized, compact, and high-reliability systems are in demand.
Regional Insights
North America Leads with Strong Regulations and Technological Advancements
North America holds the leading position in the flare gas recovery market with a 25% share. Growth is fueled by stringent U.S. regulations, including the Department of Energy’s US$ 1.36 billion Methane Emissions Reduction Program, the EPA’s New Source Performance Standards, and the Inflation Reduction Act’s Waste Emissions Charge. The Permian Basin remains a hotspot, with over 1,700 new systems deployed in 2024.
Regulatory initiatives such as OSHA’s zero routine flaring mandates and California’s participation in the World Bank’s Zero Routine Flaring by 2030 further accelerate adoption. Investment trends emphasize electrified compression and AI-driven monitoring. Key players include Zeeco (17% share) and John Zink Hamworthy (15%), alongside emerging modular system partnerships.
Europe Advances Through Stringent Regulations and Offshore Developments
Europe accounts for 20% of the global flare gas recovery market. Growth is driven by the EU’s Regulation 2024/1787 mandating methane reductions, alongside Norway and the UK’s zero routine flaring policies that supported 780 operational systems in 2024. Germany leads offshore North Sea projects requiring advanced recovery systems, while EU-wide emissions standards and the Industrial Emissions Directive ensure regulatory consistency.
Investment momentum is boosted by the European Investment Bank’s €320 million financing for emission reduction projects. The competitive landscape features Wärtsilä and MAN Energy Solutions offering advanced turbomachinery. Key opportunities include offshore wind-to-gas integration, carbon credit monetization, and Power-to-X projects. Russia’s status as Europe’s largest flarer also creates strong deployment potential.
Asia Pacific Leads Global Growth with Strong Policy Support and Industrial Expansion
Asia Pacific is the fastest-growing flare gas recovery market, accounting for a leading market share. China drives regional demand with initiatives targeting a 50% reduction in routine flaring by 2030, while India’s expanding petrochemical sector and Australia’s LNG exports further accelerate adoption. The region benefits from cost-efficient manufacturing, established supply chains, and government incentives, with project announcements rising 19% year-on-year. In 2024, China accounted for most of the 650 system deployments, Japan advanced IoT-enabled monitoring, and ASEAN countries enforced stricter flare recovery regulations.
Investment opportunities highlight small-scale LNG production, with modular plants producing 10,000 gallons/day at remote sites. The competitive environment combines global players and regional manufacturers, supported by offshore platform expansion and renewable energy integration.
Competitive Landscape
The flare gas recovery system market exhibits a moderately fragmented structure, with leading players holding approximately 25-30% combined market share, indicating significant opportunities for both consolidation and specialized market positioning.
Market concentration analysis reveals Zeeco leading with approximately 17% market share, followed by John Zink Hamworthy Combustion with 15% share, while the remaining market is distributed among numerous medium and small-scale manufacturers offering specialized solutions. This fragmentation reflects the diverse application requirements across different industries, pressure ranges, and installation environments.
Competitive positioning varies significantly by technology segment, with compressor-based system manufacturers focusing on reliability and performance, while ejector technology providers emphasize cost-effectiveness and simplified maintenance requirements.
Key Industry Developments:
- In June 2024, Wood secured a USD 46 million, three-year contract with TotalEnergies in Iraq. Wood will deliver design, procurement, and construction support for the 1st phase of the Associated Gas Upstream Project. This initiative aimed to capture flared gas in Basra for power generation and includes the development of a seawater treatment facility and a 1GW solar power plant.
- In September 2024, KPS Capital Partners acquired The Stephens Group, following the company’s strategic expansion of its acoustic and emissions control platform through multiple prior acquisitions.
Companies Covered in Flare Gas Recovery System Market
- Zeeco, Inc.
- John Zink Hamworthy
- Wood Group
- Honeywell International Inc.
- Baker Hughes
- ABB Ltd.
- Siemens Energy
- Schlumberger Limited
- Sulzer Ltd.
- KBR, Inc.
- TechnipFMC
- McDermott International
- Other Market Players
Frequently Asked Questions
The Flare Gas Recovery System market is estimated to be valued at US$ 2.4 Bn in 2025.
A key demand driver for the Flare Gas Recovery System (FGRS) market is the increasing stringency of environmental regulations and emissions-control policies, which force oil & gas, petrochemical, and other industrial operators to reduce flaring and methane emissions.
In 2025, the Asia Pacific region will dominate the market with an exceeding 35% revenue share in the global Flare Gas Recovery System market.
Among the End-user, Oil & Gas holds the highest preference, capturing beyond 63.4% of the market revenue share in 2025, surpassing other parts.
The key players in the Flare Gas Recovery System market are Zeeco, Inc., John Zink Hamworthy, Wood Group and Honeywell International Inc.


