


- Electric Mobility
- CNG and LPG Vehicle Market
CNG and LPG Vehicle Market Size, Share, Trends, Growth, and Forecasts for 2025 - 2032
CNG and LPG Vehicle Market by Fuel Type (CNG and LPG), Product Type (passenger cars and commercial vehicles), Distribution Channel (OEMs and retrofitting channels), and Regional Analysis for 2025 - 2032
CNG and LPG Vehicle Market Size and Forecast
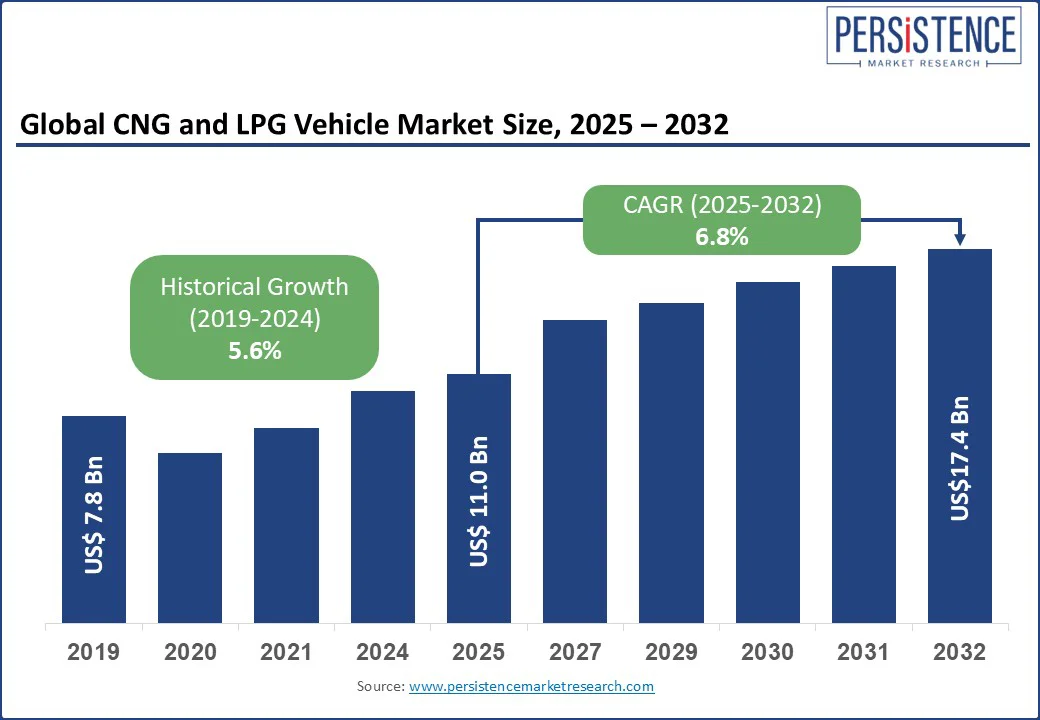
The global CNG (Compressed Natural Gas) and LPG (Liquefied Petroleum Gas) vehicle market size is likely to be valued at US$ 11.0 billion in 2025 and is expected to reach US$ 17.4 billion by 2032, growing at a CAGR of 6.8% during the forecast period (2025 - 2032). This growth in the Alternative Fuel Vehicles market is fueled by stringent Emission Regulations, government incentives promoting Alternative Fuels, and advancements in vehicle technology.
CNG and LPG vehicles offer significantly lower operating costs compared to petrol or diesel, thanks to cheaper fuel prices, making them an attractive choice for cost-conscious consumers and commercial fleet operators. Key regions driving demand include North America, Europe, and the Asia Pacific, with emerging economies showing significant potential due to urbanization and supportive policies.
Market Dynamics
Drivers
Stringent Emission Regulations
Governments across the globe are increasingly enforcing stricter Emission Regulations to address rising concerns over air pollution and climate change. These regulations are designed to reduce harmful pollutants emitted by conventional vehicles and promote the use of cleaner alternatives. For instance, the European Union's Euro 6 standards and India’s Bharat Stage VI norms impose stringent limits on vehicular emissions, compelling automakers and consumers to shift towards Eco-friendly Cars. Vehicles powered by Alternative Fuels such as CNG and LPG are gaining popularity, as they emit approximately 20-30% less CO2 than traditional gasoline-powered vehicles.
Incentives and Infrastructure Development
Subsidies, tax rebates, and strategic investments in refueling infrastructure are key drivers accelerating the adoption of Alternative Fuel Vehicles. For instance, India’s FAME scheme, while primarily focused on Electric Vehicles, indirectly supports cleaner fuel alternatives like CNG by promoting green transportation initiatives. As a result, India established over 4,000 CNG stations by 2024 to enhance accessibility. In Europe, countries encourage CNG and LPG vehicle adoption through fiscal incentives. For instance, Italy offers tax exemptions and reduced registration fees, helping boost its market share to 8% of total vehicle sales in 2023.
Restraints
Limited Refueling Infrastructure
The limited refueling infrastructure for Natural Gas Vehicles and Propane Cars. While station networks are expanding, they lag behind gasoline and diesel infrastructure. For instance, the U.S. has about 700 public CNG and 50 LNG stations, compared to over 109,000 gasoline stations, creating a significant disparity that limits adoption. This infrastructure gap restricts consumer confidence and fleet conversions, making the development of refueling networks a priority for policymakers.
Opportunities
Urbanization in Emerging Economies
Emerging economies are using rapid urbanization and rising incomes to boost the market for Clean Fuel Vehicles. For example, India’s CNG vehicle population nearly tripled from 2.6 million to 7.5 million. This surge is supported by urban demand, policy incentives, and infrastructure growth. OEMs like Maruti, Hyundai, and Tata launched over 30 CNG models, making the Best CNG SUVs for 2025 available to a wider audience. SIAM reports show that city-level CNG passenger vehicle share rose significantly due to affordable fuel and policy support.
Technological innovation
Technological innovation is transforming the CNG and LPG vehicle market, with key advancements in bi-fuel systems, engine efficiency, and hybrid integration. Bi-fuel systems, for instance, allow vehicles to switch seamlessly between gasoline and CNG, offering extended range and operational flexibility, such as the Maruti Suzuki Ertiga CNG. Enhanced engine designs now deliver improved combustion efficiency and reduced emissions, as seen in Tata Motors’ iCNG technology. Moreover, hybrid CNG-EV integration is emerging, where electric motors complement CNG engines for better fuel economy and lower carbon footprints. For instance, Hyundai’s concept hybrid CNG models. These innovations are boosting adoption and reducing dependency on conventional fuels.
Market Insights
Fuel Type
CNG maintains its dominance, projected to hold roughly 66% of the global CNG & LPG vehicle market share in 2025, driven by use in commercial fleets and urban transport. Its lower emissions and refueling infrastructure in countries like India and Italy bolster its dominance among Clean Fuel Vehicles.
LPG is the fastest-growing segment. Its rise is due to adoption in LPG cars with low emissions in Europe and the Asia Pacific, where compatibility with gasoline engines offers fuel flexibility. Incentives and tax rebates in countries like Turkey, Poland, and South Korea are further encouraging LPG vehicle purchases. Additionally, the availability of factory-fitted LPG variants by automakers such as Renault, Fiat, and Hyundai is making adoption easier and more appealing to consumers.
Product Type
Commercial vehicles dominate due to high fuel demands, with 70% of Delhi’s buses using CNG for cost and emission benefits. Passenger cars are the fastest-growing segment, driven by fuel savings, eco-awareness, and OEM offerings like Hyundai and Maruti’s CNG models, supported by subsidies and expanding refueling infrastructure across urban areas.
Consumer awareness of fuel savings and environmental benefits drives the growth of passenger CNG and LPG vehicles. OEMs like Hyundai and Maruti Suzuki support this trend with affordable, factory-fitted, eco-friendly models. Government incentives, expanding refueling infrastructure, and dual-fuel options further boost adoption, especially in urban and middle-income segments seeking cost-effective alternatives.
Sales Channel
OEMs dominate the market by offering factory-fitted CNG and LPG models, improving efficiency and safety. Brands like Tata Motors, Maruti Suzuki, and IVECO lead this shift. Standardization reduces conversion costs, ensures reliability, and supports emission norms, driving wider adoption across passenger and commercial vehicle segments through better performance and service.
Retrofitting is growing rapidly as fleet operators convert existing petrol or diesel vehicles to CNG or LPG to comply with emission regulations and reduce fuel expenses. It offers a cost-effective alternative to new vehicle purchases. The availability of certified retrofit kits and supportive government policies further accelerates adoption, especially in urban fleets.
Regional Insights
North America CNG and LPG Vehicle Market Trends
North America makes up 25% of the global market in 2025, led by the U.S. commercial fleet adoption of Natural Gas Vehicles.
- United States - The U.S. holds the largest share in North America, with over 175,000 natural gas vehicles, driven by commercial fleets and public transit initiatives like LA Metro and UPS.
- Canada - Vancouver’s TransLink added over 100 new CNG buses in 2024, reflecting a growing shift toward cleaner municipal transit supported by local environmental policies.
- Mexico - Over 60% of public taxis in Mexico City run on LPG, supported by extensive LPG infrastructure and government efforts to curb urban air pollution.
Europe CNG and LPG Vehicle Market Trends
Europe holds a 30% share in 2025, led by Italy, Germany, and France:
- Italy: Over 1 million CNG vehicles and 1,400 stations. CNG vehicles account for 10% of 2024 car sales. CNG vehicles made up 10% of 2024 car sales, reflecting strong consumer preference for low-emission options. Government tax benefits and incentives further strengthen CNG adoption, particularly in northern and central regions.
- Germany: A national push to reduce diesel vehicle dependence is accelerating the shift to alternative fuels like LPG. Focus on diesel reduction drives LPG adoption. LPG vehicle registrations rose 12% in 2023.
- France: 600 LPG stations and low-emission incentives boost Eco-friendly Cars. Low-emission incentives and tax exemptions are encouraging consumers to switch to LPG-powered, eco-friendly vehicles. Automakers like Dacia and Renault offer factory-fitted LPG models, further supporting mainstream adoption.
Asia Pacific CNG and LPG Vehicle Market Trends
Asia Pacific is the largest and fastest-growing region, holding a 40% market share in 2025:
- India: The Entire Delhi bus fleet runs on CNG. 1,000 new CNG stations were added between 2023 - 2024.OEMs like Maruti Suzuki and Tata Motors are leading the CNG segment, offering affordable factory-fitted CNG models.
- China: 5 million CNG vehicles by 2024, driven by urban emission cuts and state support.
- South Korea: Hyundai’s LPG and CNG vehicle offerings, combined with government subsidies, are driving a 15% annual growth in alternative fuel vehicle sales. LPG remains widely used among taxis and passenger cars, supported by a dense refueling infrastructure.
Competitive Landscape
The CNG and LPG vehicle market is highly competitive, with leading OEMs focusing on innovation, cost-efficiency, and clean mobility goals. AB Volvo targets Europe and North America with natural gas trucks aligned to emission norms. Hyundai promotes dual-fuel CNG cars in South Korea, while Tata Motors leads India’s market with affordable, retrofit-supported models. IVECO develops bio-CNG commercial vehicles supporting Europe’s green targets. Suzuki, through Maruti Suzuki, expands its low-emission LPG and CNG compact cars in Asia Pacific. These players leverage R&D, local manufacturing, and partnerships to boost adoption and market reach.
Key Developments
- 2024: Tata Motors launched a CNG passenger car for India’s urban market with 20% better fuel economy.
- 2023: Hyundai and South Korea's government added 200 new CNG refueling stations.
- 2024: IVECO introduced a hybrid CNG-diesel truck, reducing emissions by 15%.
Companies Covered in CNG and LPG Vehicle Market
- AB Volvo
- Hyundai Motor Company
- IVECO S.p.A
- Suzuki Motor Corporation
- Tata Motors Limited
- Other
Frequently Asked Questions
The CNG and LPG Vehicle market is projected to reach US$ 7.8 billion in 2025.
Stringent Emission Regulations, government incentives, and Fuel Cost Savings are the key market drivers.
The CNG and LPG Vehicle market is poised to witness a CAGR of 6.8% from 2025 to 2032.
Urbanization in emerging economies and innovative designs like Best CNG SUVs for 2025 are the key market opportunities.
AB Volvo, Hyundai Motor Company, IVECO S.p.A, Suzuki Motor Corporation, and Tata Motors Limited are key market players.


