


- Food Ingredients & Additives
- Cherry Concentrate Market
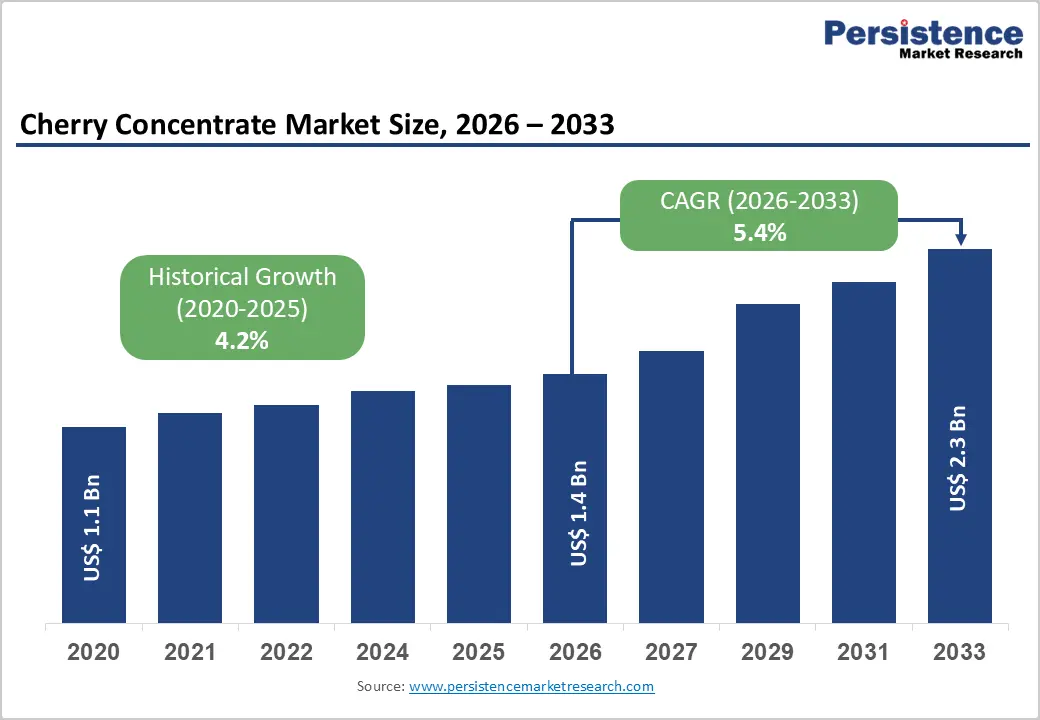
Cherry Concentrate Market Size, Share, Growth, and Regional Forecast, 2026 to 2033
Cherry Concentrate Market by Product Type (Aseptic Cherry Concentrate, Frozen Cherry Concentrate, Organic Cherry Concentrate, and Conventional Cherry Concentrate), Form (Liquid Concentrate, Powdered Concentrate, and Syrup Concentrate), Application (Beverages, Bakery & Confectionery, Dairy & Frozen Desserts, Sauces & Dressings, Nutraceuticals & Dietary Supplements, and Others) Distribution Channel (Foodservice, Specialty Stores, Online Retail, Supermarkets / Hypermarkets, and Others), and Regional Analysis from 2026 - 2033
Cherry Concentrate Market Share and Trend Analysis
The global cherry concentrate market size is estimated to grow from US$ 1.4 billion in 2026 to US$ 2.3 billion by 2033. The market is projected to record a CAGR of 5.4% during the forecast period from 2026 to 2033.
Increasing consumer preference for natural, fruit-based ingredients and functional nutrition is significantly supporting the growth of the cherry concentrate market. Rising awareness of antioxidant-rich foods, particularly those supporting recovery, sleep health, and immunity, is accelerating adoption across beverages, nutraceuticals, and food applications. Busy lifestyles and growing health consciousness are encouraging consumers to shift toward convenient, clean-label products with minimal processing. Additionally, demand for plant-derived flavoring and coloring agents is expanding in the food and beverage industry.
Wider availability through retail chains and e-commerce platforms is improving accessibility, while continuous innovation in premium blends, low-sugar formulations, and fortified drinks is strengthening long-term market expansion.
Key Industry Highlights:
- Leading Region: North America dominates with 47.5% share, supported by strong demand for functional beverages, high awareness of natural health ingredients, advanced food processing infrastructure, and increasing consumption of antioxidant-rich fruit concentrates.
- Fastest-Growing Region: Asia Pacific is emerging as the most dynamic region, driven by rising disposable incomes, urbanization, expanding beverage industry, and growing consumer inclination toward natural and preventive nutrition solutions.
- Leading Product Type Segment: Aseptic cherry concentrate leads with 32.8% due to extended shelf life, efficient bulk handling, and strong preference among manufacturers for consistent quality in large-scale beverage and food processing.
- Leading Distribution Channel Segment: Supermarkets / Hypermarkets account for 34.2%, supported by extensive product visibility, wide assortment availability, and their role as primary retail touchpoints for both conventional and premium fruit-based products.
Market Dynamics
Drivers - Growing Preference for Natural Antioxidant-Rich Ingredients and Functional Beverages Accelerating Demand
Increasing consumer focus on preventive healthcare and clean-label consumption is significantly driving demand for cherry concentrate across global markets. Rich in antioxidants, particularly anthocyanins, cherry concentrate is widely recognized for its anti-inflammatory, recovery-support, and sleep-enhancing properties, making it highly attractive for functional food and beverage applications. Rising awareness around natural solutions for muscle recovery, immunity, and overall wellness is encouraging the incorporation into juices, sports drinks, and dietary supplements.
The shift toward plant-based nutrition and reduced reliance on artificial additives further strengthens product adoption. Food and beverage manufacturers are increasingly utilizing cherry concentrate to enhance flavor profiles while maintaining natural ingredient claims. Growth in fitness culture and demand for post-exercise recovery products is also supporting increased consumption, particularly in developed economies. Additionally, the expansion of organized retail and e-commerce platforms has improved accessibility and consumer awareness.
Continuous innovation in blended beverages, low-sugar formulations, and premium fruit concentrates is enhancing market appeal. Increasing disposable incomes and willingness to spend on health-oriented products are further reinforcing sustained growth across both mature and emerging markets.
Restraints - Supply Chain Limitations, Price Volatility, and Quality Standardization Challenges Hindering Market Expansion
Fluctuations in raw material availability and pricing remain a key constraint impacting market growth. Cherry cultivation is highly dependent on climatic conditions, making supply vulnerable to seasonal variations, frost damage, and yield inconsistencies. This leads to price volatility and affects the cost structure for manufacturers relying on a stable input supply. Additionally, variations in fruit quality and sugar-acid balance can result in inconsistent concentrate characteristics, posing challenges for standardization in large-scale production.
High processing and storage costs, particularly for aseptic and frozen formats, further increase operational expenses. Smaller manufacturers often struggle to maintain consistent quality standards, which can impact product acceptance among large food and beverage companies. Moreover, competition from alternative fruit concentrates such as apple, grape, and berry blends limits market penetration, especially in price-sensitive regions. Limited consumer awareness in developing markets regarding the specific health benefits of cherry concentrate also restricts broader adoption.
Regulatory requirements related to food safety, labeling, and import standards add additional complexity, increasing compliance costs and delaying market entry in certain regions.
Opportunity - Expansion into Functional Nutrition, Premium Beverages, and Clean-Label Product Innovation, Creating Growth Potential
Rising demand for multifunctional food ingredients presents significant growth opportunities for cherry concentrate, particularly in functional beverages, nutraceuticals, and sports nutrition segments. Increasing consumer interest in natural sleep aids and recovery-enhancing products is positioning tart cherry concentrate as a key ingredient in premium wellness formulations. The clean-label movement is encouraging manufacturers to develop minimally processed, additive-free concentrates that align with evolving consumer expectations.
Emerging applications in ready-to-drink beverages, fortified juices, and plant-based dairy alternatives are further expanding the market scope. Growth of e-commerce platforms and direct-to-consumer brands is enabling targeted marketing and improved consumer engagement. Technological advancements in concentration and preservation techniques are enhancing product stability, flavor retention, and nutritional value, allowing premium positioning.
In addition, expanding demand in the Asia Pacific and Latin America, supported by rising disposable incomes and urbanization, offers untapped growth potential. Strategic collaborations between ingredient suppliers and beverage manufacturers are fostering innovation, while increasing investments in product differentiation and sustainable sourcing practices continue to unlock new revenue streams globally.
Category-wise Analysis
By Product Insights
Aseptic cherry concentrate is projected to lead the global market in 2026, accounting for 32.8% of total revenue. Its strong position is driven by superior shelf life, minimal need for preservatives, and high suitability for large-scale food and beverage processing. This format enables manufacturers to retain flavor, color, and nutritional integrity while ensuring ease of storage and transportation. Beverage producers particularly favor aseptic formats for consistent quality and reduced contamination risks. Rising demand for clean-label and minimally processed ingredients further accelerates adoption.
Additionally, its compatibility with bulk packaging and industrial applications supports cost efficiency across supply chains. Growing utilization in juices, concentrates, and functional drinks continues to strengthen its commercial relevance. As global demand for natural fruit-based ingredients expands, aseptic processing remains a preferred choice, reinforcing its leading share across diverse end-use industries.
By Application Insights
The beverages segment is expected to dominate the global cherry concentrate market with a 41.7% revenue share in 2026. This leadership is largely driven by increasing consumer preference for natural, antioxidant-rich drinks and functional beverages. Cherry concentrate, particularly tart variants, is widely incorporated into juices, sports recovery drinks, and wellness beverages due to its anti-inflammatory and sleep-support benefits. The shift toward clean-label and plant-based formulations further accelerates demand within this segment.
Manufacturers are actively innovating with ready-to-drink formats and blended fruit beverages to cater to evolving taste preferences. Strong distribution through retail and foodservice channels enhances accessibility. Additionally, rising health awareness and demand for preventive nutrition solutions continue to support high consumption levels. This combination of functionality, flavor appeal, and versatility firmly establishes beverages as the primary application area in the global market.
By Distribution Channel Insights
Supermarkets and hypermarkets are projected to hold the largest share of 34.2% in 2026, driven by their extensive reach and strong consumer trust. These retail formats provide high product visibility, enabling consumers to compare multiple brands and variants in one location. The availability of both conventional and premium cherry concentrate products supports diverse consumer preferences. In-store promotions, discounts, and sampling strategies further influence purchasing decisions.
Established supply chains and consistent inventory management ensure product availability across urban and semi-urban regions. While online channels are expanding rapidly, physical retail continues to dominate due to immediate product access and tangible evaluation of quality. Additionally, partnerships between manufacturers and large retail chains enhance shelf presence and brand recognition. This robust retail ecosystem ensures that supermarkets and hypermarkets remain the leading distribution channel in the global cherry concentrate market.
Region-wise Insights
North America Cherry Concentrate Market Trends
North America is projected to account for 47.5% of the global cherry concentrate market value in 2026, driven by strong demand for natural fruit-based ingredients and functional beverages. The region benefits from advanced food processing infrastructure, high clean-label awareness, and robust retail penetration. Increasing consumption of tart cherry concentrates for sleep support, recovery, and antioxidant benefits is further accelerating demand. Product innovation in RTD beverages and dietary supplements, coupled with expanding e-commerce distribution, continues to reinforce regional dominance.
U.S. Cherry Concentrate Market Trends
The U.S. dominates the regional market, contributing nearly 78.6% of North America’s share and expanding at a CAGR of 5.8%-6.5% through 2033. Growth is driven by high consumption of functional beverages, increasing demand for tart cherry in sports recovery and sleep aids, and strong presence of nutraceutical brands. Continuous product innovation and premiumization trends further support market expansion.
Canada Cherry Concentrate Market Trends
Canada holds approximately 21.4% of the regional market and is witnessing steady growth at a CAGR of 5.2%-5.8%. Rising demand for organic and clean-label fruit concentrates, along with increasing adoption of natural health products, is supporting growth. Expansion of online retail and specialty health stores is improving accessibility and consumer reach.
Europe Cherry Concentrate Market Trends
Europe represents a quality-driven and moderately growing market, accounting for approximately 26.8% of global demand in 2026. Growth is supported by strong preference for natural fruit ingredients, stringent food safety regulations, and rising demand for functional foods and beverages. Increasing adoption of tart cherry concentrate in nutraceuticals and sports nutrition is notable. However, market growth is slightly moderated by saturation in Western Europe and competition from alternative fruit concentrates.
Germany Cherry Concentrate Market Trends
Germany leads the regional market, contributing around 29.7% of Europe’s share, with a CAGR of 5.0%-5.6%. Demand is driven by strong consumer preference for high-quality, natural ingredients and increasing use of cherry concentrates in functional beverages and dietary supplements. Established retail infrastructure and strict quality standards support steady growth.
UK Cherry Concentrate Market Trends
The UK accounts for approximately 18.9% of the regional market and is growing at a CAGR of 5.9%. Rising demand for clean-label beverages, functional juices, and sports recovery products is fueling adoption. Strong e-commerce penetration and increasing consumer inclination toward natural wellness products further enhance market growth.
Asia Pacific Cherry Concentrate Market Trends
Asia Pacific is the fastest-growing region, expected to capture 19.6% of the global market in 2026, with a CAGR exceeding 6.5%-7.5% through 2033. Growth is driven by rising disposable incomes, increasing adoption of functional beverages, and expanding awareness of natural health ingredients. Rapid urbanization and strong growth in e-commerce channels are enhancing accessibility. The region also benefits from expanding food processing industries and growing demand for imported premium fruit concentrates.
China Cherry Concentrate Market Trends
China dominates the regional market, accounting for nearly 41.2% of Asia Pacific demand, with a CAGR of 7.5%-8.5%. Growth is driven by rising consumption of functional beverages, increasing demand for antioxidant-rich products, and expanding middle-class population. Strong domestic processing capabilities further support market expansion.
India Cherry Concentrate Market Trends
India holds approximately 17.6% of the regional market and is growing at a CAGR of 7.0%-7.8%. Increasing awareness of health-focused beverages, rising disposable incomes, and expanding nutraceutical consumption are key growth drivers. Growth in organized retail and online platforms is improving product availability across urban markets.
Competitive Landscape
The global cherry concentrate market is highly competitive, with strong participation from LemonConcentrate, Milne Fruit Products, H&H Products Company, Ve.Ba. Cooperativa Ortofrutticola S.C., and DÖHLER. These companies leverage integrated fruit sourcing networks, advanced processing technologies, and established food and beverage partnerships to enhance product quality and brand credibility. Rising demand for natural fruit-based ingredients, functional beverages, and clean-label formulations is driving product innovation and portfolio expansion.
Market players are strengthening distribution across retail and online channels, expanding global footprints, forming strategic collaborations, and increasing R&D investments to develop high-purity, minimally processed cherry concentrate solutions aligned with evolving consumer preferences.
Key Developments:
- In April 2026, Joyride introduced three new confectionery innovations. Among them, Joyride Fruit Chews feature individually wrapped candies with a juice-filled center, available in flavors such as strawberry, lemon, cherry berry, and fun drink variants. The launch highlights the company’s focus on expanding fruit-forward offerings and enhancing flavor innovation within the confectionery segment.
- In February 2026, The Coca-Cola Company marked four decades of cherry-flavored innovation by expanding its Cherry portfolio. The company introduced Coca-Cola Cherry Float, Coca-Cola Zero Sugar Cherry Float, and announced the nationwide rollout of Diet Coke Cherry. These new variants complement its existing Coca-Cola Cherry and Coca-Cola Zero Sugar Cherry offerings, with distribution across retail channels in the U.S. and Canada beginning in February.
- In August 2023, Artemis International announced the expansion of its CherryCraft portfolio, a range of tart cherry extracts designed to deliver varying standardized polyphenol levels. The expanded line enables dietary supplement and food and beverage manufacturers to customize formulations more effectively, allowing them to leverage the functional benefits of cherry polyphenols through tailored ingredient solutions aligned with specific product requirements.
Cherry Concentrate Market Report - Key Insights & Details
| Key Insights | Details |
|---|---|
| Historical Market Value (2020) | US$ 1.1 Mn |
| Current Market Value (2026) | US$ 1.4 Mn |
| Projected Market Value (2033) | US$ 2.3 Mn |
| CAGR (2026 - 2033) | 5.4% |
| Leading Region | North America, 47.5% share |
| Dominant Form | Liquid Concentrate, 61.4% share |
| Top-ranking Product Type | Aseptic Cherry Concentrate, 32.8% |
| Incremental Opportunity | US$ 0.9 Mn |
Companies Covered in Cherry Concentrate Market
- LemonConcentrate
- Milne Fruit Products
- H&H Products Company
- Ve.Ba. Cooperativa Ortofrutticola S.C.
- DÖHLER
- Cascadian Farm Organic
- Kerr by Ingredion
- Louis Dreyfus Company
- SECNA
- Ingredion Incorporated
- Shoreline Fruit, LLC
- Neil Jones Food Company
- Cherry Central Cooperative, Inc.
- Rasanco Ltd
- GNC Holdings, LLC
- Others
Frequently Asked Questions
The global cherry concentrate market is projected to be valued at US$ 1.4 Bn in 2026.
Rising demand for natural aphrodisiacs, increasing adoption of herbal supplements, and growing awareness of sexual and bone health benefits drive market growth.
The global cherry concentrate market is poised to witness a CAGR of 5.4% between 2026 and 2033.
Expansion into functional foods, premium high-purity extracts, and e-commerce-driven global reach offers key growth opportunities.
LemonConcentrate, Milne Fruit Products, H&H Products Company, Ve.Ba. Cooperativa Ortofrutticola S.C., and DÖHLER are some key players in the cherry concentrate market.


