


- Executive Summary
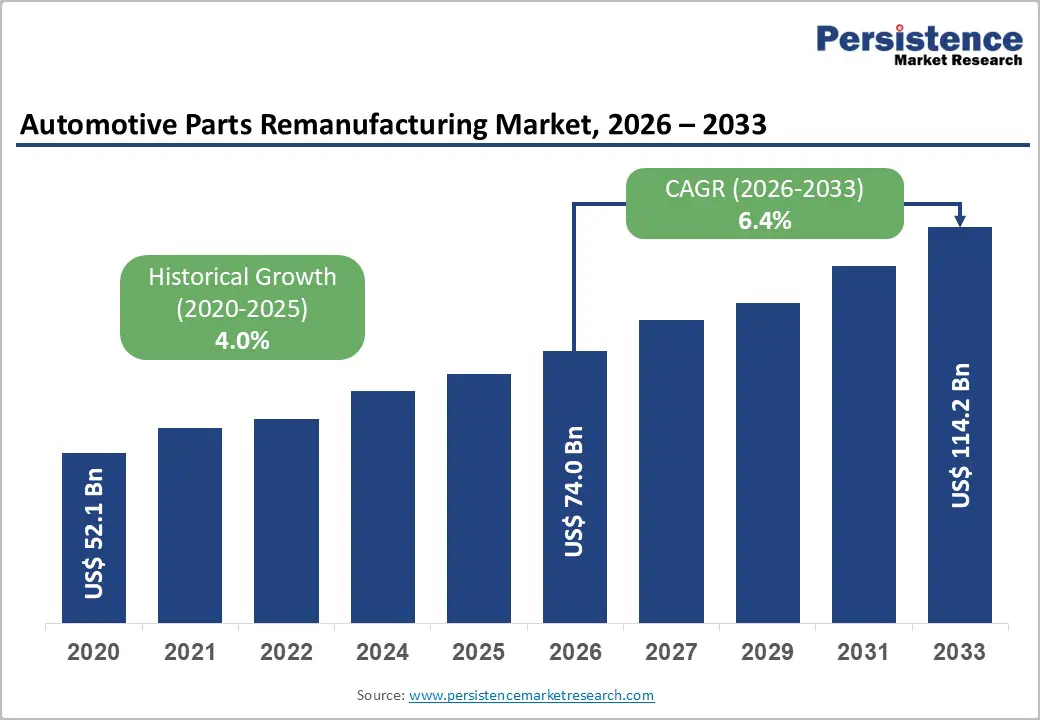
- Global Automotive Parts Remanufacturing Market Snapshot 2026 and 2033
- Market Opportunity Assessment, 2026 - 2033, US$ Mn
- Key Market Trends
- Industry Developments and Key Market Events
- PMR Analysis and Recommendations
- Market Overview
- Market Scope and Definitions
- Value Chain Analysis
- Macro-Economic Factors
- Global GDP Outlook
- Global Vehicle Production by Region
- Regulation of Automotive Age by Region
- Global Investment for Green Manufacturing Overview
- Forecast Factors - Relevance and Impact
- COVID-19 Impact Assessment
- PESTLE Analysis
- Porter's Five Forces Analysis
- Geopolitical Tensions: Market Impact
- Regulatory and Technology Landscape
- Market Dynamics
- Drivers
- Restraints
- Opportunities
- Trends
- Price Trend Analysis, 2020 - 2033
- Region-wise Price Analysis
- Price by Segments
- Price Impact Factors
- Global Automotive Parts Remanufacturing Market Outlook:
- Key Highlights
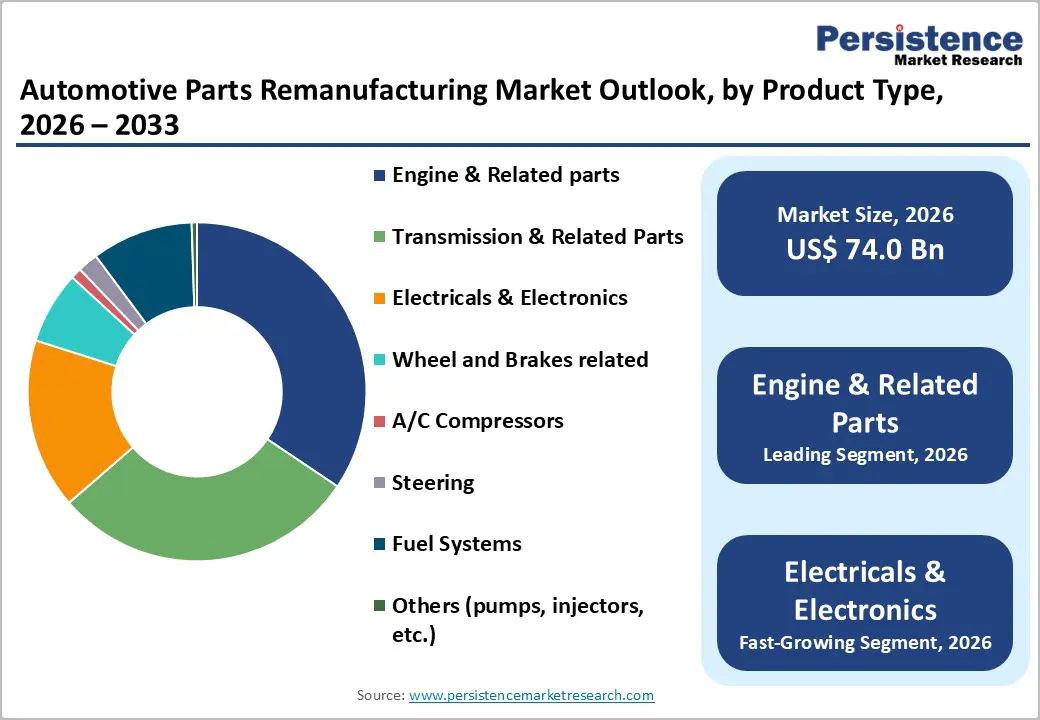
- Global Automotive Parts Remanufacturing Market Outlook: Component Type
- Introduction/Key Findings
- Historical Market Size (US$ Mn) and Volume (Th. Units) Analysis by Component Type, 2020 - 2025
- Current Market Size (US$ Mn) and Volume (Th. Units) Analysis and Forecast, by Component Type, 2026-2033
- Engine and Related parts
- Turbochargers
- Engine
- Carburetors & Others
- Electricals & Electronics
- Starters
- Alternators
- Others
- Transmission & Related Parts
- Gearbox
- Clutches
- Other Transmission Components
- Wheel and Brakes related
- Hub Assemblies
- Master Cylinders
- Brake Calipers
- Bearings
- A/C Compressors
- Steering
- Fuel Systems
- Others (pumps, injectors, etc.)
- Engine and Related parts
- Market Attractiveness Analysis: Component Type
- Global Automotive Parts Remanufacturing Market Outlook: Vehicle Type
- Introduction/Key Findings
- Historical Market Size (US$ Mn) and Volume (Th. Units) Analysis by Vehicle Type, 2020 - 2025
- Current Market Size (US$ Mn) and Volume (Th. Units) Analysis and Forecast, by Vehicle Type, 2026-2033
- Passenger Cars
- Light Commercial Vehicle
- Heavy Commercial Vehicle
- Off-Highway Vehicle
- All-Terrain Vehicles
- Market Attractiveness Analysis: Vehicle Type
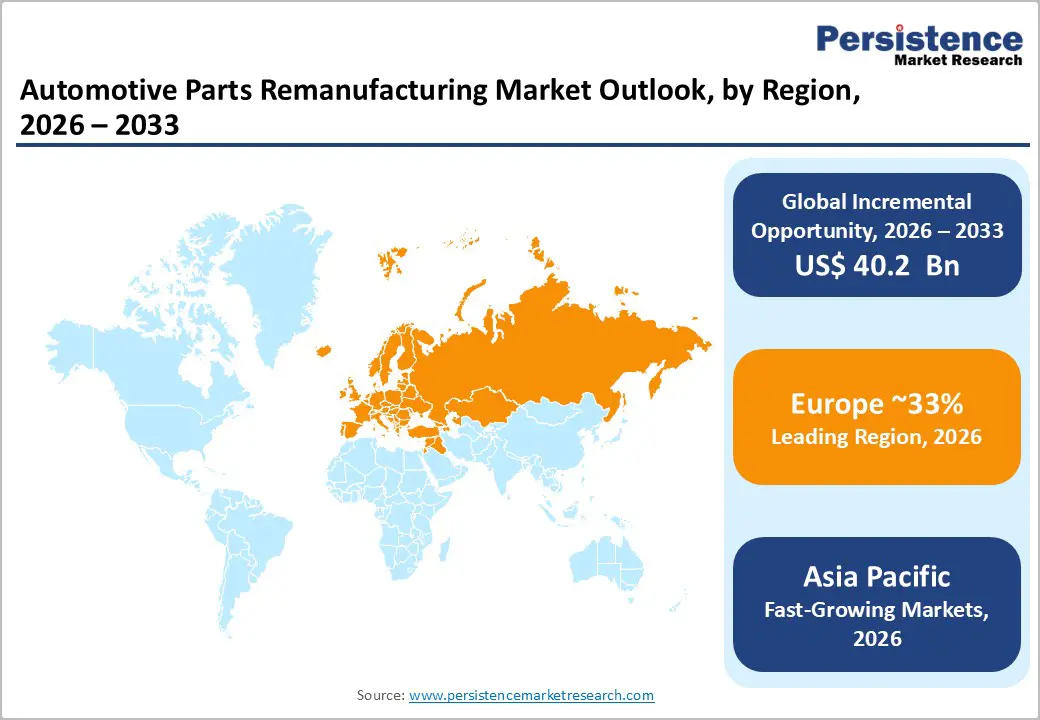
- Global Automotive Parts Remanufacturing Market Outlook: Region
- Key Highlights
- Historical Market Size (US$ Mn) and Volume (Th. Units) Analysis by Region, 2020 - 2025
- Current Market Size (US$ Mn) and Volume (Th. Units) Analysis and Forecast, by Region, 2026-2033
- North America
- Europe
- East Asia
- South Asia & Oceania
- Latin America
- Middle East & Africa
- Market Attractiveness Analysis: Region
- North America Automotive Parts Remanufacturing Market Outlook:
- Key Highlights
- Pricing Analysis
- North America Market Size (US$ Mn) and Volume (Th. Units) Analysis and Forecast, by Country, 2026-2033
- U.S.
- Canada
- North America Market Size (US$ Mn) and Volume (Th. Units) Analysis and Forecast, by Component Type, 2026-2033
- Engine and Related parts
- Turbochargers
- Engine
- Carburetors & Others
- Electricals & Electronics
- Starters
- Alternators
- Others
- Transmission & Related Parts
- Gearbox
- Clutches
- Other Transmission Components
- Wheel and Brakes related
- Hub Assemblies
- Master Cylinders
- Brake Calipers
- Bearings
- A/C Compressors
- Steering
- Fuel Systems
- Others (pumps, injectors, etc.)
- Engine and Related parts
- North America Market Size (US$ Mn) and Volume (Th. Units) Analysis and Forecast, by Vehicle Type, 2026-2033
- Passenger Cars
- Light Commercial Vehicle
- Heavy Commercial Vehicle
- Off-Highway Vehicle
- All-Terrain Vehicles
- Europe Automotive Parts Remanufacturing Market Outlook:
- Key Highlights
- Pricing Analysis
- Europe Market Size (US$ Mn) and Volume (Th. Units) Analysis and Forecast, by Country, 2026-2033
- Germany
- Italy
- France
- U.K.
- Spain
- Russia
- Rest of Europe
- Europe Market Size (US$ Mn) and Volume (Th. Units) Analysis and Forecast, by Component Type, 2026-2033
- Engine and Related parts
- Turbochargers
- Engine
- Carburetors & Others
- Electricals & Electronics
- Starters
- Alternators
- Others
- Transmission & Related Parts
- Gearbox
- Clutches
- Other Transmission Components
- Wheel and Brakes related
- Hub Assemblies
- Master Cylinders
- Brake Calipers
- Bearings
- A/C Compressors
- Steering
- Fuel Systems
- Others (pumps, injectors, etc.)
- Engine and Related parts
- Europe Market Size (US$ Mn) and Volume (Th. Units) Analysis and Forecast, by Vehicle Type, 2026-2033
- Passenger Cars
- Light Commercial Vehicle
- Heavy Commercial Vehicle
- Off-Highway Vehicle
- All-Terrain Vehicles
- East Asia Automotive Parts Remanufacturing Market Outlook:
- Key Highlights
- Pricing Analysis
- East Asia Market Size (US$ Mn) and Volume (Th. Units) Analysis and Forecast, by Country, 2026-2033
- China
- Japan
- South Korea
- East Asia Market Size (US$ Mn) and Volume (Th. Units) Analysis and Forecast, by Component Type, 2026-2033
- Engine and Related parts
- Turbochargers
- Engine
- Carburetors & Others
- Electricals & Electronics
- Starters
- Alternators
- Others
- Transmission & Related Parts
- Gearbox
- Clutches
- Other Transmission Components
- Wheel and Brakes related
- Hub Assemblies
- Master Cylinders
- Brake Calipers
- Bearings
- A/C Compressors
- Steering
- Fuel Systems
- Others (pumps, injectors, etc.)
- Engine and Related parts
- East Asia Market Size (US$ Mn) and Volume (Th. Units) Analysis and Forecast, by Vehicle Type, 2026-2033
- Passenger Cars
- Light Commercial Vehicle
- Heavy Commercial Vehicle
- Off-Highway Vehicle
- All-Terrain Vehicles
- East Asia Market Size (US$ Mn) and Volume (Th. Units) Analysis and Forecast, by , 2026-2033
- South Asia & Oceania Automotive Parts Remanufacturing Market Outlook:
- Key Highlights
- Pricing Analysis
- South Asia & Oceania Market Size (US$ Mn) and Volume (Th. Units) Analysis and Forecast, by Country, 2026-2033
- India
- Southeast Asia
- ANZ
- Rest of SAO
- South Asia & Oceania Market Size (US$ Mn) and Volume (Th. Units) Analysis and Forecast, by Component Type, 2026-2033
- Engine and Related parts
- Turbochargers
- Engine
- Carburetors & Others
- Electricals & Electronics
- Starters
- Alternators
- Others
- Transmission & Related Parts
- Gearbox
- Clutches
- Other Transmission Components
- Wheel and Brakes related
- Hub Assemblies
- Master Cylinders
- Brake Calipers
- Bearings
- A/C Compressors
- Steering
- Fuel Systems
- Others (pumps, injectors, etc.)
- Engine and Related parts
- South Asia & Oceania Market Size (US$ Mn) and Volume (Th. Units) Analysis and Forecast, by Vehicle Type, 2026-2033
- Passenger Cars
- Light Commercial Vehicle
- Heavy Commercial Vehicle
- Off-Highway Vehicle
- All-Terrain Vehicles
- Latin America Automotive Parts Remanufacturing Market Outlook:
- Key Highlights
- Pricing Analysis
- Latin America Market Size (US$ Mn) and Volume (Th. Units) Analysis and Forecast, by Country, 2026-2033
- Brazil
- Mexico
- Rest of LATAM
- Latin America Market Size (US$ Mn) and Volume (Th. Units) Analysis and Forecast, by Component Type, 2026-2033
- Engine and Related parts
- Turbochargers
- Engine
- Carburetors & Others
- Electricals & Electronics
- Starters
- Alternators
- Others
- Transmission & Related Parts
- Gearbox
- Clutches
- Other Transmission Components
- Wheel and Brakes related
- Hub Assemblies
- Master Cylinders
- Brake Calipers
- Bearings
- A/C Compressors
- Steering
- Fuel Systems
- Others (pumps, injectors, etc.)
- Engine and Related parts
- Latin America Market Size (US$ Mn) and Volume (Th. Units) Analysis and Forecast, by Vehicle Type, 2026-2033
- Passenger Cars
- Light Commercial Vehicle
- Heavy Commercial Vehicle
- Off-Highway Vehicle
- All-Terrain Vehicles
- Middle East & Africa Automotive Parts Remanufacturing Market Outlook:
- Key Highlights
- Pricing Analysis
- Middle East & Africa Market Size (US$ Mn) and Volume (Th. Units) Analysis and Forecast, by Country, 2026-2033
- GCC Countries
- South Africa
- Northern Africa
- Rest of MEA
- Middle East & Africa Market Size (US$ Mn) and Volume (Th. Units) Analysis and Forecast, by Component Type, 2026-2033
- Engine and Related parts
- Turbochargers
- Engine
- Carburetors & Others
- Electricals & Electronics
- Starters
- Alternators
- Others
- Transmission & Related Parts
- Gearbox
- Clutches
- Other Transmission Components
- Wheel and Brakes related
- Hub Assemblies
- Master Cylinders
- Brake Calipers
- Bearings
- A/C Compressors
- Steering
- Fuel Systems
- Others (pumps, injectors, etc.)
- Engine and Related parts
- Middle East & Africa Market Size (US$ Mn) and Volume (Th. Units) Analysis and Forecast, by Vehicle Type, 2026-2033
- Passenger Cars
- Light Commercial Vehicle
- Heavy Commercial Vehicle
- Off-Highway Vehicle
- All-Terrain Vehicles
- Competition Landscape
- Market Share Analysis, 2025
- Market Structure
- Competition Intensity Mapping
- Competition Dashboard
- Company Profiles
- ZF Friedrichshafen AG
- Company Overview
- Product Portfolio/Offerings
- Key Financials
- SWOT Analysis
- Company Strategy and Key Developments
- Valeo SA
- Robert Bosch GmbH
- Caterpillar
- BorgWarner Inc.
- AB Volvo
- Meritor Inc.
- CARDONE Industries
- BBB Industries
- Borg Automotive Group
- ATC Drivetrain
- Carwood Motor
- Genuine Parts Company
- Stellantis N.V.
- ZF Friedrichshafen AG
- Appendix
- Research Methodology
- Research Assumptions
- Acronyms and Abbreviations

Loading page data
Please wait a moment


