


- Executive Summary
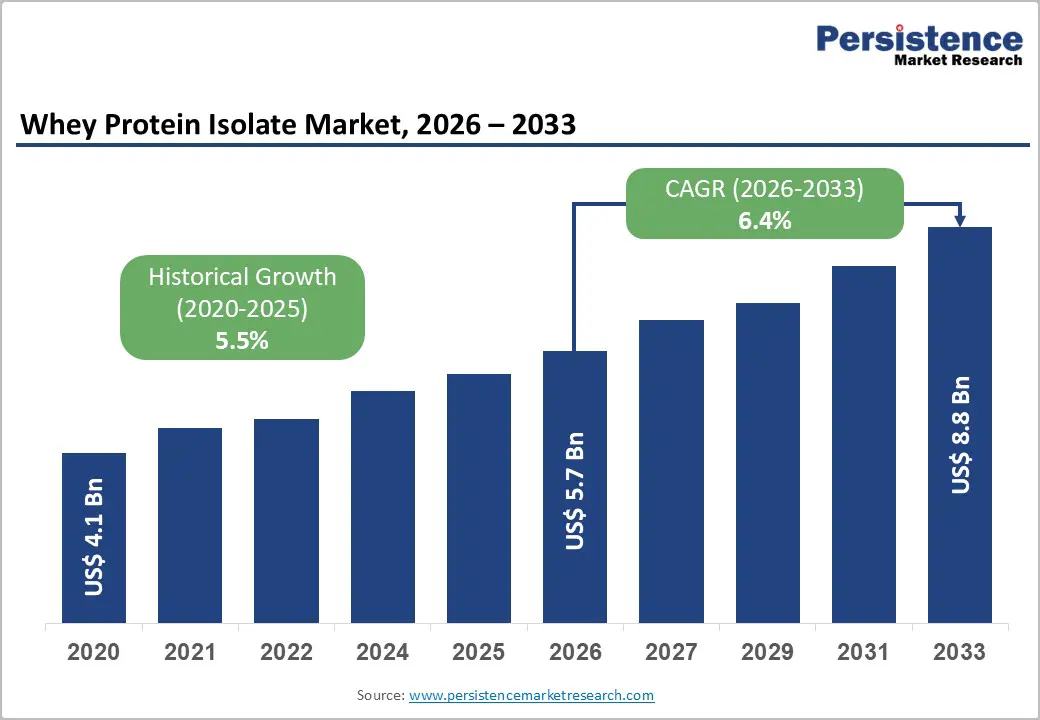
- Global Whey Protein Isolate Market Snapshot, 2026 and 2033
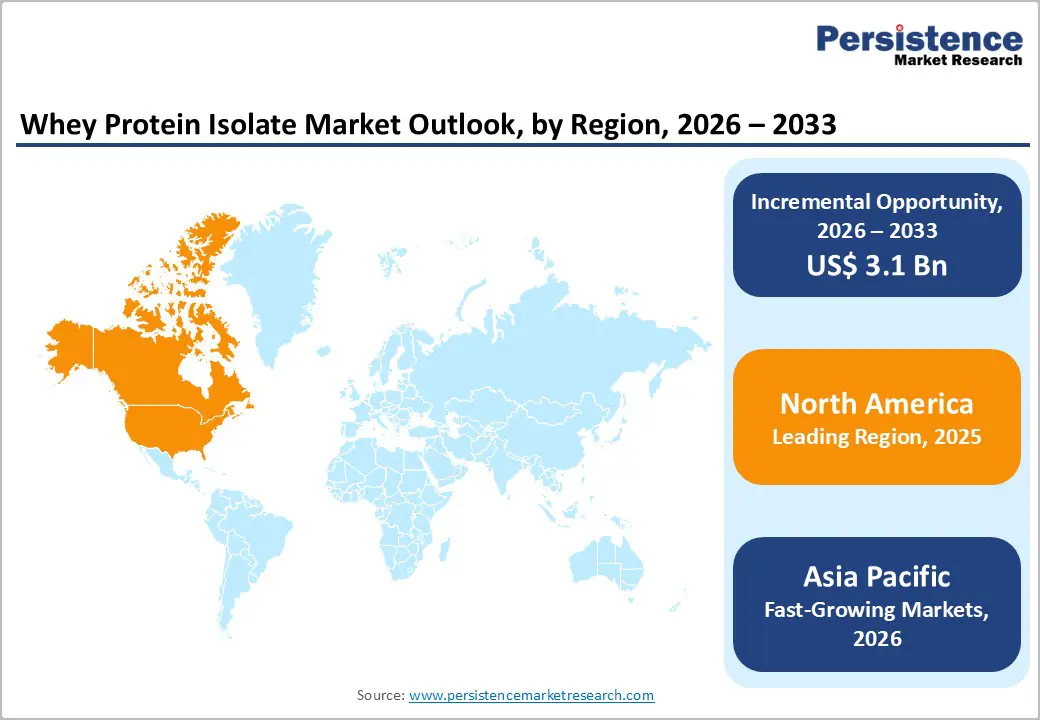
- Market Opportunity Assessment, 2026 - 2033, US$ Bn
- Key Market Trends
- Future Market Projections
- Premium Market Insights
- Industry Developments and Key Market Events
- PMR Analysis and Recommendations
- Market Overview
- Market Scope and Definition
- Market Dynamics
- Drivers
- Restraints
- Opportunity
- Challenges
- Key Trends
- COVID-19 Impact Analysis
- Forecast Factors - Relevance and Impact
- Value Added Insights
- Value Chain Analysis
- Key Market Players
- Regulatory Landscape
- PESTLE Analysis
- Porter’s Five Forces Analysis
- Trade Statistics
- Price Trend Analysis, 2020 - 2033
- Key Factors Impacting Product Prices
- Pricing Analysis, By Protein Content
- Regional Prices and Product Preferences
- Global Whey Protein Isolate Market Outlook
- Key Highlights
- Market Volume (Tons) Projections
- Market Size (US$ Bn) and Y-o-Y Growth
- Absolute $ Opportunity
- Market Size (US$ Bn) Analysis and Forecast
- Historical Market Size (US$ Bn) Analysis, 2020-2025
- Market Size (US$ Bn) Analysis and Forecast, 2026-2033
- Global Whey Protein Isolate Market Outlook: Protein Content
- Historical Market Size (US$ Bn) and Volume (Tons) Analysis, By Protein Content, 2020-2025
- Market Size (US$ Bn) and Volume (Tons) Analysis and Forecast, By Protein Content, 2026-2033
- Standard WPI (90-92% protein)
- High-Purity WPI (>95% protein)
- Market Attractiveness Analysis: Protein Content
- Global Whey Protein Isolate Market Outlook: Nature
- Historical Market Size (US$ Bn) and Volume (Tons) Analysis, By Nature, 2020-2025
- Market Size (US$ Bn) and Volume (Tons) Analysis and Forecast, By Nature, 2026-2033
- Organic
- Conventional
- Market Attractiveness Analysis: Nature
- Global Whey Protein Isolate Market Outlook: End Use
- Historical Market Size (US$ Bn) and Volume (Tons) Analysis, By End Use, 2020-2025
- Market Size (US$ Bn) and Volume (Tons) Analysis and Forecast, By End Use, 2026-2033
- Sports Nutrition
- Clinical Nutrition
- Infant & Early Life Nutrition
- Healthy Aging & Adult Nutrition
- Functional Foods & Beverages
- Others
- Market Attractiveness Analysis: End Use
- Key Highlights
- Global Whey Protein Isolate Market Outlook: Region
- Historical Market Size (US$ Bn) and Volume (Tons) Analysis, By Region, 2020-2025
- Market Size (US$ Bn) and Volume (Tons) Analysis and Forecast, By Region, 2026-2033
- North America
- Latin America
- Europe
- East Asia
- South Asia and Oceania
- Middle East & Africa
- Market Attractiveness Analysis: Region
- North America Whey Protein Isolate Market Outlook
- Historical Market Size (US$ Bn) and Volume (Tons) Analysis, By Market, 2020-2025
- By Country
- By Protein Content
- By Nature
- By End Use
- Market Size (US$ Bn) and Volume (Tons) Analysis and Forecast, By Country, 2026-2033
- U.S.
- Canada
- Market Size (US$ Bn) and Volume (Tons) Analysis and Forecast, By Protein Content, 2026-2033
- Standard WPI (90-92% protein)
- High-Purity WPI (>95% protein)
- Market Size (US$ Bn) and Volume (Tons) Analysis and Forecast, By Nature, 2026-2033
- Organic
- Conventional
- Market Size (US$ Bn) and Volume (Tons) Analysis and Forecast, By End Use, 2026-2033
- Sports Nutrition
- Clinical Nutrition
- Infant & Early Life Nutrition
- Healthy Aging & Adult Nutrition
- Functional Foods & Beverages
- Others
- Market Attractiveness Analysis
- Historical Market Size (US$ Bn) and Volume (Tons) Analysis, By Market, 2020-2025
- Europe Whey Protein Isolate Market Outlook
- Historical Market Size (US$ Bn) and Volume (Tons) Analysis, By Market, 2020-2025
- By Country
- By Protein Content
- By Nature
- By End Use
- Market Size (US$ Bn) and Volume (Tons) Analysis and Forecast, By Country, 2026-2033
- Germany
- France
- U.K.
- Spain
- Italy
- Russia
- Rest of Europe
- Market Size (US$ Bn) and Volume (Tons) Analysis and Forecast, By Protein Content, 2026-2033
- Standard WPI (90-92% protein)
- High-Purity WPI (>95% protein)
- Market Size (US$ Bn) and Volume (Tons) Analysis and Forecast, By Nature, 2026-2033
- Organic
- Conventional
- Market Size (US$ Bn) and Volume (Tons) Analysis and Forecast, By End Use, 2026-2033
- Sports Nutrition
- Clinical Nutrition
- Infant & Early Life Nutrition
- Healthy Aging & Adult Nutrition
- Functional Foods & Beverages
- Others
- Market Attractiveness Analysis
- Historical Market Size (US$ Bn) and Volume (Tons) Analysis, By Market, 2020-2025
- East Asia Whey Protein Isolate Market Outlook
- Historical Market Size (US$ Bn) and Volume (Tons) Analysis, By Market, 2020-2025
- By Country
- By Protein Content
- By Nature
- By End Use
- Market Size (US$ Bn) and Volume (Tons) Analysis and Forecast, By Country, 2026-2033
- China
- Japan
- South Korea
- Market Size (US$ Bn) and Volume (Tons) Analysis and Forecast, By Protein Content, 2026-2033
- Standard WPI (90-92% protein)
- High-Purity WPI (>95% protein)
- Market Size (US$ Bn) and Volume (Tons) Analysis and Forecast, By Nature, 2026-2033
- Organic
- Conventional
- Market Size (US$ Bn) and Volume (Tons) Analysis and Forecast, By End Use, 2026-2033
- Sports Nutrition
- Clinical Nutrition
- Infant & Early Life Nutrition
- Healthy Aging & Adult Nutrition
- Functional Foods & Beverages
- Others
- Market Attractiveness Analysis
- Historical Market Size (US$ Bn) and Volume (Tons) Analysis, By Market, 2020-2025
- South Asia & Oceania Whey Protein Isolate Market Outlook
- Historical Market Size (US$ Bn) and Volume (Tons) Analysis, By Market, 2020-2025
- By Country
- By Protein Content
- By Nature
- By End Use
- Market Size (US$ Bn) and Volume (Tons) Analysis and Forecast, By Country, 2026-2033
- India
- Indonesia
- Thailand
- ANZ
- Rest of South Asia & Oceania
- Market Size (US$ Bn) and Volume (Tons) Analysis and Forecast, By Protein Content, 2026-2033
- Standard WPI (90-92% protein)
- High-Purity WPI (>95% protein)
- Market Size (US$ Bn) and Volume (Tons) Analysis and Forecast, By Nature, 2026-2033
- Organic
- Conventional
- Market Size (US$ Bn) and Volume (Tons) Analysis and Forecast, By End Use, 2026-2033
- Sports Nutrition
- Clinical Nutrition
- Infant & Early Life Nutrition
- Healthy Aging & Adult Nutrition
- Functional Foods & Beverages
- Others
- Market Attractiveness Analysis
- Historical Market Size (US$ Bn) and Volume (Tons) Analysis, By Market, 2020-2025
- Latin America Whey Protein Isolate Market Outlook
- Historical Market Size (US$ Bn) and Volume (Tons) Analysis, By Market, 2020-2025
- By Country
- By Protein Content
- By Nature
- By End Use
- Market Size (US$ Bn) and Volume (Tons) Analysis and Forecast, By Country, 2026-2033
- Brazil
- Mexico
- Rest of Latin America
- Market Size (US$ Bn) and Volume (Tons) Analysis and Forecast, By Protein Content, 2026-2033
- Standard WPI (90-92% protein)
- High-Purity WPI (>95% protein)
- Market Size (US$ Bn) and Volume (Tons) Analysis and Forecast, By Nature, 2026-2033
- Organic
- Conventional
- Market Size (US$ Bn) and Volume (Tons) Analysis and Forecast, By End Use, 2026-2033
- Sports Nutrition
- Clinical Nutrition
- Infant & Early Life Nutrition
- Healthy Aging & Adult Nutrition
- Functional Foods & Beverages
- Others
- Market Attractiveness Analysis
- Historical Market Size (US$ Bn) and Volume (Tons) Analysis, By Market, 2020-2025
- Middle East & Africa Whey Protein Isolate Market Outlook
- Historical Market Size (US$ Bn) and Volume (Tons) Analysis, By Market, 2020-2025
- By Country
- By Protein Content
- By Nature
- By End Use
- Market Size (US$ Bn) and Volume (Tons) Analysis and Forecast, By Country, 2026-2033
- GCC Countries
- Egypt
- South Africa
- Northern Africa
- Rest of Middle East & Africa
- Market Size (US$ Bn) and Volume (Tons) Analysis and Forecast, By Protein Content, 2026-2033
- Standard WPI (90-92% protein)
- High-Purity WPI (>95% protein)
- Market Size (US$ Bn) and Volume (Tons) Analysis and Forecast, By Nature, 2026-2033
- Organic
- Conventional
- Market Size (US$ Bn) and Volume (Tons) Analysis and Forecast, By End Use, 2026-2033
- Sports Nutrition
- Clinical Nutrition
- Infant & Early Life Nutrition
- Healthy Aging & Adult Nutrition
- Functional Foods & Beverages
- Others
- Market Attractiveness Analysis
- Historical Market Size (US$ Bn) and Volume (Tons) Analysis, By Market, 2020-2025
- Competition Landscape
- Market Share Analysis, 2025
- Market Structure
- Competition Intensity Mapping By Market
- Competition Dashboard
- Company Profiles (Details - Overview, Financials, Strategy, Recent Developments)
- Glanbia plc
- Overview
- Segments and Protein Content
- Key Financials
- Market Developments
- Market Strategy
- Saputo Inc.
- Fonterra Co-operative Group
- Arla Foods Ingredients
- Lactalis Ingredients
- FrieslandCampina
- Agropur
- Hilmar Cheese Company
- Kerry Group plc
- Royal DSM
- Carbery Group
- Others
- Glanbia plc
- Appendix
- Research Methodology
- Research Assumptions
- Acronyms and Abbreviations

Loading page data
Please wait a moment


