


- Power Generation, Transmission, & Distribution
- Shunt Capacitor Market
Shunt Capacitor Market Size, Share, and Growth Forecast, 2026 - 2033
Shunt Capacitor Market by Voltage (Low, Medium, High), Application (Electrical Utilities, Industrial, Commercial), Capacitor (Fixed, Automatic), and Regional Analysis for 2026-2033
Shunt Capacitor Market Share and Trends Analysis
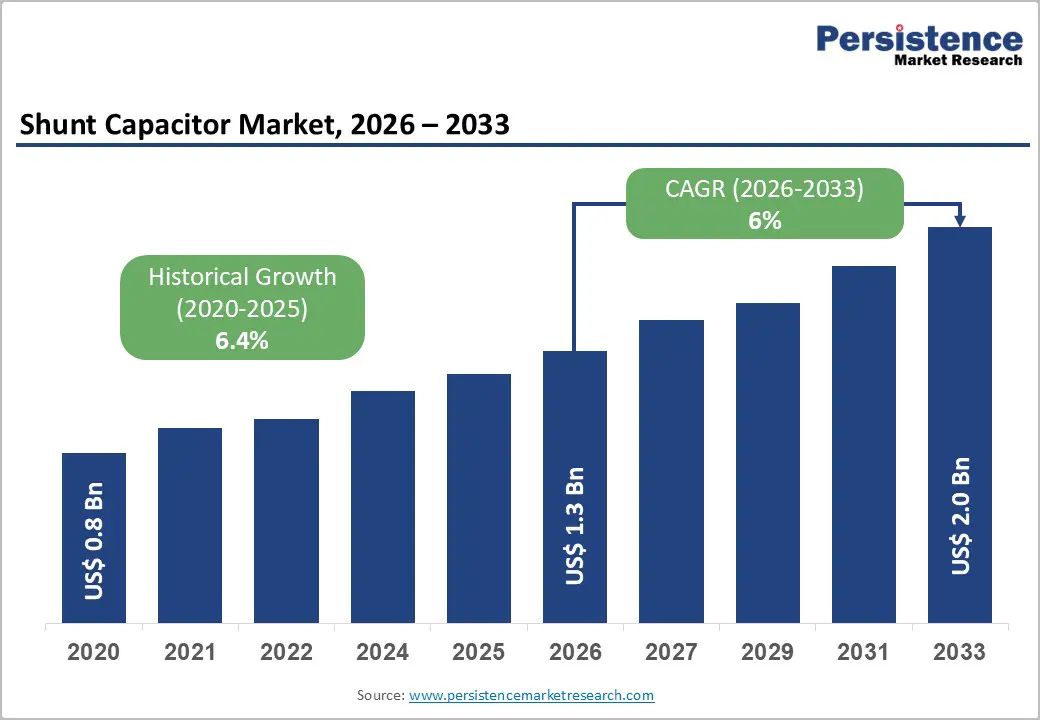
The global shunt capacitor market size is likely to be valued at US$ 1.3 billion in 2026, and is projected to reach US$ 2.0 billion by 2033, growing at a CAGR of 6% during the forecast period 2026−2033. Market growth is primarily being driven by accelerating investments in power grid modernization, as utilities are increasingly upgrading aging transmission and distribution infrastructure to improve voltage stability and reduce technical losses.
The expanding deployment of renewable energy assets, particularly wind and solar power, is also increasing the need for reactive power compensation, as variable generation profiles are placing greater stress on grid reliability and power quality. Regulatory frameworks continue to mandate stricter power factor correction requirements across industrial and commercial facilities, further strengthening demand for shunt capacitor installations. At the same time, the transition toward smart grid architectures is enabling more dynamic voltage regulation and automated grid management, which is favoring the adoption of advanced and digitally monitored shunt capacitor systems. Rising electricity consumption in emerging economies is also driving sustained demand, as utilities expand network capacity to support urbanization, industrialization, and electrification initiatives.
Key Industry Highlights
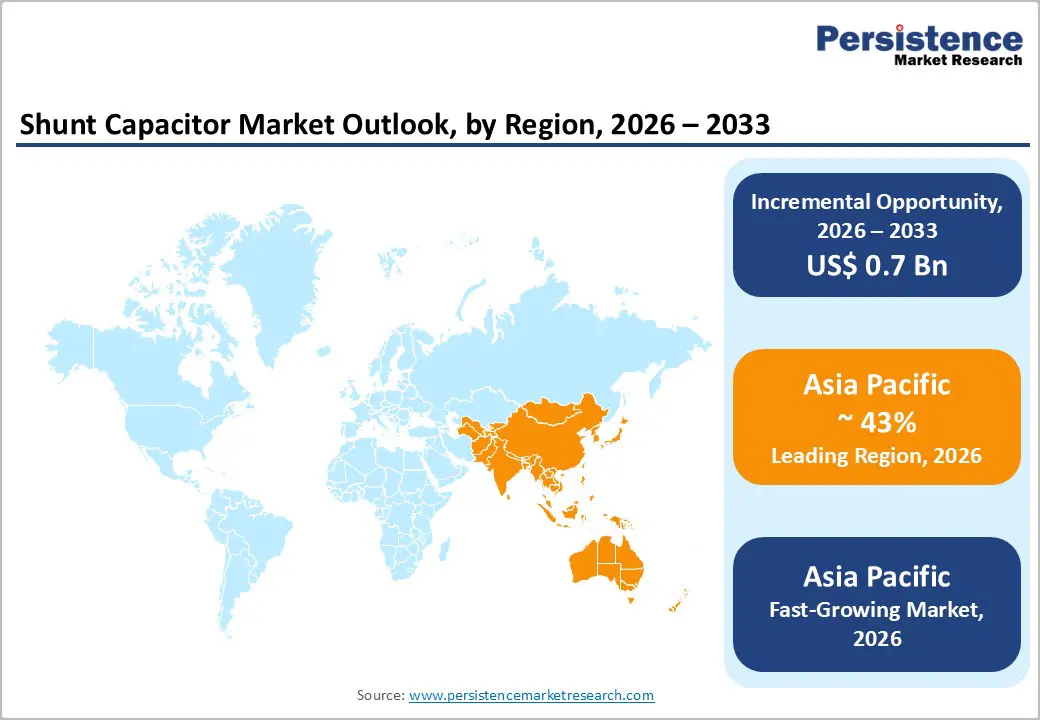
- Regional Dominance: Asia Pacific is likely to be the leading and the fastest-growing 2026-2033 market for shunt capacitors, accounting for approximately 43% of market share.
- Leading & Fastest-growing Voltage Type: Medium voltage is set to command approximately 64% of the market in 2026 revenue, whereas high voltage is likely to be the fastest-growing segment during the 2026-2033 forecast period.
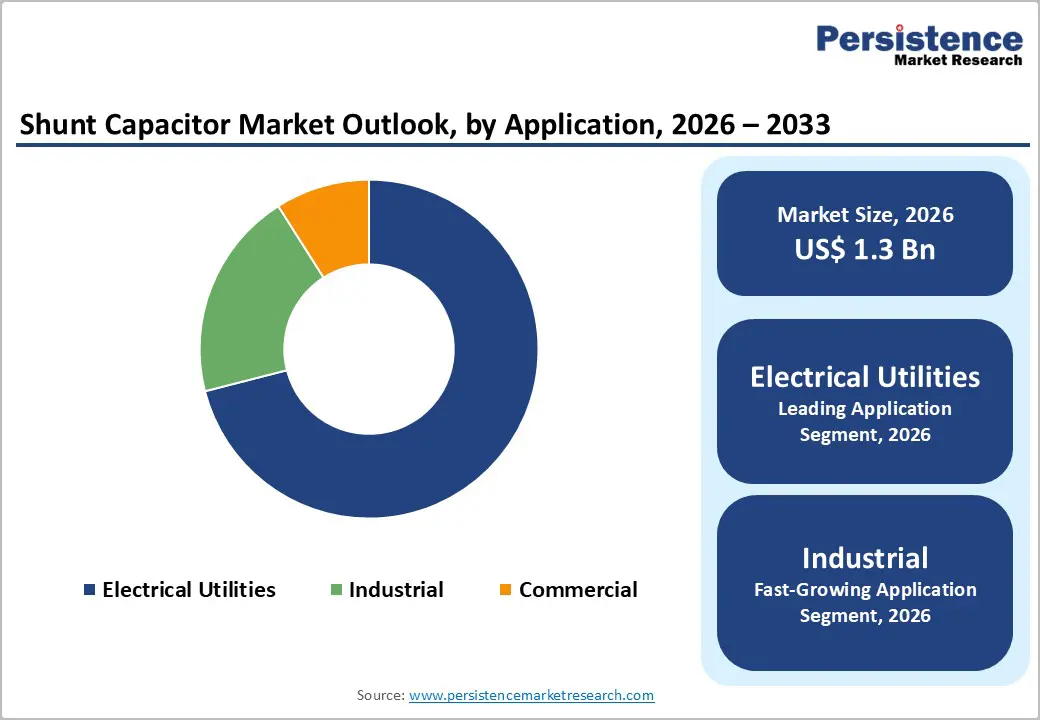
- Application Leadership: Electrical utilities are slated to secure an estimated 71% of the revenue share in 2026, while industrial applications are expected to register the highest 2026-2033 CAGR.
- Market Driver: Global investments in electrical grid infrastructure continue to rise as governments and utilities focus on reliability, resilience, and the integration of renewable energy sources, fueling the market.
- Market Opportunity: The convergence of modern power systems with digital communication technologies is creating a clear pathway for intelligent shunt capacitor solutions that provide both operational and strategic benefits.
| Key Insights | Details |
|---|---|
| Shunt Capacitor Market Size (2026E) | US$ 1.3 Bn |
| Market Value Forecast (2033F) | US$ 2.0 Bn |
| Projected Growth (CAGR 2026 to 2033) | 6% |
| Historical Market Growth (CAGR 2020 to 2025) | 6.4% |
Market Factors – Growth, Barriers, and Opportunity Analysis
Accelerating Grid Modernization and Transmission Infrastructure Investment
Global investments in electrical grid infrastructure continue to rise as governments and utilities focus on reliability, resilience, and the integration of renewable energy sources. For instance, India’s Ministry of Power estimates that the country’s power sector will attract investments worth INR 4.5 trillion by 2032. This environment creates a favorable setting for shunt capacitor solutions, as grid operators seek practical ways to strengthen voltage profiles, improve power quality, and manage reactive power across expanding networks. Utilities increasingly view power factor correction and voltage support as strategic tools for optimizing asset utilization and extending the life of existing infrastructure, rather than relying solely on new capacity additions. In this context, shunt capacitors form a key element of a broader grid modernization toolkit that also includes digital monitoring systems, automation platforms, and advanced protection schemes.
Policy and funding initiatives in regions such as North America and Europe increasingly recognize reactive power management equipment as essential grid assets that support long-term energy transition objectives. Power factor correction equipment, including fixed and switched-capacitor banks, prominently features in modernization roadmaps because it can deliver measurable improvements in efficiency and stability at a relatively modest incremental cost compared with large-scale hardware replacements. As utilities update technical specifications, they increasingly require shunt capacitor banks with integrated sensing, communication, and remote-control capabilities to align with grid automation strategies and distribution management systems. This shift favors solutions that combine robust hardware with digital functionality and lifecycle services, positioning shunt capacitors as enablers of both operational performance and regulatory compliance within evolving power systems.
Technical Complexity and Harmonic Distortion Concerns
Modern electrical networks now rely heavily on variable-frequency drives, power electronic converters, and other nonlinear loads, which significantly increase harmonic distortion within the system. These harmonics can interact unfavorably with shunt capacitors and can lead to malfunctions, premature aging, or resonance conditions that affect other connected assets. When harmonic currents flow through capacitor banks, they can magnify voltage distortion across the network, particularly in installations that do not comply with standards such as the Institute of Electrical and Electronics Engineers (IEEE) 519 guideline. This situation requires utilities and industrial operators to treat shunt capacitor deployment as a system-level engineering task rather than a simple component purchase, with careful attention to network configuration, operating scenarios, and long-term load evolution.
Many organizations, particularly in emerging markets or smaller industrial settings, may lack in-house expertise to perform this level of analysis, thereby increasing their dependence on qualified consultants and technology providers. Failures linked to harmonic resonance can result in costly downtime and damage to transformers, switchgear, and production equipment, thereby making decision-makers more cautious about approving new shunt capacitor projects. To move projects forward, developers often need to integrate complementary solutions, such as tuned or active harmonic filters, protective relays, and monitoring systems, which increase overall investment requirements and complicate business cases.
Smart Grid Technology Integration and Digital Transformation
The convergence of modern power systems with digital communication technologies is creating a clear pathway for intelligent shunt capacitor solutions that provide both operational and strategic benefits. Utilities can now deploy capacitor banks with real-time monitoring, predictive maintenance, and autonomous switching to support more dynamic grid operations. When shunt capacitors integrate features such as Internet of Things (IoT) sensors, edge computing, and secure cloud connectivity, operators can treat reactive power management as a controllable resource rather than a static asset. This shift enables more granular control over voltage profiles, closer alignment with distribution automation strategies, and better coordination with other smart grid investments focused on visibility and control.
Digitally enabled capacitor banks command higher upfront prices but can create strong lifecycle value when organizations assess projects on total cost of ownership rather than initial capital expenditure alone. Utilities that adopt smart capacitor systems can reduce manual site visits, shorten fault diagnosis times, and anticipate component degradation before it leads to service interruptions, thereby supporting higher reliability and better regulatory performance. The additional investment in connected solutions becomes justifiable when utilities quantify the benefits of avoided outages, lower maintenance requirements, and improved asset utilization across substations and feeders.
Category-wise Analysis
Voltage Insights
Medium voltage is expected to be the dominant segment, commanding approximately 64% of the shunt capacitor market revenue share in 2026. This segment serves distribution network applications where utilities deploy capacitor banks at primary substations, distribution feeders, and large commercial-industrial customer interconnection points. Medium-voltage applications benefit from optimal economic trade-offs among equipment costs, installation complexity, and reactive power delivery efficiency. Distribution utilities prioritize medium voltage capacitor installations due to their proximity to load centers, enabling effective voltage regulation and loss reduction throughout distribution networks. Utilities increasingly specify automatic switched-capacitor banks for medium-voltage applications, enabling dynamic reactive power compensation responsive to load variations and voltage conditions throughout daily and seasonal demand cycles.
High voltage is likely to be the fastest-growing segment during the 2026-2033 forecast period, driven by transmission network expansion and the development of extra-high-voltage systems in emerging economies. High-voltage applications include transmission substations and strategic network locations that require bulk reactive power compensation to maintain system voltage profiles and enhance power transfer capabilities. Technological developments, including gas-insulated capacitor configurations and compact substation designs, expand high voltage capacitor application opportunities in space-constrained urban environments and offshore renewable installations.
Application Insights
The electrical utilities segment is poised to be the dominant application area, accounting for around 71% of the shunt capacitor market share in 2026. Utilities deploy capacitor banks across transmission and distribution infrastructure to fulfill multiple operational objectives, including voltage regulation, reactive power compensation, power factor improvement, and transmission loss reduction. Regional transmission operators and distribution companies maintain systematic capacitor installation programs guided by network planning studies, power flow analysis, and regulatory reliability standards. The utility segment demonstrates stable demand characteristics aligned with capital expenditure budgets, regulatory frameworks, and long-term infrastructure development plans.
Industrial is expected to be the fastest-growing segment over the 2026-2033 forecast period, driven by energy cost optimization imperatives and regulatory compliance requirements. Manufacturing facilities across the steel, chemical processing, cement manufacturing, and automotive sectors deploy capacitor banks to correct poor power factor caused by inductive loads, such as motors, transformers, and welding equipment. The industrial segment demonstrates greater price sensitivity than utility applications, favoring standardized fixed-capacitor banks over advanced automatically switched configurations when load characteristics permit static compensation approaches.
Capacitors Insights
Fixed shunt capacitors are anticipated to lead, with an approximate 67% market revenue share in 2026. This segment maintains market leadership due to its widespread deployment across utility substations, industrial facilities, and distribution networks where reactive power requirements remain relatively constant throughout operational cycles. Fixed capacitor banks provide continuous reactive power compensation without switching mechanisms, offering simplicity, reliability, and cost-effectiveness for applications with stable load profiles. The segment faces competitive pressure from automatic systems in applications with variable load characteristics, yet maintains strong positioning through superior economics for constant compensation requirements.
Automatic is projected to be the fastest-growing segment during the 2026-2033 forecast period, driven by increasing demand for dynamic reactive power compensation, smart grid automation requirements, and load optimization capabilities. This technology incorporates switching mechanisms, typically vacuum contactors or thyristor switches, enabling capacitor banks to be energized or de-energized in response to real-time system conditions, voltage levels, or reactive power requirements. Automatic systems deliver superior operational flexibility, responding to daily load variations, seasonal demand fluctuations, and intermittent renewable generation patterns that characterize modern power systems.
Regional Insights
Asia Pacific Shunt Capacitor Market Trends
Asia Pacific is projected to be both the leading and fastest-growing regional market for shunt capacitors in 2026, accounting for approximately 43% of the market share, supported by large-scale transmission build-out, rapid industrialization, and accelerated renewable energy integration. Utilities in this region are expanding and reinforcing high-voltage and medium-voltage networks to accommodate growing loads, integrate solar and wind capacity, and improve power quality in both urban and rural areas. Within this context, shunt capacitors are no longer treated as peripheral components but as standard elements in substation designs, distribution reinforcement programs, and industrial power factor correction schemes, especially where grids must remain stable under variable and distributed generation profiles.
Manufacturing clusters in China, South Korea, and India provide cost and scale advantages, which allow regional suppliers to compete in international markets while still meeting local content requirements in their domestic markets. The most attractive opportunities are in three areas: partnering with transmission and distribution utilities on smart grid projects, supporting industrial customers in improving power quality as production shifts to Southeast Asia, and addressing rural and peri-urban electrification needs with standardized, modular capacitor solutions that align with evolving regulatory frameworks and funding programs in emerging economies.
Europe Shunt Capacitor Market Trends
The European shunt capacitor market plays a pivotal role in supporting the region’s energy transition, grid reliability, and industrial competitiveness. The market’s development is closely tied to ambitious renewable energy objectives, cross-border transmission projects, and a stronger policy focus on energy efficiency in industrial and commercial sectors. Countries such as Germany, the United Kingdom, France, and Spain act as anchor markets, driven by a combination of national energy strategies and European Union (EU) frameworks that require more sophisticated reactive power management across transmission and distribution networks. In practice, shunt capacitors are now embedded in substation designs, renewable integration projects, and industrial power quality programs rather than treated as optional add-ons.
EU-level regulation and network codes provide a crucial framework for the technical and commercial environment in which shunt capacitor solutions compete. Directives and rules developed by the European Network of Transmission System Operators for Electricity (ENTSO-E) establish harmonized requirements for reactive power capability, grid connection, and system stability, and these requirements drive the systematic deployment of capacitor banks at converter stations, offshore wind hubs, and interconnection points. National frameworks such as Germany’s Renewable Energy Act and France’s multi-year energy plan reinforce these expectations by linking grid connection approvals and support mechanisms to compliance with defined power quality and system support criteria.
North America Shunt Capacitor Market Trends
In North America, the market for shunt capacitors is vital in strengthening grid reliability, renewable integration, and industrial competitiveness across the United States and Canada. The United States accounts for most of the regional demand because it has an extensive transmission and distribution network, a large and diverse industrial base, and wide-ranging grid modernization programs that focus on resilience and clean energy integration. Funding mechanisms that prioritize infrastructure renewal and clean energy create a supportive environment for reactive power compensation projects, in which shunt capacitors are standard components in substation upgrades, line reinforcement programs, and distribution automation initiatives. As a result, shunt capacitor investments are no longer viewed as discretionary additions but as integral elements of power system planning and regulatory compliance strategies.
Regulatory and policy structures further shape the market by embedding reactive power and power quality requirements into interconnection rules, reliability standards, and state-level clean energy programs. Organizations such as the North American Electric Reliability Corporation (NERC) and the Federal Energy Regulatory Commission (FERC) set expectations for reactive power support in the bulk power system, while state initiatives promote high-power-quality standards in industrial and commercial facilities. The most attractive opportunities for market participants include replacing aging capacitor assets, integrating advanced and digitally enabled banks into distribution networks with significant renewable and distributed energy resource penetration, and delivering engineered solutions that combine hardware, monitoring, and lifecycle services to help utilities achieve evolving reliability and decarbonization objectives.
Competitive Landscape
The global shunt capacitor market structure exhibits moderate concentration, with leading suppliers such as ABB, Siemens Energy, Eaton Corporation, Schneider Electric, and Hitachi collectively accounting for an estimated 50–52% of total market revenues. These companies are maintaining strong market positions by emphasizing product reliability, long operational lifecycles, and robust technical support capabilities. Market leaders are increasingly competing on total cost of ownership rather than upfront pricing, as utilities and large industrial buyers are prioritizing long-term performance, grid stability, and maintenance efficiency. Global manufacturing footprints and well-established service networks are enabling these suppliers to respond quickly to project requirements across both developed and emerging markets.
Competitive strategies are continuing to evolve as suppliers integrate digital monitoring, condition-based maintenance, and smart grid compatibility into shunt capacitor offerings. Utility customers are demonstrating high supplier loyalty due to standardization advantages, compliance requirements, and risk-averse procurement processes that favor established vendors. In contrast, industrial end users are showing greater price sensitivity and openness to alternative suppliers, which is sustaining a more competitive environment in that segment. Ongoing consolidation, technology partnerships, and selective vertical integration are expected to reshape the competitive landscape, as suppliers are aligning product portfolios with grid modernization, renewable integration, and digital transformation priorities.
Key Industry Developments
- In January 2026, Vishay Intertechnology extended its 193 PUR-SI series miniature snap-in power aluminum electrolytic capacitors with 550 V and 600 V ratings. The higher voltage enables single-unit DC bus operation up to 1100 V without series connections or voltage-balancing resistors, saving space, cutting costs, and boosting reliability.
- In August 2025, Hitachi Energy supplied 15 custom-made shunt reactors from its Vaasa factory to NKT's new high-voltage AC and DC power cable test center in Karlskrona, Sweden, enhancing testing for next-generation high-voltage direct current (HVDC) systems to support global renewable energy infrastructure.
- In April 2025, BHEL, in consortium with Hitachi Energy India, secured a contract from Adani’s Rajasthan Part I Power Transmission to design and execute a 6,000 MW, ±800 kV bi-directional UHVDC link from Bhadla (Rajasthan) to Fatehpur (Uttar Pradesh), targeted for commissioning by 2029.
Companies Covered in Shunt Capacitor Market
- ABB Ltd.
- Siemens Energy AG
- Eaton Corporation
- Schneider Electric SE
- General Electric Company
- Hitachi Energy Ltd.
- TDK Electronics AG
- Vishay Intertechnology Inc.
- CIRCUTOR SA
- Electronicon Kondensatoren GmbH
- Nissin Electric Co., Ltd.
- L&T Electrical & Automation
- Epcos (TDK Group)
- Frako Kondensatoren
- ICAR SpA
Frequently Asked Questions
The global shunt capacitor market is projected to reach US$ 1.3 billion in 2026.
The market is driven by the urgent need to improve power quality and energy efficiency in increasingly complex, renewable-integrated electrical grids.
The market is poised to witness a CAGR of 6% from 2026 to 2033.
Key opportunities in the market center on smart grid–enabled solutions, renewable energy integration, and power quality upgrades in emerging and industrializing regions.
ABB Ltd., Siemens Energy AG, Eaton Corporation, Schneider Electric SE and Hitachi Energy are some of the key players in the market.


