


1. Executive Summary
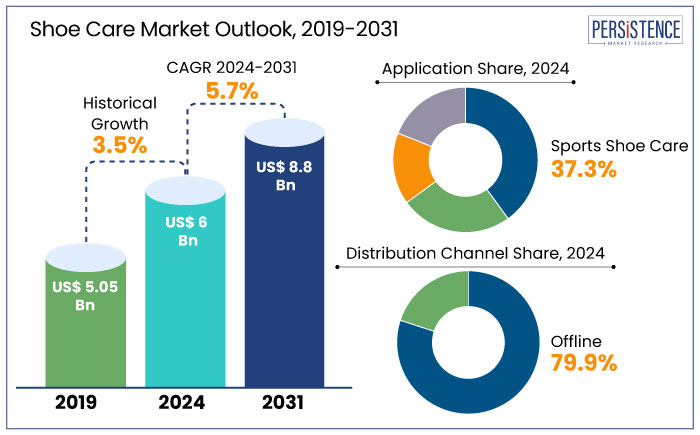
1.1. Global Shoe Care Market Snapshot, 2023 and 2031
1.2. Market Opportunity Assessment, 2023 - 2031, US$ Bn
1.3. Key Market Trends
1.4. Future Market Projections
1.5. Premium Market Insights
1.6. Industry Developments and Key Market Events
1.7. PMR Analysis and Recommendations
2. Market Overview
2.1. Market Scope and Definition
2.2. Market Dynamics
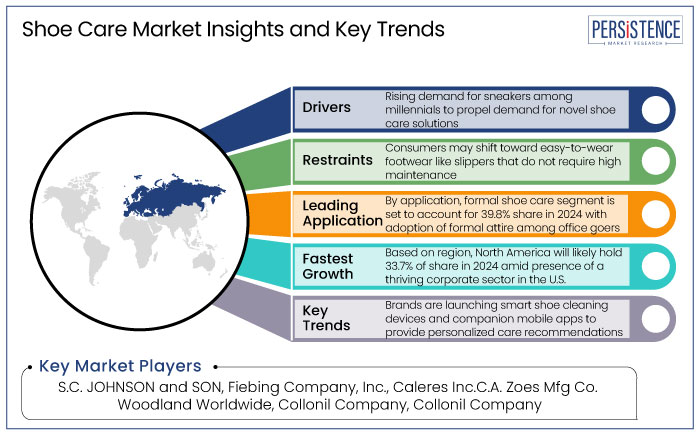
2.2.1. Drivers
2.2.2. Restraints
2.2.3. Opportunity
2.2.4. Challenges
2.2.5. Key Trends
2.3. Shoe Care Market: Value Chain
2.3.1. List of Raw Material Supplier
2.3.2. List of Manufacturers
2.3.3. List of Distributors
2.3.4. List of Applications
2.3.5. Profitability Analysis
2.4. Porter Five Force’s Analysis
2.5. Geopolitical Tensions: Market Impact
2.6. Macro-Economic Factors
2.6.1. Global Sectorial Outlook
2.6.2. Global GDP Growth Outlook
2.6.3. Global Parent Market Overview
2.7. Forecast Factors - Relevance and Impact
2.8. Regulatory and Technology Landscape
3. Global Shoe Care Market Outlook: Historical (2019 - 2023) and Forecast (2023 - 2031)
3.1. Key Highlights
3.1.1. Market Volume (Units) Projections
3.1.2. Market Size and Y-o-Y Growth
3.1.3. Absolute $ Opportunity
3.2. Market Size (US$ Bn) Analysis and Forecast
3.2.1. Historical Market Size Analysis, 2019-2023
3.2.2. Current Market Size Forecast, 2019-2031
3.3. Global Shoe Care Market Outlook: Application
3.3.1. Introduction / Key Findings
3.3.2. Historical Market Size (US$ Bn) Analysis By Application, 2019 - 2023
3.3.3. Current Market Size (US$ Bn) Forecast By Application, 2023 - 2031
3.3.3.1. Formal Shoe Care
3.3.3.2. Casual Shoe Care
3.3.3.3. Sports Shoe Care
3.3.3.4. Others
3.4. Market Attractiveness Analysis: Application
3.5. Global Shoe Care Market Outlook: Distribution Channel
3.5.1. Introduction / Key Findings
3.5.2. Historical Market Size (US$ Bn) Analysis By Distribution Channel, 2019 - 2023
3.5.3. Current Market Size (US$ Bn) Forecast By Distribution Channel, 2023 - 2031
3.5.3.1. Offline
3.5.3.2. Online
3.6. Market Attractiveness Analysis: Distribution Channel
4. Global Shoe Care Market Outlook: Region
4.1. Key Highlights
4.2. Historical Market Size (US$ Bn) Analysis By Region, 2019 - 2023
4.3. Current Market Size (US$ Bn) Forecast By Region, 2023 - 2031
4.3.1. North America
4.3.2. Europe
4.3.3. East Asia
4.3.4. South Asia and Oceania
4.3.5. Latin America
4.3.6. Middle East & Africa (MEA)
4.4. Market Attractiveness Analysis: Region
5. North America Shoe Care Market Outlook: Historical (2019 - 2023) and Forecast (2023 - 2031)
5.1. Key Highlights
5.2. Pricing Analysis
5.3. Historical Market Size (US$ Bn) Analysis By Market, 2019 - 2023
5.3.1. By Country
5.3.2. By Application
5.3.3. By Distribution Channel
5.4. Current Market Size (US$ Bn) Forecast By Country, 2023 - 2031
5.4.1. U.S.
5.4.2. Canada
5.5. Current Market Size (US$ Bn) Forecast By Application, 2023 - 2031
5.5.1. Formal Shoe Care
5.5.2. Casual Shoe Care
5.5.3. Sports Shoe Care
5.5.4. Others
5.6. Current Market Size (US$ Bn) Forecast By Distribution Channel, 2023 - 2031
5.6.1. Offline
5.6.2. Online
5.7. Market Attractiveness Analysis
6. Europe Shoe Care Market Outlook: Historical (2019 - 2023) and Forecast (2023 - 2031)
6.1. Key Highlights
6.2. Pricing Analysis
6.3. Historical Market Size (US$ Bn) Analysis By Market, 2019 - 2023
6.3.1. By Country
6.3.2. By Application
6.3.3. By Distribution Channel
6.4. Current Market Size (US$ Bn) Forecast By Country, 2023 - 2031
6.4.1. Germany
6.4.2. France
6.4.3. U.K.
6.4.4. Italy
6.4.5. Spain
6.4.6. Russia
6.4.7. Türkiye
6.4.8. Rest of Europe
6.5. Current Market Size (US$ Bn) Forecast By Application, 2023 - 2031
6.5.1. Formal Shoe Care
6.5.2. Casual Shoe Care
6.5.3. Sports Shoe Care
6.5.4. Others
6.6. Current Market Size (US$ Bn) Forecast By Distribution Channel, 2023 - 2031
6.6.1. Offline
6.6.2. Online
6.7. Market Attractiveness Analysis
7. East Asia Shoe Care Market Outlook: Historical (2019 - 2023) and Forecast (2023 - 2031)
7.1. Key Highlights
7.2. Pricing Analysis
7.3. Historical Market Size (US$ Bn) Analysis By Market, 2019 - 2023
7.3.1. By Country
7.3.2. By Application
7.3.3. By Distribution Channel
7.4. Current Market Size (US$ Bn) Forecast By Country, 2023 - 2031
7.4.1. China
7.4.2. Japan
7.4.3. South Korea
7.5. Current Market Size (US$ Bn) Forecast By Application, 2023 - 2031
7.5.1. Formal Shoe Care
7.5.2. Casual Shoe Care
7.5.3. Sports Shoe Care
7.5.4. Others
7.6. Current Market Size (US$ Bn) Forecast By Distribution Channel, 2023 - 2031
7.6.1. Offline
7.6.2. Online
7.7. Market Attractiveness Analysis
8. South Asia & Oceania Shoe Care Market Outlook: Historical (2019 - 2023) and Forecast (2023 - 2031)
8.1. Key Highlights
8.2. Pricing Analysis
8.3. Historical Market Size (US$ Bn) Analysis By Market, 2019 - 2023
8.3.1. By Country
8.3.2. By Application
8.3.3. By Distribution Channel
8.4. Current Market Size (US$ Bn) Forecast By Country, 2023 - 2031
8.4.1. India
8.4.2. Southeast Asia
8.4.3. ANZ
8.4.4. Rest of South Asia & Oceania
8.5. Current Market Size (US$ Bn) Forecast By Application, 2023 - 2031
8.5.1. Formal Shoe Care
8.5.2. Casual Shoe Care
8.5.3. Sports Shoe Care
8.5.4. Others
8.6. Current Market Size (US$ Bn) Forecast By Distribution Channel, 2023 - 2031
8.6.1. Offline
8.6.2. Online
8.7. Market Attractiveness Analysis
9. Latin America Shoe Care Market Outlook: Historical (2019 - 2023) and Forecast (2023 - 2031)
9.1. Key Highlights
9.2. Pricing Analysis
9.3. Historical Market Size (US$ Bn) Analysis By Market, 2019 - 2023
9.3.1. By Country
9.3.2. By Application
9.3.3. By Distribution Channel
9.4. Current Market Size (US$ Bn) Forecast By Country, 2023 - 2031
9.4.1. Brazil
9.4.2. Mexico
9.4.3. Rest of Latin America
9.5. Current Market Size (US$ Bn) Forecast By Application, 2023 - 2031
9.5.1. Formal Shoe Care
9.5.2. Casual Shoe Care
9.5.3. Sports Shoe Care
9.5.4. Others
9.6. Current Market Size (US$ Bn) Forecast By Distribution Channel, 2023 - 2031
9.6.1. Offline
9.6.2. Online
9.7. Market Attractiveness Analysis
10. Middle East & Africa Shoe Care Market Outlook: Historical (2019 - 2023) and Forecast (2023 - 2031)
10.1. Key Highlights
10.2. Pricing Analysis
10.3. Historical Market Size (US$ Bn) Analysis By Market, 2019 - 2023
10.3.1. By Country
10.3.2. By Application
10.3.3. By Distribution Channel
10.4. Current Market Size (US$ Bn) Forecast By Country, 2023 - 2031
10.4.1. GCC
10.4.2. Egypt
10.4.3. South Africa
10.4.4. Northern Africa
10.4.5. Rest of Middle East & Africa
10.5. Current Market Size (US$ Bn) Forecast By Application, 2023 - 2031
10.5.1. Formal Shoe Care
10.5.2. Casual Shoe Care
10.5.3. Sports Shoe Care
10.5.4. Others
10.6. Current Market Size (US$ Bn) Forecast By Distribution Channel, 2023 - 2031
10.6.1. Offline
10.6.2. Online
10.7. Market Attractiveness Analysis
11. Competition Landscape
11.1. Market Share Analysis, 2023
11.2. Market Structure
11.2.1. Competition Intensity Mapping By Market
11.2.2. Competition Dashboard
11.2.3. Apparent Product Capacity
11.3. Company Profiles (Details - Overview, Financials, Strategy, Recent Developments)
11.3.1. S.C. JOHNSON & SON
11.3.1.1. Overview
11.3.1.2. Segments and Product
11.3.1.3. Key Financials
11.3.1.4. Market Developments
11.3.1.5. Market Strategy
11.3.2. Fiebing Company, Inc.
11.3.3. Caleres Inc.
11.3.4. C.A. Zoes Mfg Co.
11.3.5. Woodland Worldwide
11.3.6. Collonil Company
11.3.7. RSPL Limited
11.3.8. Shinola
11.3.9. Charles Clinkard
11.3.10. New Balance Athletics, Inc.
11.3.11. C&J Clark International Limited
11.3.12. Salamander France SAS
11.3.13. Lincoln Shoe Polish c/o Maxton & Company
11.3.14. Griffin Shoe Care
11.3.15. TARRAGO BRANDS INTERNATIONIAL, S.L.
11.3.16. OTTER WAX LLC
12. Appendix
12.1. Research Methodology
12.2. Research Assumptions
12.3. Acronyms and Abbreviations

Loading page data
Please wait a moment


