

- Executive Summary
- Global Roll to Roll Printing Market Snapshot 2026 and 2033
- Market Opportunity Assessment, 2026-2033, US$ Bn
- Key Market Trends
- Industry Developments and Key Market Events
- Demand Side and Supply Side Analysis
- PMR Analysis and Recommendations
- Market Overview
- Market Scope and Definitions
- Value Chain Analysis
- Macro-Economic Factors
- Global GDP Outlook
- Global Consumer Electronics Industry Overview
- Global Automotive & Transportation Industry Overview
- Global Healthcare Industry Overview
- Forecast Factors - Relevance and Impact
- COVID-19 Impact Assessment
- PESTLE Analysis
- Porter's Five Forces Analysis
- Geopolitical Tensions: Market Impact
- Regulatory and Technology Landscape
- Market Dynamics
- Drivers
- Restraints
- Opportunities
- Trends
- Price Trend Analysis, 2020 - 2033
- Region-wise Price Analysis
- Price by Segments
- Price Impact Factors
- Global Roll to Roll Printing Market Outlook: Historical (2020 - 2025) and Forecast (2026 - 2033)
- Key Highlights
- Global Roll to Roll Printing Market Outlook: Component
- Introduction/Key Findings
- Historical Market Size (US$ Bn) and Volume (Units) Analysis by Component, 2020-2025
- Current Market Size (US$ Bn) and Volume (Units) Forecast, by Component, 2026-2033
- Roll to Roll Printers
- Inkjet Printers
- Screen Printers
- Flexographic Printers
- Offset Printers
- Others
- Services
- Printing Services
- Designing Services
- Consultation
- Support & Maintenance
- Roll to Roll Printers
- Market Attractiveness Analysis: Component
- Global Roll to Roll Printing Market Outlook: Application
- Introduction/Key Findings
- Historical Market Size (US$ Bn) and Volume (Units) Analysis by Application, 2020-2025
- Current Market Size (US$ Bn) and Volume (Units) Forecast, by Application, 2026-2033
- Displays
- LCD Displays
- OLED Displays
- e-Paper Displays
- Others
- Membrane Switch Assemblies
- Flexible Circuits
- RFID Antennas
- Other Electronic Products
- Displays
- Market Attractiveness Analysis: Application
- Global Roll to Roll Printing Market Outlook: Material
- Introduction/Key Findings
- Historical Market Size (US$ Bn) and Volume (Units) Analysis by Material, 2020-2025
- Current Market Size (US$ Bn) and Volume (Units) Forecast, by Material, 2026-2033
- Inks
- Substrates
- Market Attractiveness Analysis: Material
- Global Roll to Roll Printing Market Outlook: End-Use Industry
- Introduction/Key Findings
- Historical Market Size (US$ Bn) and Volume (Units) Analysis by End-Use Industry, 2020-2025
- Current Market Size (US$ Bn) and Volume (Units) Forecast, by End-Use Industry, 2026-2033
- Consumer Electronics
- Automotive & Transportation
- Healthcare
- Aerospace & Defence
- Retail & Packaging
- Others
- Market Attractiveness Analysis: End-Use Industry
- Global Roll to Roll Printing Market Outlook: Region
- Key Highlights
- Historical Market Size (US$ Bn) and Volume (Units) Analysis by Region, 2020-2025
- Current Market Size (US$ Bn) and Volume (Units) Forecast, by Region, 2026-2033
- North America
- Europe
- East Asia
- South Asia & Oceania
- Latin America
- Middle East & Africa
- Market Attractiveness Analysis: Region
- North America Roll to Roll Printing Market Outlook: Historical (2020 - 2025) and Forecast (2026 - 2033)
- Key Highlights
- Pricing Analysis
- North America Market Size (US$ Bn) and Volume (Units) Forecast, by Country, 2026-2033
- U.S.
- Canada
- North America Market Size (US$ Bn) and Volume (Units) Forecast, by Component, 2026-2033
- Roll to Roll Printers
- Inkjet Printers
- Screen Printers
- Flexographic Printers
- Offset Printers
- Others
- Services
- Printing Services
- Designing Services
- Consultation
- Support & Maintenance
- Roll to Roll Printers
- North America Market Size (US$ Bn) and Volume (Units) Forecast, by Application, 2026-2033
- Displays
- LCD Displays
- OLED Displays
- e-Paper Displays
- Others
- Membrane Switch Assemblies
- Flexible Circuits
- RFID Antennas
- Other Electronic Products
- Displays
- North America Market Size (US$ Bn) and Volume (Units) Forecast, by Material, 2026-2033
- Inks
- Substrates
- North America Market Size (US$ Bn) and Volume (Units) Forecast, by End-Use Industry, 2026-2033
- Consumer Electronics
- Automotive & Transportation
- Healthcare
- Aerospace & Defence
- Retail & Packaging
- Others
- Europe Roll to Roll Printing Market Outlook: Historical (2020 - 2025) and Forecast (2026 - 2033)
- Key Highlights
- Pricing Analysis
- Europe Market Size (US$ Bn) and Volume (Units) Forecast, by Country, 2026-2033
- Germany
- Italy
- France
- U.K.
- Spain
- Russia
- Rest of Europe
- Europe Market Size (US$ Bn) and Volume (Units) Forecast, by Component, 2026-2033
- Roll to Roll Printers
- Inkjet Printers
- Screen Printers
- Flexographic Printers
- Offset Printers
- Others
- Services
- Printing Services
- Designing Services
- Consultation
- Support & Maintenance
- Roll to Roll Printers
- Europe Market Size (US$ Bn) and Volume (Units) Forecast, by Application, 2026-2033
- Displays
- LCD Displays
- OLED Displays
- e-Paper Displays
- Others
- Membrane Switch Assemblies
- Flexible Circuits
- RFID Antennas
- Other Electronic Products
- Displays
- Europe Market Size (US$ Bn) and Volume (Units) Forecast, by Material, 2026-2033
- Inks
- Substrates
- Europe Market Size (US$ Bn) and Volume (Units) Forecast, by End-Use Industry, 2026-2033
- Consumer Electronics
- Automotive & Transportation
- Healthcare
- Aerospace & Defence
- Retail & Packaging
- Others
- East Asia Roll to Roll Printing Market Outlook: Historical (2020 - 2025) and Forecast (2026 - 2033)
- Key Highlights
- Pricing Analysis
- East Asia Market Size (US$ Bn) and Volume (Units) Forecast, by Country, 2026-2033
- China
- Japan
- South Korea
- East Asia Market Size (US$ Bn) and Volume (Units) Forecast, by Component, 2026-2033
- Roll to Roll Printers
- Inkjet Printers
- Screen Printers
- Flexographic Printers
- Offset Printers
- Others
- Services
- Printing Services
- Designing Services
- Consultation
- Support & Maintenance
- Roll to Roll Printers
- East Asia Market Size (US$ Bn) and Volume (Units) Forecast, by Application, 2026-2033
- Displays
- LCD Displays
- OLED Displays
- e-Paper Displays
- Others
- Membrane Switch Assemblies
- Flexible Circuits
- RFID Antennas
- Other Electronic Products
- Displays
- East Asia Market Size (US$ Bn) and Volume (Units) Forecast, by Material, 2026-2033
- Inks
- Substrates
- East Asia Market Size (US$ Bn) and Volume (Units) Forecast, by End-Use Industry, 2026-2033
- Consumer Electronics
- Automotive & Transportation
- Healthcare
- Aerospace & Defence
- Retail & Packaging
- Others
- South Asia & Oceania Roll to Roll Printing Market Outlook: Historical (2020 - 2025) and Forecast (2026 - 2033)
- Key Highlights
- Pricing Analysis
- South Asia & Oceania Market Size (US$ Bn) and Volume (Units) Forecast, by Country, 2026-2033
- India
- Southeast Asia
- ANZ
- Rest of SAO
- South Asia & Oceania Market Size (US$ Bn) and Volume (Units) Forecast, by Component, 2026-2033
- Roll to Roll Printers
- Inkjet Printers
- Screen Printers
- Flexographic Printers
- Offset Printers
- Others
- Services
- Printing Services
- Designing Services
- Consultation
- Support & Maintenance
- Roll to Roll Printers
- South Asia & Oceania Market Size (US$ Bn) and Volume (Units) Forecast, by Application, 2026-2033
- Displays
- LCD Displays
- OLED Displays
- e-Paper Displays
- Others
- Membrane Switch Assemblies
- Flexible Circuits
- RFID Antennas
- Other Electronic Products
- Displays
- South Asia & Oceania Market Size (US$ Bn) and Volume (Units) Forecast, by Material, 2026-2033
- Inks
- Substrates
- South Asia & Oceania Market Size (US$ Bn) and Volume (Units) Forecast, by End-Use Industry, 2026-2033
- Consumer Electronics
- Automotive & Transportation
- Healthcare
- Aerospace & Defence
- Retail & Packaging
- Others
- Latin America Roll to Roll Printing Market Outlook: Historical (2020 - 2025) and Forecast (2026 - 2033)
- Key Highlights
- Pricing Analysis
- Latin America Market Size (US$ Bn) and Volume (Units) Forecast, by Country, 2026-2033
- Brazil
- Mexico
- Rest of LATAM
- Latin America Market Size (US$ Bn) and Volume (Units) Forecast, by Component, 2026-2033
- Roll to Roll Printers
- Inkjet Printers
- Screen Printers
- Flexographic Printers
- Offset Printers
- Others
- Services
- Printing Services
- Designing Services
- Consultation
- Support & Maintenance
- Roll to Roll Printers
- Latin America Market Size (US$ Bn) and Volume (Units) Forecast, by Application, 2026-2033
- Displays
- LCD Displays
- OLED Displays
- e-Paper Displays
- Others
- Membrane Switch Assemblies
- Flexible Circuits
- RFID Antennas
- Other Electronic Products
- Displays
- Latin America Market Size (US$ Bn) and Volume (Units) Forecast, by Material, 2026-2033
- Inks
- Substrates
- Latin America Market Size (US$ Bn) and Volume (Units) Forecast, by End-Use Industry, 2026-2033
- Consumer Electronics
- Automotive & Transportation
- Healthcare
- Aerospace & Defence
- Retail & Packaging
- Others
- Middle East & Africa Roll to Roll Printing Market Outlook: Historical (2020 - 2025) and Forecast (2026 - 2033)
- Key Highlights
- Pricing Analysis
- Middle East & Africa Market Size (US$ Bn) and Volume (Units) Forecast, by Country, 2026-2033
- GCC Countries
- South Africa
- Northern Africa
- Rest of MEA
- Middle East & Africa Market Size (US$ Bn) and Volume (Units) Forecast, by Component, 2026-2033
- Roll to Roll Printers
- Inkjet Printers
- Screen Printers
- Flexographic Printers
- Offset Printers
- Others
- Services
- Printing Services
- Designing Services
- Consultation
- Support & Maintenance
- Roll to Roll Printers
- Middle East & Africa Market Size (US$ Bn) and Volume (Units) Forecast, by Application, 2026-2033
- Displays
- LCD Displays
- OLED Displays
- e-Paper Displays
- Others
- Membrane Switch Assemblies
- Flexible Circuits
- RFID Antennas
- Other Electronic Products
- Displays
- Middle East & Africa Market Size (US$ Bn) and Volume (Units) Forecast, by Material, 2026-2033
- Inks
- Substrates
- Middle East & Africa Market Size (US$ Bn) and Volume (Units) Forecast, by End-Use Industry, 2026-2033
- Consumer Electronics
- Automotive & Transportation
- Healthcare
- Aerospace & Defence
- Retail & Packaging
- Others
- Competition Landscape
- Market Share Analysis, 2025
- Market Structure
- Competition Intensity Mapping
- Competition Dashboard
- Company Profiles
- BOBST
- Company Overview
- Product Portfolio/Offerings
- Key Financials
- SWOT Analysis
- Company Strategy and Key Developments
- Windmöller & Hölscher
- Hirano Tecseed
- Wuxi Lead
- PNT
- PCMC
- Mark Andy
- Kobe Steel
- Yinghe Technology
- Putailai
- Nordmeccanica
- CIS
- Beiren
- Applied Materials
- Manz
- BOBST
- Appendix
- Research Methodology
- Research Assumptions
- Acronyms and Abbreviations


- Display Technologies
- Roll-to-roll Printing Market
Roll-to-roll Printing Market Size, Share, and Growth Forecast 2026 - 2033
Roll-to-roll Printing Market by Component (Roll-to-roll Printers, Services), Application (Displays, Membrane Switch Assemblies, Flexible Circuits, RFID Antennas, Other Electronic Products), by Material (Inks, Substrates), Industry (Consumer Electronics, Automotive & Transportation, Healthcare, Aerospace & Defence, Retail & Packaging, Others), and Regional Analysis, 2026 - 2033
Roll-to-roll Printing Market Size and Trend Analysis
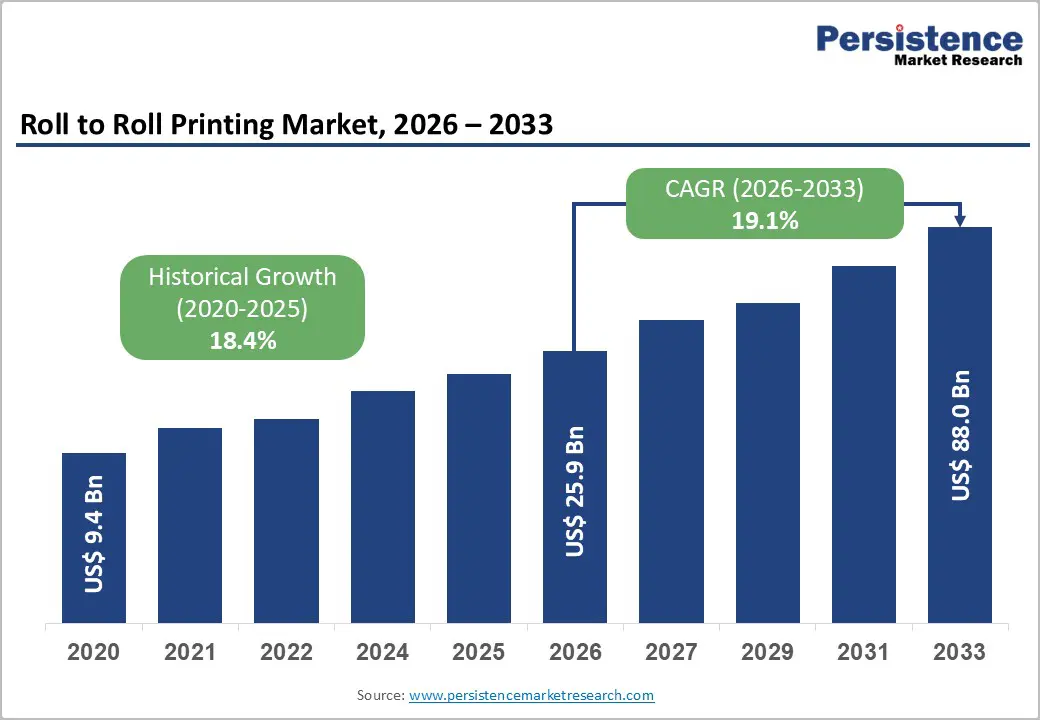
The global roll-to-roll printing market is projected to reach US$ 25.9 billion in 2026 and US$ 88.0 billion by 2033, growing at a CAGR of 19.1% from 2026 to 2033.
The market is experiencing robust expansion driven by rising demand for flexible electronics in wearables, foldable smartphones, and IoT devices, as manufacturers seek high-throughput, cost-efficient production platforms. Sustainable manufacturing trends and regulatory pressure are pushing producers towards roll-to-roll methods that reduce material waste and energy consumption. At the same time, advances in conductive inks and flexible substrates enable precise, high-volume fabrication of complex electronic components.
Key Industry Highlights:
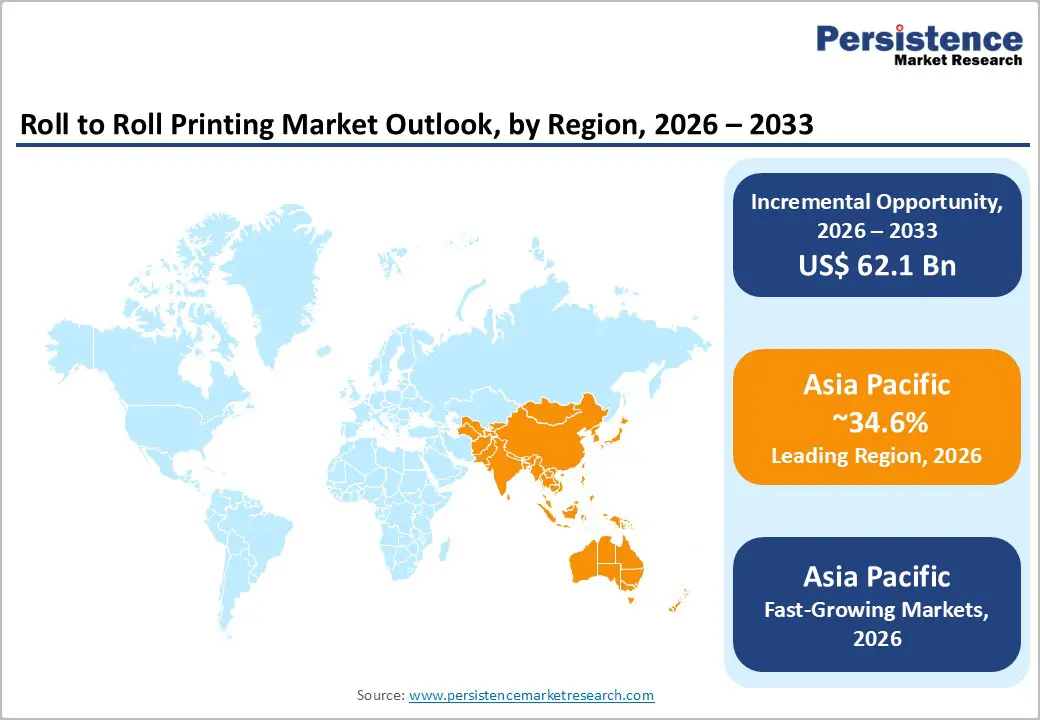
- Leading Region: Asia Pacific dominates global roll-to-roll printing with a 34.6% share, driven by China’s LCD/OLED capacity, South Korea’s premium display leadership, and Japan’s advanced materials ecosystem.
- Fastest-Growing Region: Asia Pacific is also the fastest-growing region, supported by large-scale electronics investments and manufacturing expansion in displays, batteries, and flexible circuits.
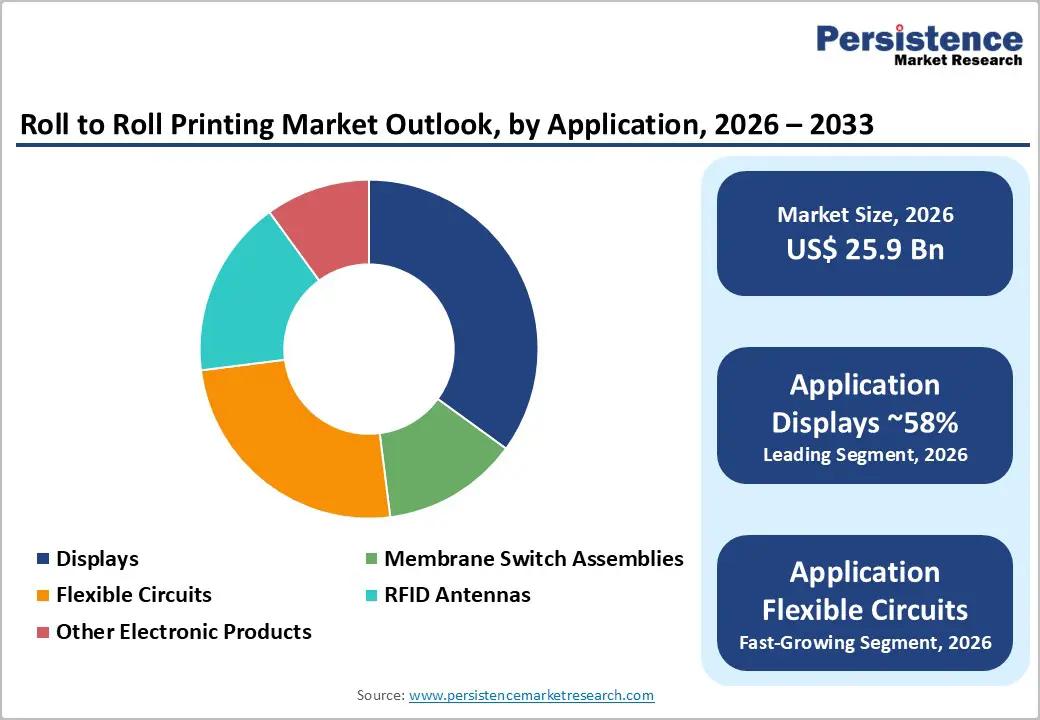
- Leading Category: Displays remain the largest application segment with a 58% share, led by strong demand for OLED smartphones, foldables, and e-paper shelf labels.
- Fastest-Growing Category: Inkjet-based roll-to-roll systems are the fastest-growing technology, supported by digital, maskless processing and high-resolution patterning.
- Key Market Opportunity: Healthcare wearables and biosensors are a rising opportunity, as diagnostic and remote-monitoring devices expand rapidly and require flexible printed circuits ideal for roll-to-roll processes.
| Key Insights | Details |
|---|---|
| Roll-to-Roll Printing Market Size (2026E) | US$ 25.9 Billion |
| Market Value Forecast (2033F) | US$ 88.0 Billion |
| Projected Growth CAGR (2026 - 2033) | 19.1% |
| Historical Market Growth (2020 - 2025) | 18.4% |
Market Dynamics
Drivers - Rapid Expansion of Flexible & Wearable Electronics Driving R2R Adoption
Accelerating demand for flexible and wearable electronics is a major growth catalyst for roll-to-roll printing. Foldable OLED shipments surpassed 23 million units in 2024, and volumes are set to rise as leading OEMs push thinner, more durable displays. Samsung Display’s expected supply of nearly 11 million panels for a foldable iPhone in 2026 reflects this scaling momentum.
The wearable healthcare devices market is also expanding, growing from roughly US$ 45.29 billion in 2025 to nearly US$ 76 billion by 2030. Roll-to-roll printing enables the manufacture of lightweight, conformable sensors, interconnects, and components essential for continuous monitoring and medical wearables. Its high-speed, low-cost production capabilities make advanced wearable systems more commercially feasible.
Strengthening Global Regulations and Sustainability Mandates Favouring R2R Processes
Environmental regulations and sustainability mandates are increasingly positioning roll-to-roll printing as a preferred manufacturing route. EU frameworks such as RoHS, REACH, the Digital Product Passport, and extended producer responsibility rules are pushing OEMs to improve recyclability, material traceability, and chemical safety across electronic products. These pressures are accelerating the adoption of cleaner, lower-waste production technologies.
Roll-to-roll systems can significantly reduce material scrap, often by 30-40% compared to subtractive methods, making them attractive for sustainable electronics. Parallel advances in eco-friendly conductive inks, including bio-based binders and low-toxicity metal or carbon systems, further support ESG commitments. Collectively, these developments strengthen the market shift toward scalable, efficient roll-to-roll manufacturing.
Restraints - High Capital Requirements and Extended Lead Times Limiting Market Entry
Roll-to-roll printing systems demand advanced web-handling, registration, drying, and curing capabilities, resulting in very high upfront capital costs. Premium production lines from leading manufacturers such as BOBST, Windmöller & Hölscher, and PCMC often require multimillion-dollar investments, depending on width, speed, and automation levels. Lead times for complex equipment can exceed 24 months, reflecting strong global demand and bottlenecks in precision machinery.
These long installation cycles and heavy financial commitments pose barriers for small and mid-sized converters, especially in emerging economies. The need for skilled operators to manage multilayer registration, tension control, and process tuning further raises operational costs. Collectively, these factors slow adoption for manufacturers lacking technical expertise or capital reserves.
Challenging Multilayer Alignment and Yield Management in High-Speed Production
Producing multilayer circuits, displays, and sensor structures at high web speeds introduces extreme process-control complexity. Roll-to-roll systems handling conductive, dielectric, and functional layers on substrates such as PET or PEN must maintain micrometer-level alignment to meet the tolerances required for OLED pixels, fine-line circuitry, or advanced RFID antennas. Even minor variations in temperature, humidity, ink behavior, or substrate shrinkage can disrupt accuracy.
Such deviations lead to defects, including open circuits, shorts, or luminance inconsistencies, reducing yield and increasing overall production cost. Many printed-electronics applications still operate below desired industrial yield benchmarks, requiring further investment in inline inspection, metrology tools, and automation. Enhanced process stability is critical to achieving consistent performance and economically viable mass production.
Opportunity - Rising Demand for Printed Sensors and RFID in Digitized Supply Chains
The rapid integration of IoT, smart logistics, and global traceability mandates is accelerating the adoption of printed sensors and RFID technologies. Growing RFID usage, especially printed and chipless variants, supports high-volume, low-cost tagging across food, beverage, pharmaceutical, and industrial supply chains. IoT-enabled packaging is expanding as brands comply with safety, authentication, and condition-monitoring requirements across regulated sectors.
Healthcare deployments further demonstrate the value proposition, with hospitals achieving 20-30% reductions in inventory costs and major declines in medication-related errors through RFID-based asset tracking. Roll-to-roll printing enables the manufacture of antennas, sensor elements, and simple circuits in massive volumes on low-cost substrates, positioning the technology for widespread adoption in smart labels, temperature indicators, and tamper-evident seals.
Expansion of Printed Display Technologies, Including E-Paper and Flexible LCD/OLED
Printed displays such as e-paper and flexible LCD/OLED represent a major growth avenue for roll-to-roll manufacturing. The e-paper market is projected to rise into the mid-US$20-billion range by the early 2030s, driven by large-scale adoption of electronic shelf labels and retail signage across Europe and Asia. Retailers are deploying millions of digital tags per chain, favoring ultra-thin, robust, low-power displays produced via printed-electronics processes.
Flexible and foldable OLED momentum is also accelerating, with shipments expected to exceed 120 million units by 2032. Chinese panel makers, including BOE, TCL, CSOT, and Visionox, are investing over RMB 170 billion in new OLED capacities compatible with inkjet and roll-to-roll deposition schemes. These infrastructure expansions and material innovations broaden opportunities for roll-to-roll printing across display backplanes, color filters, and functional layers.
Category-wise Analysis
Component Insights
Roll-to-roll printers account for the largest share of the component landscape at approximately 62%, driven by sustained investments from display makers, flexible circuit producers, and packaging converters. Screen printing systems continue to hold a strong position for depositing thicker functional layers, while service offerings including design support, maintenance, and process consulting add recurring value for equipment providers and specialized bureaus.
Inkjet printing is the fastest-growing component category, supported by growth rates above 20% due to its digital, maskless operation and high-resolution patterning capability. Its strengths in rapid prototyping, variable data printing, and fine-line electronics make it increasingly preferred for short- to mid-volume runs. Demand is accelerating as OEMs adopt flexible production flows and advanced printed-electronics architectures.
Application Insights
Displays, including LCD, OLED, and e-paper, represent the leading application segment with about 58% of roll-to-roll printing demand. Growth in foldable smartphones, tablets, and rollable form factors drives demand for flexible OLED layers, while electronic shelf labels are expanding rapidly across retail and logistics. RFID antennas and membrane switches add further volume across automotive, industrial, and consumer electronics applications.
Flexible electronics for automotive HMIs and industrial systems represent the fastest-growing application cluster, supported by rising adoption of printed circuits, touch interfaces, and conformable sensor arrays. Advancements in roll-to-roll processes for high-frequency antennas, lightweight circuitry, and rugged interfaces continue to broaden use cases across mobility, automation, and connected environments.
Material Insights
Materials led by conductive inks account for the largest share of value, with conductive formulations representing over 51.2% of total material revenues in many printed-electronics applications. Silver inks dominate high-performance circuits, while PET and PEN films remain the leading substrates due to mechanical stability, printability, and compatibility with established curing systems. Substrate performance strongly influences device yield and long-term reliability.
The fastest-growing material segment is advanced conductive-ink alternatives including copper, carbon, hybrid, and nanomaterial systems developed to reduce costs and improve durability. Alongside this, next-generation substrates such as flexible glass, polyimide, and barrier-coated films are gaining traction for OLED and sensor stacks requiring high thermal resistance, low permeability, and excellent dimensional stability.
Industry Insights
Consumer electronics lead the market with an estimated 48% share, driven by smartphones, tablets, wearables, and emerging AR/VR devices that use flexible displays, interconnects, and lightweight printed components. Automotive & transportation follows as a major adopter, integrating printed sensors and flex circuits in driver-assistance systems, cockpit interfaces, and energy-management modules. Healthcare, aerospace, and retail contribute niche but high-value demand.
Healthcare is the fastest-growing end-use sector, driven by rising adoption of diagnostic wearables, remote patient-monitoring patches, and disposable biosensors. These applications benefit from roll-to-roll-printed electrodes, thin-film circuits, and conformable sensor layers enabling comfortable, continuous physiological monitoring. Growth is further supported by expanding telehealth ecosystems and demand for low-cost, scalable medical electronics.
Regional Insights
North America Roll-to-roll Printing Market Trends
North America holds a 32.5% share of the global roll-to-roll printing market, led by the U.S., where strong electronics manufacturing, aerospace, defence, and medical device sectors drive adoption. Federal initiatives, especially the CHIPS Act-driven semiconductor and electronics investments, support the onshoring of advanced component production and expand demand for high-throughput roll-to-roll processes.
The region also benefits from a mature ecosystem of material suppliers, fabless designers, and equipment manufacturers such as Applied Materials and Mark Andy. Environmental regulations promoting energy-efficient and low-waste manufacturing align with the sustainability advantages of roll-to-roll printing. Collaborations among universities, national labs, and industry consortia further enhance innovation and accelerate the commercialization of flexible and printed electronics technologies.
Europe Roll-to-roll Printing Market Trends
Europe shows strong growth, with the roll-to-roll printing market expected to expand at a 23.5% CAGR, supported by leadership in automotive, industrial electronics, and advanced printing technologies. Germany, the U.K., and France remain central to regional demand, with companies such as BOBST and Windmöller & Hölscher enabling high-precision printing and converting for electronics and packaging applications.
Europe’s regulatory focus on green electronics, circularity, and reduced manufacturing waste reinforces the shift toward printed and flexible electronics. Organizations like OE-A drive standardization and technology roadmap development, while automotive OEMs, including BMW and Mercedes-Benz, integrate flexible HMIs, printed sensors, and lighting. Strong research infrastructure across the Netherlands, Finland, and Switzerland further enhances Europe’s innovation capacity.
Asia Pacific Roll-to-roll Printing Market Trends
Asia Pacific dominates global production, accounting for 34.6% market share, fueled by China, South Korea, and Japan’s leadership in displays, consumer electronics, and semiconductor-related manufacturing. China’s aggressive investment in OLED and flexible display capacity by BOE, TCL, CSOT, and Visionox reinforces its central role in roll-to-roll compatible coating and patterning technologies.
South Korea continues to lead premium OLED innovation for smartphones, IT devices, and foldables through Samsung Display and LG Display. Japan contributes advanced substrates, films, and materials essential for high-performance flexible electronics. Meanwhile, India and ASEAN countries are emerging hubs supported by electronics manufacturing incentives. This combination of scale, supply-chain depth, and policy support positions Asia Pacific as the key driver of global roll-to-roll printing demand.
Competitive Landscape
The global roll-to-roll printing market is moderately consolidated, with 15-20 major equipment manufacturers dominating revenue and a wide base of regional and niche players contributing specialized capabilities. Competition centers on achieving higher web speeds, tighter registration accuracy, integrated multi-process platforms, and advanced automation aligned with Industry 4.0 expectations.
Manufacturers increasingly differentiate through predictive maintenance, process analytics, and flexible system architectures tailored to electronics, energy, and packaging applications. New entrants particularly from Asia, are expanding globally with competitively priced, application-specific solutions. Collaboration through technology partnerships, material co-development, and joint R&D programs remains a key strategy to accelerate innovation in printed and flexible electronics.
Key Market Developments:
- In March 2025, Samsung Display showcased stretchable and rollable OLED concepts at MWC 2025, signaling the maturation of ultra-flexible displays and highlighting future high-volume opportunities for compatible roll-to-roll processing technologies and materials.
- In June 2025, Kobe Steel announced an investment in expanding a plant producing high-performance materials used in automotive and industrial components, reinforcing upstream supply capability that can support growing demand from flexible and printed electronics manufacturing.
- In September 2025, DuPont announced the launch of a new generation of conductive and dielectric ink formulations tailored for high-speed roll-to-roll printed electronics. The portfolio focuses on improved adhesion, lower curing temperatures, and finer line resolution, enabling higher-density circuits for flexible displays, sensors, and wearables.
Companies Covered in Roll-to-roll Printing Market
- BOBST
- Windmöller & Hölscher
- Hirano Tecseed
- Wuxi Lead
- PNT
- PCMC
- Mark Andy
- Kobe Steel
- Yinghe Technology
- Putailai
- Nordmeccanica
- CIS
- Beiren
- Applied Materials
- Manz
Frequently Asked Questions
The Roll-to-roll Printing Market is projected to reach US$ 88.0 Billion by 2033, up from US$ 25.9 Billion in 2026, growing at a 19.1% CAGR.
Growth is driven by flexible/foldable OLED displays, wearable healthcare devices, RFID/smart packaging adoption, and sustainability regulations.
Inkjet-based roll-to-roll printing is the fastest-growing technology, while displays (OLED, e-paper) hold the largest application share at 58%.
Asia Pacific leads the market with 34.6% share, supported by China’s LCD/OLED capacity, South Korea’s OLED expertise, and emerging production in India/ASEAN.
Healthcare wearables and diagnostic devices are a key growth opportunity, requiring thin, flexible circuits and electrodes produced via roll-to-roll printing.
Prominent players include BOBST, Windmöller & Hölscher, Hirano Tecseed, Wuxi Lead, PCMC, Mark Andy, Nordmeccanica, Applied Materials, and Manz.


