

- Executive Summary
- Global Peanut Oil Market Snapshot, 2025 and 2032
- Market Opportunity Assessment, 2025 - 2032, US$ Bn
- Key Market Trends
- Future Market Projections
- Premium Market Insights
- Industry Developments and Key Market Events
- PMR Analysis and Recommendations
- Market Overview
- Market Scope and Definition
- Market Dynamics
- Drivers
- Restraints
- Opportunity
- Challenges
- Key Trends
- COVID-19 Impact Analysis
- Forecast Factors - Relevance and Impact
- Value Added Insights
- Value Chain Analysis
- Key Market Players
- Regulatory Landscape
- PESTLE Analysis
- Porter’s Five Force Analysis
- Consumer Behavior Analysis
- Trade Statistics
- Top Importing Countries
- Top Exporting Countries
- Price Trend Analysis, 2019 - 2032
- Key Factors Impacting Product Prices
- Pricing Analysis, By Product Type
- Regional Prices and Product Preferences
- Global Peanut Oil Market Outlook
- Key Highlights
- Market Volume (Tons) Projections
- Market Size (US$ Bn) and Y-o-Y Growth
- Absolute $ Opportunity
- Market Size (US$ Bn) Analysis and Forecast
- Historical Market Size (US$ Bn) Analysis, 2019-2023
- Current Market Size (US$ Bn) Analysis and Forecast, 2024-2032
- Global Peanut Oil Market Outlook: Product Type
- Historical Market Size (US$ Bn) and Volume (Tons) Analysis, By Product Type, 2019-2023
- Current Market Size (US$ Bn) and Volume (Tons) Analysis and Forecast, By Product Type, 2024-2032
- Refined Peanut Oil
- Unrefined Peanut Oil
- Cold-Pressed Peanut Oil
- Roasted Peanut Oil
- Market Attractiveness Analysis: Product Type
- Global Peanut Oil Market Outlook: Nature
- Historical Market Size (US$ Bn) and Volume (Tons) Analysis, By Nature, 2019-2023
- Current Market Size (US$ Bn) and Volume (Tons) Analysis and Forecast, By Nature, 2024-2032
- Organic
- Conventional
- Market Attractiveness Analysis: Nature
- Global Peanut Oil Market Outlook: End Use
- Historical Market Size (US$ Bn) and Volume (Tons) Analysis, By End Use, 2019-2023
- Current Market Size (US$ Bn) and Volume (Tons) Analysis and Forecast, By End Use, 2024-2032
- Food Industry
- Pharmaceuticals & Nutraceuticals
- Cosmetics & Personal Care
- Others
- Market Attractiveness Analysis: End Use
- Global Peanut Oil Market Outlook: Sales Channel
- Historical Market Size (US$ Bn) and Volume (Tons) Analysis, By Sales Channel, 2019-2023
- Current Market Size (US$ Bn) and Volume (Tons) Analysis and Forecast, By Sales Channel, 2024-2032
- B2B
- B2C
- Hypermarkets/Supermarkets
- Traditional Grocery Stores
- Convenience Stores
- Online Retail
- Others
- Market Attractiveness Analysis: Sales Channel
- Key Highlights
- Global Peanut Oil Market Outlook: Region
- Historical Market Size (US$ Bn) and Volume (Tons) Analysis, By Region, 2019-2023
- Current Market Size (US$ Bn) and Volume (Tons) Analysis and Forecast, By Region, 2024-2032
- North America
- Latin America
- Europe
- East Asia
- South Asia and Oceania
- Middle East & Africa
- Market Attractiveness Analysis: Region
- North America Peanut Oil Market Outlook
- Historical Market Size (US$ Bn) and Volume (Tons) Analysis, By Market, 2019-2023
- By Country
- By Product Type
- By Nature
- By End Use
- By Sales Channel
- Current Market Size (US$ Bn) and Volume (Tons) Analysis and Forecast, By Country, 2024-2032
- U.S.
- Canada
- Current Market Size (US$ Bn) and Volume (Tons) Analysis and Forecast, By Product Type, 2024-2032
- Refined Peanut Oil
- Unrefined Peanut Oil
- Cold-Pressed Peanut Oil
- Roasted Peanut Oil
- Current Market Size (US$ Bn) and Volume (Tons) Analysis and Forecast, By Nature, 2024-2032
- Organic
- Conventional
- Current Market Size (US$ Bn) and Volume (Tons) Analysis and Forecast, By End Use, 2024-2032
- Food Industry
- Pharmaceuticals & Nutraceuticals
- Cosmetics & Personal Care
- Others
- Current Market Size (US$ Bn) and Volume (Tons) Analysis and Forecast, By Sales Channel, 2024-2032
- B2B
- B2C
- Hypermarkets/Supermarkets
- Traditional Grocery Stores
- Convenience Stores
- Online Retail
- Others
- Market Attractiveness Analysis
- Historical Market Size (US$ Bn) and Volume (Tons) Analysis, By Market, 2019-2023
- Europe Peanut Oil Market Outlook
- Historical Market Size (US$ Bn) and Volume (Tons) Analysis, By Market, 2019-2023
- By Country
- By Product Type
- By Nature
- By End Use
- By Sales Channel
- Current Market Size (US$ Bn) and Volume (Tons) Analysis and Forecast, By Country, 2024-2032
- Germany
- France
- U.K.
- Italy
- Spain
- Russia
- Rest of Europe
- Current Market Size (US$ Bn) and Volume (Tons) Analysis and Forecast, By Product Type, 2024-2032
- Refined Peanut Oil
- Unrefined Peanut Oil
- Cold-Pressed Peanut Oil
- Roasted Peanut Oil
- Current Market Size (US$ Bn) and Volume (Tons) Analysis and Forecast, By Nature, 2024-2032
- Organic
- Conventional
- Current Market Size (US$ Bn) and Volume (Tons) Analysis and Forecast, By End Use, 2024-2032
- Food Industry
- Pharmaceuticals & Nutraceuticals
- Cosmetics & Personal Care
- Others
- Current Market Size (US$ Bn) and Volume (Tons) Analysis and Forecast, By Sales Channel, 2024-2032
- B2B
- B2C
- Hypermarkets/Supermarkets
- Traditional Grocery Stores
- Convenience Stores
- Online Retail
- Others
- Market Attractiveness Analysis
- Historical Market Size (US$ Bn) and Volume (Tons) Analysis, By Market, 2019-2023
- East Asia Peanut Oil Market Outlook:
- Historical Market Size (US$ Bn) and Volume (Tons) Analysis, By Market, 2019-2023
- By Country
- By Product Type
- By Nature
- By End Use
- By Sales Channel
- Current Market Size (US$ Bn) and Volume (Tons) Analysis and Forecast, By Country, 2024-2032
- China
- Japan
- South Korea
- Current Market Size (US$ Bn) and Volume (Tons) Analysis and Forecast, By Product Type, 2024-2032
- Refined Peanut Oil
- Unrefined Peanut Oil
- Cold-Pressed Peanut Oil
- Roasted Peanut Oil
- Current Market Size (US$ Bn) and Volume (Tons) Analysis and Forecast, By Nature, 2024-2032
- Organic
- Conventional
- Current Market Size (US$ Bn) and Volume (Tons) Analysis and Forecast, By End Use, 2024-2032
- Food Industry
- Pharmaceuticals & Nutraceuticals
- Cosmetics & Personal Care
- Others
- Current Market Size (US$ Bn) and Volume (Tons) Analysis and Forecast, By Sales Channel, 2024-2032
- B2B
- B2C
- Hypermarkets/Supermarkets
- Traditional Grocery Stores
- Convenience Stores
- Online Retail
- Others
- Market Attractiveness Analysis
- Historical Market Size (US$ Bn) and Volume (Tons) Analysis, By Market, 2019-2023
- South Asia & Oceania Peanut Oil Market Outlook:
- Historical Market Size (US$ Bn) and Volume (Tons) Analysis, By Market, 2019-2023
- By Country
- By Product Type
- By Nature
- By End Use
- By Sales Channel
- Current Market Size (US$ Bn) and Volume (Tons) Analysis and Forecast, By Country, 2024-2032
- India
- Indonesia
- Thailand
- Singapore
- ANZ
- Rest of South Asia & Oceania
- Current Market Size (US$ Bn) and Volume (Tons) Analysis and Forecast, By Product Type, 2024-2032
- Refined Peanut Oil
- Unrefined Peanut Oil
- Cold-Pressed Peanut Oil
- Roasted Peanut Oil
- Current Market Size (US$ Bn) and Volume (Tons) Analysis and Forecast, By Nature, 2024-2032
- Organic
- Conventional
- Current Market Size (US$ Bn) and Volume (Tons) Analysis and Forecast, By End Use, 2024-2032
- Food Industry
- Pharmaceuticals & Nutraceuticals
- Cosmetics & Personal Care
- Others
- Current Market Size (US$ Bn) and Volume (Tons) Analysis and Forecast, By Sales Channel, 2024-2032
- B2B
- B2C
- Hypermarkets/Supermarkets
- Traditional Grocery Stores
- Convenience Stores
- Online Retail
- Others
- Market Attractiveness Analysis
- Historical Market Size (US$ Bn) and Volume (Tons) Analysis, By Market, 2019-2023
- Latin America Peanut Oil Market Outlook:
- Historical Market Size (US$ Bn) and Volume (Tons) Analysis, By Market, 2019-2023
- By Country
- By Product Type
- By Nature
- By End Use
- By Sales Channel
- Current Market Size (US$ Bn) and Volume (Tons) Analysis and Forecast, By Country, 2024-2032
- Brazil
- Mexico
- Rest of Latin America
- Current Market Size (US$ Bn) and Volume (Tons) Analysis and Forecast, By Product Type, 2024-2032
- Refined Peanut Oil
- Unrefined Peanut Oil
- Cold-Pressed Peanut Oil
- Roasted Peanut Oil
- Current Market Size (US$ Bn) and Volume (Tons) Analysis and Forecast, By Nature, 2024-2032
- Organic
- Conventional
- Current Market Size (US$ Bn) and Volume (Tons) Analysis and Forecast, By End Use, 2024-2032
- Food Industry
- Pharmaceuticals & Nutraceuticals
- Cosmetics & Personal Care
- Others
- Current Market Size (US$ Bn) and Volume (Tons) Analysis and Forecast, By Sales Channel, 2024-2032
- B2B
- B2C
- Hypermarkets/Supermarkets
- Traditional Grocery Stores
- Convenience Stores
- Online Retail
- Others
- Market Attractiveness Analysis
- Historical Market Size (US$ Bn) and Volume (Tons) Analysis, By Market, 2019-2023
- Middle East & Africa Peanut Oil Market Outlook:
- Historical Market Size (US$ Bn) and Volume (Tons) Analysis, By Market, 2019-2023
- By Country
- By Product Type
- By Nature
- By End Use
- By Sales Channel
- Current Market Size (US$ Bn) and Volume (Tons) Analysis and Forecast, By Country, 2024-2032
- GCC Countries
- Egypt
- South Africa
- Northern Africa
- Rest of Middle East & Africa
- Current Market Size (US$ Bn) and Volume (Tons) Analysis and Forecast, By Product Type, 2024-2032
- Refined Peanut Oil
- Unrefined Peanut Oil
- Cold-Pressed Peanut Oil
- Roasted Peanut Oil
- Current Market Size (US$ Bn) and Volume (Tons) Analysis and Forecast, By Nature, 2024-2032
- Organic
- Conventional
- Current Market Size (US$ Bn) and Volume (Tons) Analysis and Forecast, By End Use, 2024-2032
- Food Industry
- Pharmaceuticals & Nutraceuticals
- Cosmetics & Personal Care
- Others
- Current Market Size (US$ Bn) and Volume (Tons) Analysis and Forecast, By Sales Channel, 2024-2032
- B2B
- B2C
- Hypermarkets/Supermarkets
- Traditional Grocery Stores
- Convenience Stores
- Online Retail
- Others
- Market Attractiveness Analysis
- Historical Market Size (US$ Bn) and Volume (Tons) Analysis, By Market, 2019-2023
- Competition Landscape
- Market Share Analysis, 2024
- Market Structure
- Competition Intensity Mapping By Market
- Competition Dashboard
- Company Profiles (Details - Overview, Financials, Strategy, Recent Developments)
- ADM
- Overview
- Segments and Product Type
- Key Financials
- Market Developments
- Market Strategy
- Cargill, Inc
- Olam Group
- Wilmar International Ltd
- Bunge Limited
- Marico
- Hain Celestial Group, Inc.
- Patanjali Ayurved Limited
- AAK
- Tata Consumer Products Limited
- Ventura Foods®
- Liberty Group
- Saraswathi Mills
- Mother Dairy Fruits & Vegetable Pvt Ltd
- La Tourangelle
- Others
- ADM
- Appendix
- Research Methodology
- Research Assumptions
- Acronyms and Abbreviations


- Food Ingredients & Additives
- Peanut Oil Market
Peanut Oil Market Size, Share, and Growth Forecast for 2025 - 2032
Peanut Oil Market Segmented by Product Type (Refined Peanut Oil, Unrefined Peanut Oil, Cold-Pressed Peanut Oil, and Roasted Peanut Oil), by Nature (Organic, Conventional), by End User (Food & Beverage, Pharmaceuticals & Nutraceuticals, Cosmetics & Personal Care, and Others), by Sales Channel (Business to Business, Business to Consumer), and Regional Analysis
Peanut Oil Market Size and Trends
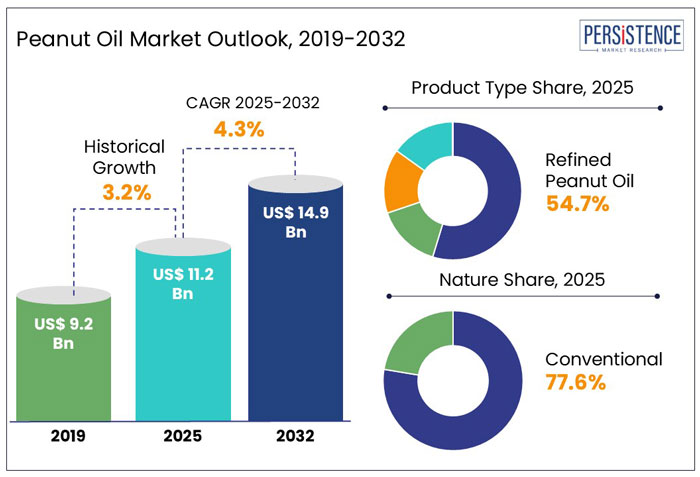
The Global Peanut Oil Market is estimated to grow from US$ 11.2 Bn in 2025 to US$ 14.9 Bn by 2032. The market is projected to record a CAGR of 4.3% during the forecast period from 2025 to 2032.
Key Highlights of the Peanut Oil Market
- Consumers prefer unrefined, chemical-free oils with high nutritional value, driving demand for cold-pressed and organic variants.
- Peanut oil's antioxidant and moisturizing properties boost its use in skincare, massage oils, and pharmaceutical applications.
- Companies are introducing fortified peanut oils enriched with omega-3, vitamin E, and plant sterols to cater to health-conscious consumers.
- Italy holds a significant market share in Europe due to its preference for premium and healthier cooking oils.
- China remains the largest consumer due to its strong culinary traditions and food industry demand.
|
Global Market Attributes |
Key Insights |
|
Peanut Oil Market Size (2025E) |
US$ 11.2 Bn |
|
Market Value Forecast (2032F) |
US$ 14.9 Bn |
|
Projected Growth (CAGR 2025 to 2032) |
4.3% |
|
Historical Market Growth (CAGR 2019 to 2024) |
3.2% |
Historical Growth and Course Ahead
The global peanut oil market has shown satisfactory growth in the historical period, registering a CAGR value of 3.2%, which was valued at US$ 9.2 Bn in 2019.
The market is expected to grow steadily with increasing awareness of the benefits of peanut oil applications. Peanut oil is considered one of the healthiest cooking oils as it is free from trans-fat and has low saturated fats. Due to the lower proportion of saturated fat, it is gaining traction among health-conscious consumers. Since consumer health consciousness is growing, the consumption pattern of edible oil is also witnessing a tectonic change. This has led the manufacturers to introduce healthy and fortified edible oils. Furthermore, with the rising emergence of modern trade channels across the developing regions, the outreach of edible oil is increasing in these regions.
During the forecast period, the global Peanut Oil market is estimated to show a CAGR of 4.3% to reach a valuation of US$ 14.9 Bn by the end of 2032.
Market Dynamics
Growth Drivers
Increased Demand for Cold-Pressed & Organic Variant Peanut Oil
Health-conscious consumers increasingly opt for oils that retain their natural nutrients, antioxidants, and flavors. Unlike refined peanut oil, cold-pressed variants are extracted mechanically without heat or chemicals, preserving essential fatty acids and vitamins. This makes them highly desirable for heart-healthy and chemical-free cooking options.
Additionally, organic peanut oil, which is free from pesticides and genetically modified organisms (GMOs), is becoming increasingly popular, particularly among consumers looking for environmentally friendly and sustainable products. This need has been further stimulated by the rising popularity of natural and clean-label foods, especially in North America and Europe.
Market Restraining Factors
Changing Agricultural Conditions Lead To Inconsistent Raw Material Costs.
Changing agricultural conditions significantly impact raw material costs in the peanut oil market. Climate change-induced extreme weather events, such as unpredictable rainfall and temperature fluctuations, disrupt peanut cultivation, leading to inconsistent yields and price volatility. For instance, in 2024, France experienced unprecedented rainfall, resulting in a 30-40% reduction in winter crop production, highlighting the global challenges agriculture faces.
Furthermore, peanut production is threatened by pests and plant diseases, which can occasionally cause significant crop losses. Farmers frequently use fertilizers and insecticides to reduce these risks, but their growing costs of agricultural inputs put further pressure on production costs. The volatility of raw material prices is also influenced by changing land use patterns and government regulations of export bans or farming subsidies.
Key Market Opportunity
Introducing fortified peanut oils with added nutrients
Health-conscious consumers are increasingly prioritizing functional foods. Companies can set themselves apart by enriching peanut oil with powerful ingredients like omega-3 fatty acids, vitamin E, and plant sterols. By transforming peanut oil into a nutrient-dense functional oil, businesses can attract a diverse market, including health enthusiasts, fitness aficionados, and aging populations seeking to enhance their well-being. This innovation elevates the culinary experience and positions peanut oil as a superior choice for those committed to a healthier lifestyle.
Government initiatives and regulatory support for nutrition-enriched products further increase the market potential for fortified peanut oils.
- In October 2024, The Government of India approved the National Mission on Edible Oils Oilseeds (NMEO-Oilseeds), a landmark initiative aimed at boosting domestic oilseed production and achieving self-reliance (Atmanirbhar Bharat) in edible oils. The Mission, with a financial outlay of Rs 10,103 crore, will be implemented over seven years from 2024-25 to 2030-31. This policy framework creates a favorable environment for innovation in the edible oils sector, encouraging manufacturers to invest in value-added products like fortified peanut oils.
Key Market Trend
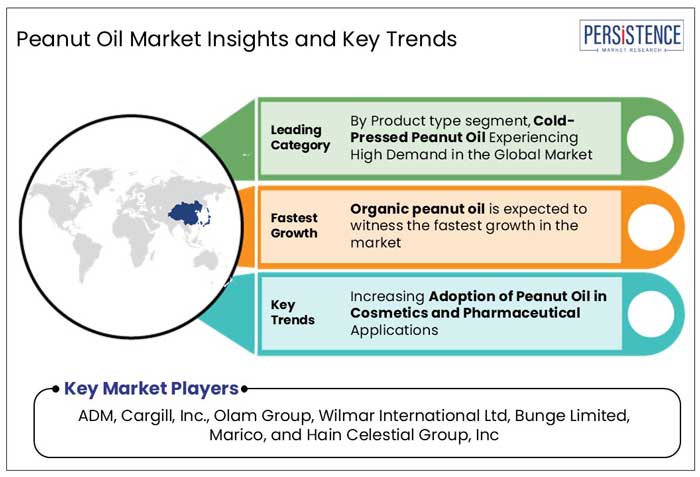
Increasing Adoption of Peanut Oil in Cosmetics and Pharmaceutical Applications
Peanut oil is gaining popularity as a key ingredient in cosmetics and pharmaceutical products. Crude peanut oil has a high content of vitamin D & E, and also has antioxidant properties, which makes it an excellent ingredient in soap and other skincare products. Peanut oil has a high fat content, which makes it an excellent base for massage oils. Various cosmetic manufacturers use fortified peanut oil as an emollient in skincare and hair care products. Cosmetic manufacturers are making appealing soaps, serums, and other products using flavored plant-based oil with its nutrients retained. The moisturizing characteristics and anti-aging features of high-oleic oils are the key reason for their increasing use in cosmetic products.
- Henry Lamotte Oils GmbH offers peanut oil that can be utilized in the cosmetics and pharmaceutical industry, highlighting its growing commercial importance.
Country-wise insights
Which Country Shows Promising Growth Potential for Peanut Oil Demand in the European Market?
Italy accounts for the largest share in the region at around 24%. It is among the top consumers of peanut oil because of its rich culinary traditions, strong preference for premium cooking oils, and desire for healthier substitutes. Peanut oil is used extensively in Italian cooking, particularly for frying, sautéing, and salad dressing. It is well-known for its mild flavor, high smoke point, and nutritional advantages.
Why is China the Main Market for Peanut Oil in East Asia?
China's vast population, long-standing culinary traditions, and growing food sector have made it the region's biggest producer and consumer of peanut oil in East Asia. Peanut oil's neutral flavor, high smoke point, and nutritional advantages make it a popular choice for stir-frying and deep-frying in Chinese homes, restaurants, and food processing businesses. The market share of China in the East Asia region is around 90%.
Category-wise insights
Why is Cold-Pressed Peanut Oil Experiencing High Demand in the Global Market?
The natural extraction method, high nutritional value, and growing customer desire for unrefined, chemical-free cooking oils are all contributing factors to the surge in demand for cold-pressed peanut oil worldwide. Cold-pressed peanut oil preserves vital minerals, antioxidants, and a deep taste since it is extracted without the use of heat or chemical solvents, in contrast to refined oils. This makes it appealing to consumers who are health-conscious and looking for natural oils that have undergone little processing.
Competitive Dashboard
The global peanut oil market is witnessing intense competition among key players as they focus on advanced processing techniques, product innovation, and strategic investments to strengthen their market presence. Several manufacturers are adding premium, minimally processed varieties to their portfolios in response to the rising demand for cold-pressed peanut oil. Cold-pressed peanut oil meets the growing demand for clean-label and organic products by retaining more nutrients, natural flavors, and antioxidants. To increase productivity and satisfy customer demand for chemical-free oils, companies are investing in automation and state-of-the-art extraction facilities.
Market expansion is being driven by strategic alliances and acquisitions, as companies enter rising areas including Asia-Pacific and Latin America. The worldwide peanut oil industry's competitive environment is being further shaped by ethical production, sustainable sourcing, and innovative branding.
Key Industry Developments
- In November 2023, Bharat Botanics proudly announces the grand opening of its cutting-edge wood-pressed cold oil processing facility in Gujarat, India. Spanning 16,000 square feet, this advanced and automated facility is designed to uphold the highest standards of hygiene and transparency.
- In August 2023, Tata Consumer Products (TCP), the consumer products arm of the Tata Group, has announced its entry into the premium and fast-growing cold-pressed oils segment under its brand ‘Tata Simply Better.’
Peanut Oil Industry Research by Category
By Product Type
- Refined Peanut Oil
- Unrefined Peanut Oil
- Cold-Pressed Peanut Oil
- Roasted Peanut Oil
By Nature
- Organic
- Conventional
By End User
- Food Industry
- Pharmaceuticals & Nutraceuticals
- Cosmetics & Personal Care
- Others
By Distribution Channel
- B2B
- B2C
- Hypermarkets/Supermarkets
- Traditional Grocery Stores
- Convenience Stores
- Online Retail
- Others
By Region:
- North America
- Europe
- East Asia
- South Asia & Oceania
- Latin America
- Middle East & Africa
Companies Covered in Peanut Oil Market
- ADM
- Cargill, Inc
- Olam Group
- Wilmar International Ltd
- Bunge Limited
- Marico
- Hain Celestial Group, Inc.
- Patanjali Ayurved Limited
- AAK
- Tata Consumer Products Limited
- Ventura Foods®
- Liberty Group
- Saraswathi Mills
- Mother Dairy Fruits & Vegetable Pvt Ltd
- La Tourangelle
Frequently Asked Questions
The Global Peanut Oil market is estimated to be valued at US$ 11.2 Bn by the end of 2025.
Cold-pressed peanut oil is experiencing the highest demand in the global market.
East Asia region dominates the Global Peanut Oil Market
The global peanut oil market is driven by increasing consumer demand for healthier cooking oils, growing awareness of its nutritional benefits, and expanding applications in the food industry.
ADM, Cargill, Inc., Olam Group, Wilmar International Ltd, Bunge Limited, Marico, and Hain Celestial Group, Inc. are the leading players in the Global Peanut Oil market.


