


- Executive Summary
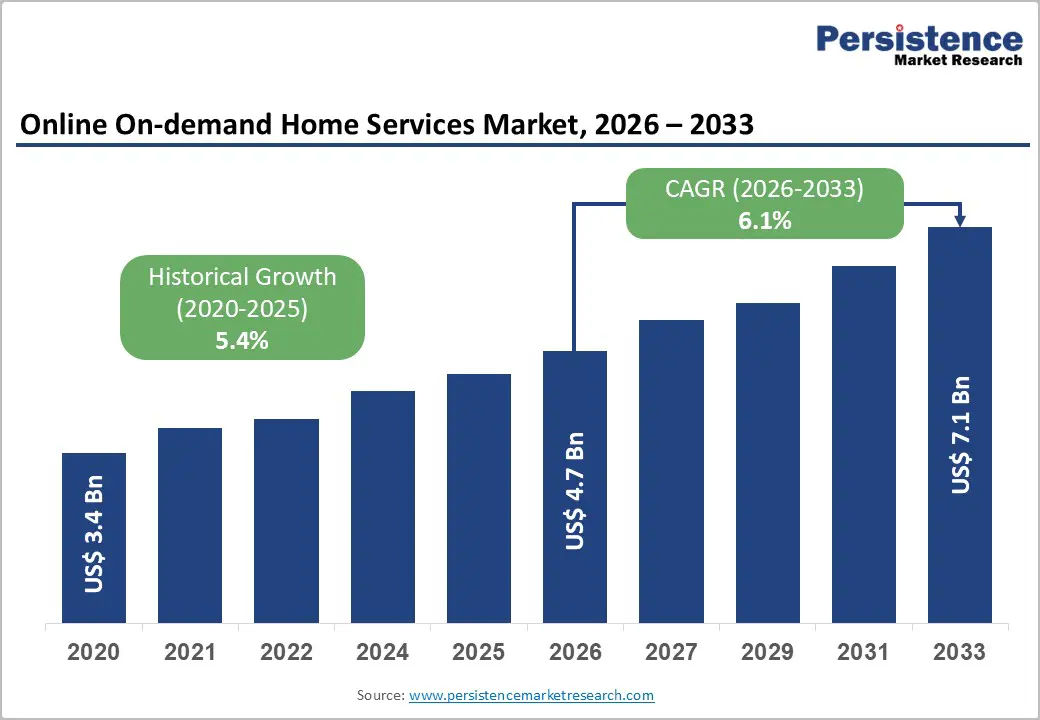
- Global Online On-demand Home Services Market Snapshot 2026 and 2033
- Market Opportunity Assessment, 2026 - 2033, US$ Bn
- Key Market Trends
- Industry Developments and Key Market Events
- Demand Side and Supply Side Analysis
- PMR Analysis and Recommendations
- Market Overview
- Market Scope and Definitions
- Value Chain Analysis
- Macro-Economic Factors
- Global GDP Outlook
- Global Home Services Industry Overview
- Global Gardening Industry Overview
- Forecast Factors - Relevance and Impact
- COVID-19 Impact Assessment
- PESTLE Analysis
- Porter's Five Forces Analysis
- Geopolitical Tensions: Market Impact
- Regulatory and Technology Landscape
- Market Dynamics
- Drivers
- Restraints
- Opportunities
- Trends
- Price Trend Analysis, 2020 - 2033
- Region-wise Price Analysis
- Price by Segments
- Price Impact Factors
- Global Online On-demand Home Services Market Outlook: Historical (2020 - 2025) and Forecast (2026 - 2033)
- Key Highlights
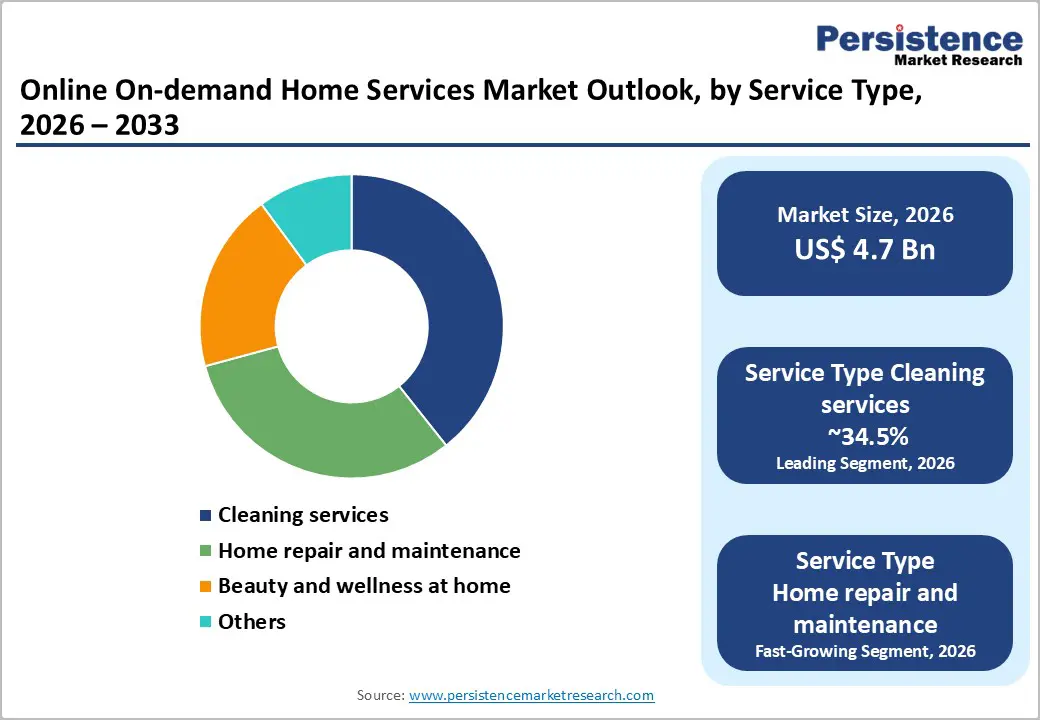
- Global Online On-demand Home Services Market Outlook: Service Type
- Introduction/Key Findings
- Historical Market Size (US$ Bn) and Volume (Units) Analysis by Service Type, 2020-2025
- Current Market Size (US$ Bn) and Volume (Units) Forecast, by Service Type, 2026-2033
- Cleaning services
- Home repair and maintenance
- Beauty and wellness at home
- Others
- Market Attractiveness Analysis: Service Type
- Global Online On-demand Home Services Market Outlook: Platform Type
- Introduction/Key Findings
- Historical Market Size (US$ Bn) and Volume (Units) Analysis by Platform Type, 2020-2025
- Current Market Size (US$ Bn) and Volume (Units) Forecast, by Platform Type, 2026-2033
- Mobile app
- Website
- Market Attractiveness Analysis: Platform Type
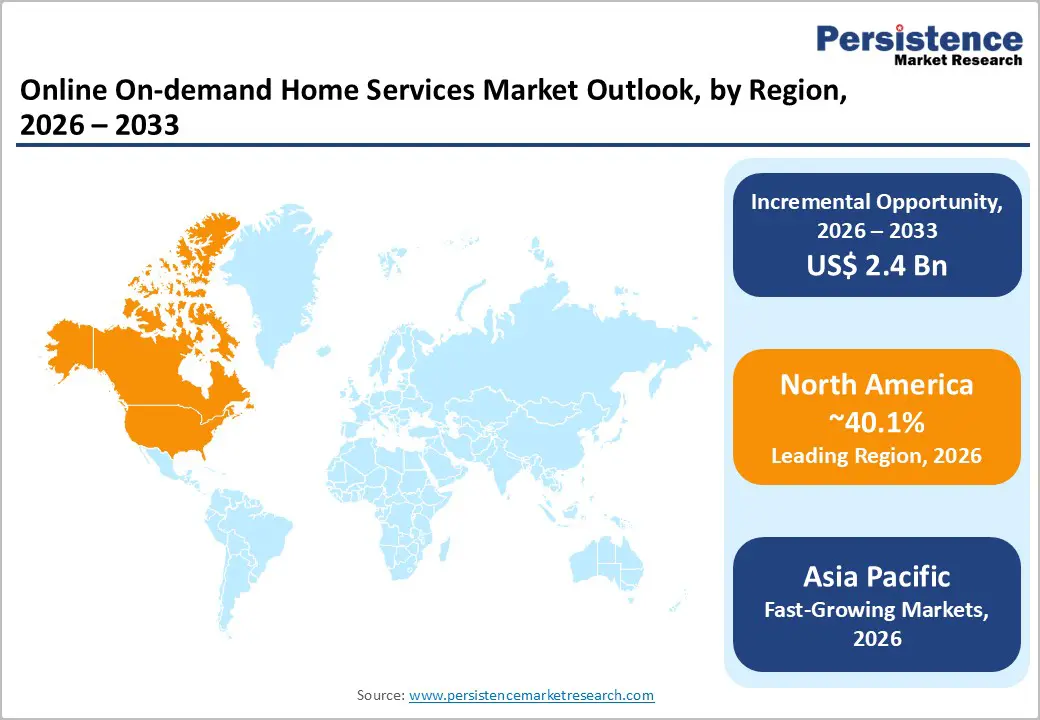
- Global Online On-demand Home Services Market Outlook: Region
- Key Highlights
- Historical Market Size (US$ Bn) and Volume (Units) Analysis by Region, 2020-2025
- Current Market Size (US$ Bn) and Volume (Units) Forecast, by Region, 2026-2033
- North America
- Europe
- East Asia
- South Asia & Oceania
- Latin America
- Middle East & Africa
- Market Attractiveness Analysis: Region
- North America Online On-demand Home Services Market Outlook: Historical (2020 - 2025) and Forecast (2026 - 2033)
- Key Highlights
- Pricing Analysis
- North America Market Size (US$ Bn) and Volume (Units) Forecast, by Country, 2026-2033
- U.S.
- Canada
- North America Market Size (US$ Bn) and Volume (Units) Forecast, by Service Type, 2026-2033
- Cleaning services
- Home repair and maintenance
- Beauty and wellness at home
- Others
- North America Market Size (US$ Bn) and Volume (Units) Forecast, by Platform Type, 2026-2033
- Mobile app
- Website
- Europe Online On-demand Home Services Market Outlook: Historical (2020 - 2025) and Forecast (2026 - 2033)
- Key Highlights
- Pricing Analysis
- Europe Market Size (US$ Bn) and Volume (Units) Forecast, by Country, 2026-2033
- Germany
- Italy
- France
- U.K.
- Spain
- Russia
- Rest of Europe
- Europe Market Size (US$ Bn) and Volume (Units) Forecast, by Service Type, 2026-2033
- Cleaning services
- Home repair and maintenance
- Beauty and wellness at home
- Others
- Europe Market Size (US$ Bn) and Volume (Units) Forecast, by Platform Type, 2026-2033
- Mobile app
- Website
- East Asia Online On-demand Home Services Market Outlook: Historical (2020 - 2025) and Forecast (2026 - 2033)
- Key Highlights
- Pricing Analysis
- East Asia Market Size (US$ Bn) and Volume (Units) Forecast, by Country, 2026-2033
- China
- Japan
- South Korea
- East Asia Market Size (US$ Bn) and Volume (Units) Forecast, by Service Type, 2026-2033
- Cleaning services
- Home repair and maintenance
- Beauty and wellness at home
- Others
- East Asia Market Size (US$ Bn) and Volume (Units) Forecast, by Platform Type, 2026-2033
- Mobile app
- Website
- East Asia Market Size (US$ Bn) and Volume (Units) Forecast, by , 2026-2033
- South Asia & Oceania Online On-demand Home Services Market Outlook: Historical (2020 - 2025) and Forecast (2026 - 2033)
- Key Highlights
- Pricing Analysis
- South Asia & Oceania Market Size (US$ Bn) and Volume (Units) Forecast, by Country, 2026-2033
- India
- Southeast Asia
- ANZ
- Rest of SAO
- South Asia & Oceania Market Size (US$ Bn) and Volume (Units) Forecast, by Service Type, 2026-2033
- Cleaning services
- Home repair and maintenance
- Beauty and wellness at home
- Others
- South Asia & Oceania Market Size (US$ Bn) and Volume (Units) Forecast, by Platform Type, 2026-2033
- Mobile app
- Website
- Latin America Online On-demand Home Services Market Outlook: Historical (2020 - 2025) and Forecast (2026 - 2033)
- Key Highlights
- Pricing Analysis
- Latin America Market Size (US$ Bn) and Volume (Units) Forecast, by Country, 2026-2033
- Brazil
- Mexico
- Rest of LATAM
- Latin America Market Size (US$ Bn) and Volume (Units) Forecast, by Service Type, 2026-2033
- Cleaning services
- Home repair and maintenance
- Beauty and wellness at home
- Others
- Latin America Market Size (US$ Bn) and Volume (Units) Forecast, by Platform Type, 2026-2033
- Mobile app
- Website
- Middle East & Africa Online On-demand Home Services Market Outlook: Historical (2020 - 2025) and Forecast (2026 - 2033)
- Key Highlights
- Pricing Analysis
- Middle East & Africa Market Size (US$ Bn) and Volume (Units) Forecast, by Country, 2026-2033
- GCC Countries
- South Africa
- Northern Africa
- Rest of MEA
- Middle East & Africa Market Size (US$ Bn) and Volume (Units) Forecast, by Service Type, 2026-2033
- Cleaning services
- Home repair and maintenance
- Beauty and wellness at home
- Others
- Middle East & Africa Market Size (US$ Bn) and Volume (Units) Forecast, by Platform Type, 2026-2033
- Mobile app
- Website
- Competition Landscape
- Market Share Analysis, 2025
- Market Structure
- Competition Intensity Mapping
- Competition Dashboard
- Company Profiles
- Urban Company
- Company Overview
- Product Portfolio/Offerings
- Key Financials
- SWOT Analysis
- Company Strategy and Key Developments
- TaskRabbit
- Thumbtack
- Handy Technologies
- Helpling
- Angi Inc.
- Amazon Home Services
- Porch.com
- TaskEasy
- ServiceWhale
- AskforTask
- Housejoy
- Zaarly
- LawnStarter
- Lawn Love
- Urban Company
- Appendix
- Research Methodology
- Research Assumptions
- Acronyms and Abbreviations

Loading page data
Please wait a moment


