


- Sensors & Controls
- Occupancy Sensor Market
Occupancy Sensor Market Size, Share, and Growth Forecast, 2026 - 2033
Occupancy Sensor Market by Installation Type (Wall Mount, Ceiling Mount, Fixture-integrated, Outdoor / Pole-mounted), Connectivity (Wireless Sensors, Wired Sensors), Technology (Passive Infrared, Ultrasonic, Dual Technology, Microwave (Radar-based), Others), Application, and Regional Analysis for 2026 - 2033
Occupancy Sensor Market Size and Trends
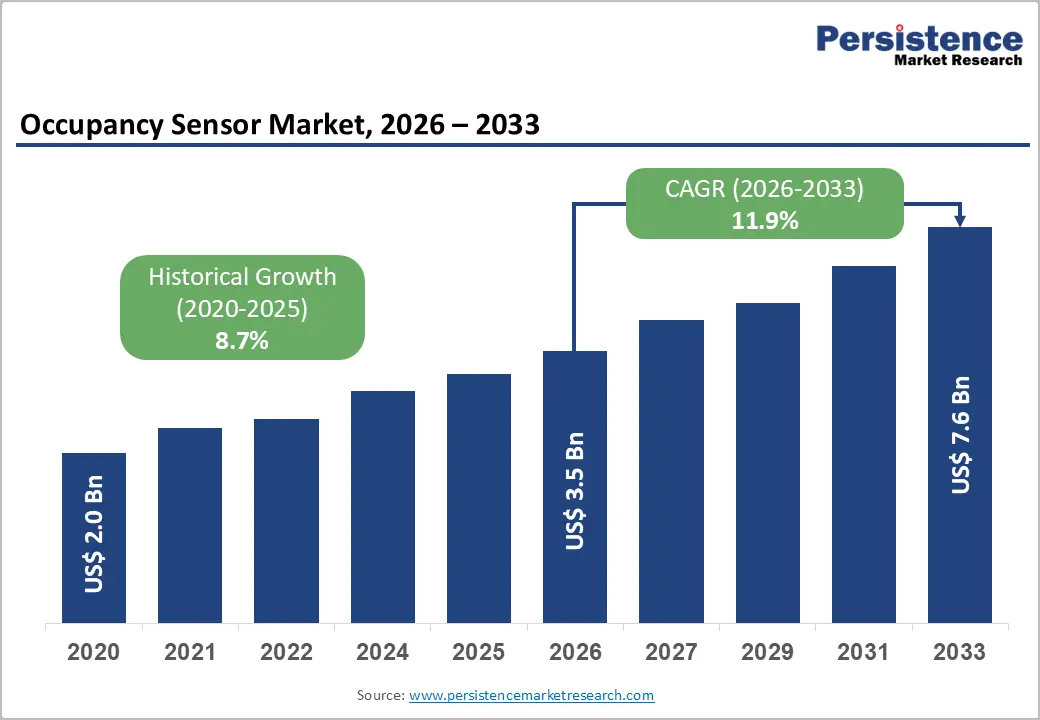
The global occupancy sensor market size is projected to rise from US$3.5 billion in 2026 to US$7.6 billion by 2033. It is anticipated to witness a CAGR of 11.9% during the forecast period from 2026 to 2033.
This robust expansion reflects accelerating demand for intelligent building automation, driven by stringent energy-efficiency regulations, digital transformation across commercial infrastructure, and growing institutional commitment to carbon-neutrality objectives. The market's momentum stems from regulatory mandates mandating building automation systems, technological advancement in wireless connectivity and AI-enabled sensing, and escalating energy costs compelling organizations to optimize facility operations.
Key Industry Highlights:
- Leading Installation Type: Ceiling mount dominates with over 40% market share in 2026, valued at more than US$ 1.4 Bn, driven by the need for wide-area, accurate coverage, minimal blind spots, and unobtrusive installation in offices, classrooms, and public spaces. Fixture-integrated sensors are the fastest-growing segment, with a 15.7% CAGR, favored for retrofit-friendly, space-saving, and aesthetically clean energy control solutions.
- Leading Connectivity: Wired sensors hold over 45% market share in 2026, valued at more than US$ 1.6 Bn, preferred for reliability, zero latency, and compliance with building codes. Wireless sensors are growing at the fastest 16.8% CAGR, driven by ease of installation, scalability, IoT integration, and real-time analytics needs.
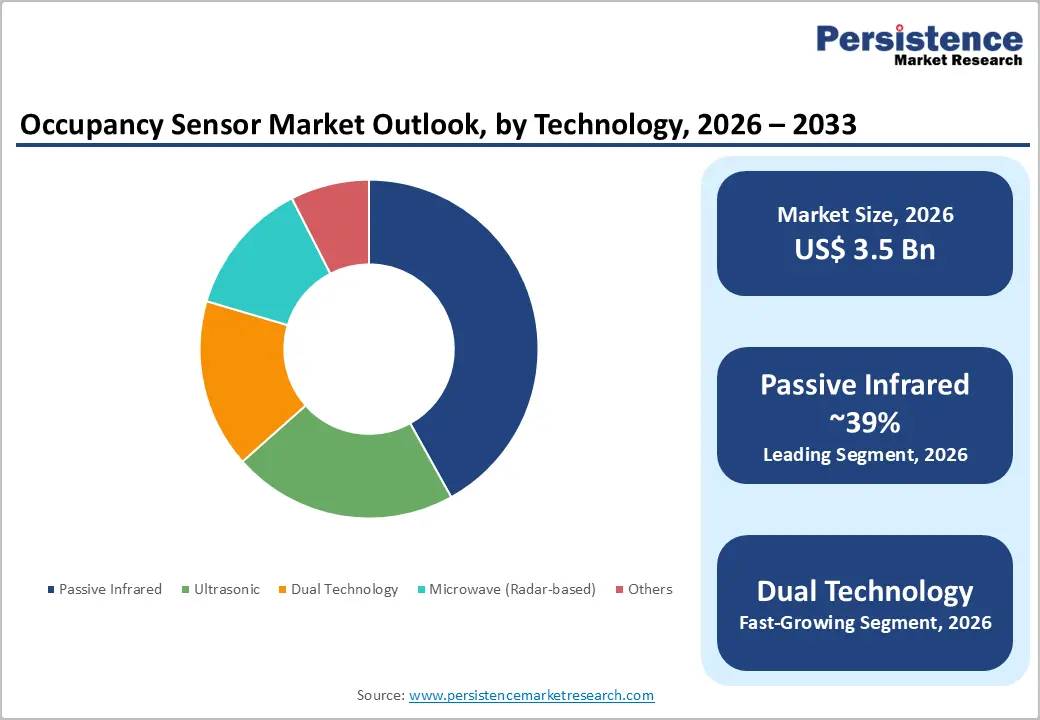
- Leading Technology: Passive infrared (PIR) sensors command more than 39% share in 2026, valued at over US$ 1.4 Bn, due to cost-effectiveness, low power consumption, and reliable motion detection. Dual-technology sensors grow fastest at 15.4% CAGR, offering highly accurate occupancy detection in complex environments by combining PIR and ultrasonic sensing.
- Leading Application: Offices hold the largest share at over 26% in 2026, valued at more than US$ 910 Mn, driven by energy efficiency, hybrid work models, and real-time space utilization needs. Residential is the fastest-growing application at 14.9% CAGR, propelled by smart home adoption, energy cost reduction, and automated HVAC/lighting control.
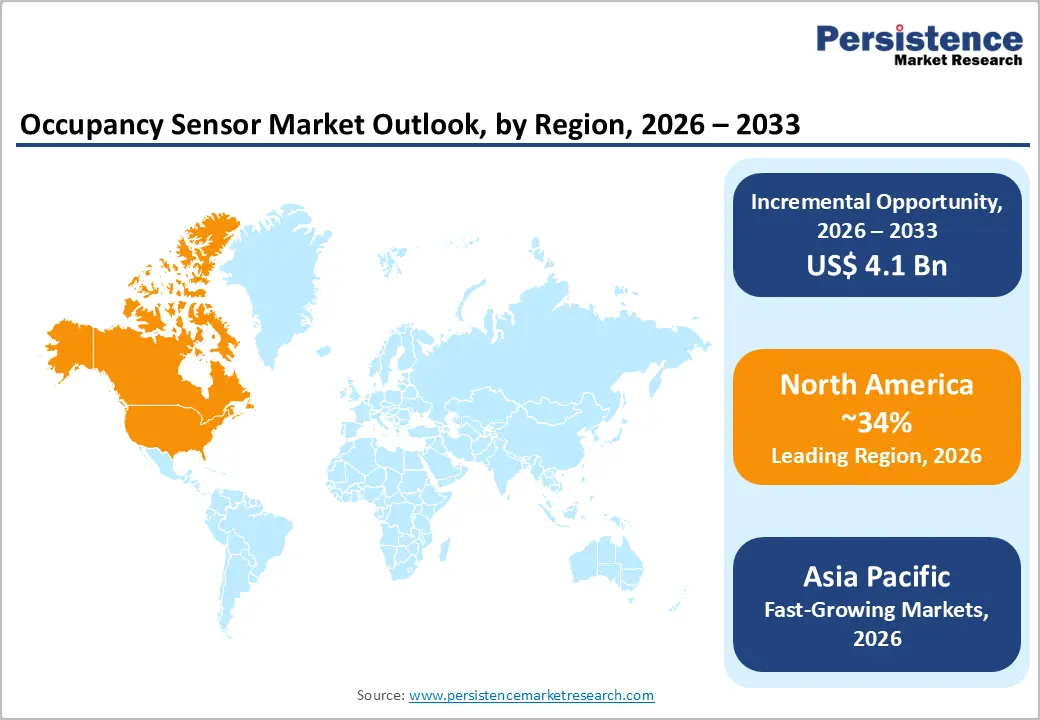
- Leading Region: North America leads with over 34% share in 2026, valued at US$ 1.2 Bn, supported by strong regulatory frameworks, early technology adoption, and a mature commercial real estate market. Asia Pacific grows fastest at 16.7% CAGR, fueled by urbanization, Smart City initiatives, and cost-effective sensor manufacturing. Europe holds more than a 26% share, driven by EPBD mandates, building retrofits, and energy-efficiency incentives.
| Key Insights | Details |
|---|---|
| Occupancy Sensor Market Size (2026E) | US$3.5 Bn |
| Market Value Forecast (2033F) | US$7.6 Bn |
| Projected Growth (CAGR 2026 to 2033) | 11.9% |
| Historical Market Growth (CAGR 2020 to 2025) | 8.7% |
Market Dynamics
Driver - Energy Efficiency Regulatory Mandates and Building Automation Compliance
Regulatory mandates are a key driver for occupancy sensor adoption. In Europe, the Energy Performance of Buildings Directive (EPBD) requires building automation in HVAC systems above 290 kW, with compliance by December 31, 2025, prompting significant capital investment in commercial buildings. In North America, ASHRAE 90.1 standards and local energy codes mandate occupancy-based controls for new constructions and major renovations. The U.S. EPA ENERGY STAR program, requiring a building performance score of 75/100 or higher, incentivizes ongoing sensor deployment to meet efficiency benchmarks. These regulations create predictable, multi-year procurement cycles across institutional and commercial portfolios, sustaining market growth even during economic fluctuations.
IoT-Enabled Occupancy Sensors Driving Smart Building Ecosystem Expansion
The convergence of modern occupancy sensors with cloud-based BMS and IoT platforms has transformed them from simple motion switches into intelligent building data assets, enabling real-time occupancy feeds for centralized dashboards, predictive HVAC/lighting control, and space-utilization analytics. IoT and ML-enabled sensors now automatically adapt detection thresholds and occupancy patterns, significantly reducing false triggers and boosting operational reliability. This integration expands the business case beyond energy savings, driving space optimization, on-demand cleaning triggers, occupant safety monitoring, and real estate footprint right-sizing. Studies indicate that occupancy-based lighting and HVAC control strategies achieve individual lighting savings of 10-60% and contribute to broader operational efficiencies and cost reductions in buildings.
Restraint - Installation Complexity and Infrastructure Retrofit Challenges
Integrating sensors into existing buildings often requires significant rewiring, structural modifications, or compatibility adjustments with legacy HVAC and lighting systems. In older buildings, there is limited space for mounting, uneven ceiling heights, and outdated electrical layouts that further complicate installation. High upfront labor costs and the need for skilled technicians delay deployment and reduce ROI for building owners. Retrofitting smart sensors in large or multi-story facilities disrupts daily operations, making adoption less attractive.
Data Privacy Concerns and Regulatory Uncertainty
Thermal and occupancy-based sensing technologies that track presence and movement patterns create legitimate privacy considerations, particularly in office and institutional environments where occupancy patterns reveal individual work behaviors. European data protection regulations (GDPR) establish strict requirements for sensor data governance and individual consent, adding compliance overhead. The lack of standardized privacy-preserving approaches creates uncertainty about regulatory exposure, slowing adoption in sectors that handle sensitive personal information.
Opportunity - Integration with Security and Safety Systems
When linked with access control, intrusion detection, and fire alarm systems, occupancy sensors enhance real-time monitoring and emergency response capabilities. This integration enables facilities to automate lighting, HVAC, and alerts based on actual occupancy, improving energy efficiency and enhancing safety. In commercial and industrial buildings, sensor data supports predictive security measures, such as identifying unauthorized access or overcrowding. The growing adoption of smart building technologies further drives demand for interoperable sensors. Regulatory emphasis on workplace safety and building code compliance is encouraging organizations to deploy integrated systems.
AI and Data Analytics are Shaping the Occupancy Sensor Adoption
AI-powered occupancy sensors analyze real-time data to optimize lighting, HVAC, and energy usage, reducing operational costs and improving sustainability. Integration with building management systems (BMS) enables automated responses based on occupancy patterns, improving user comfort and productivity. AI algorithms help identify anomalies, detect unauthorized access, and support security protocols. The ability to generate actionable insights from large datasets creates opportunities for service differentiation and recurring revenue through analytics platforms. AI and analytics transform occupancy sensors from simple detection devices into strategic tools for intelligent, energy-efficient, and secure buildings.
Category-wise Analysis
Installation Type Insights
Ceiling mount dominates the global market, capturing more than 40% market share in 2026, with a value exceeding US$ 1.4 Bn, as it meets the need for accurate, wide-area coverage in modern buildings. Their overhead placement minimizes blind spots and false triggers caused by furniture or partitions, ensuring reliable detection in offices, classrooms, and public spaces. They also align with the need for clean aesthetics and unobtrusive installation, especially in commercial and smart buildings.
Fixture-integrated demonstrates the highest growth rate, with a 15.7% CAGR, driven by the increasing need for seamless, space-saving, and retrofit-friendly energy control solutions. Integrating sensors directly into lighting fixtures eliminates extra wiring, reduces installation time, and lowers overall project costs. They support granular, zone-level lighting control, improving energy efficiency and compliance with stricter building energy codes. Demand for smart, aesthetically clean interiors in offices and retail spaces favor hidden, fixture-embedded sensors over standalone units.
Connectivity Insights
Wired sensors hold over 45% market share in 2026, with a value exceeding US$ 1.6 Bn, driven by the need for high reliability, zero latency, and uninterrupted performance. It ensures a stable power supply and consistent data transmission without dependence on batteries or wireless networks. Wired sensors also better meet stringent building codes, safety standards, and integration needs with existing building management and lighting control systems. For new constructions and large retrofits, wired installations offer lower long-term maintenance and predictable lifecycle costs, making them a preferred choice.
Wireless sensors are expected to grow at the highest rate, with a CAGR of 16.8%, due to the strong need for easy, low-disruption installation in both new and existing buildings. Wireless protocols supporting mesh networking enable signal propagation through obstacles and across multiple building zones without central power infrastructure, permitting deployment in situations where wired infrastructure is architecturally infeasible. The need for scalable, IoT- and cloud-connected systems to enable real-time space analytics and energy optimization is accelerating wireless adoption.
Technology Insights
Passive infrared sensors are expected to hold more than 39% in 2026 with a value exceeding US$ 1.4 Bn, as they effectively detect human motion using body heat, which meets the core need for reliable presence detection in buildings. They are cost-efficient and easy to install, aligning with widespread demand for affordable energy-saving solutions. PIR sensors also offer low power consumption and wide coverage, addressing efficiency needs. Their minimal maintenance requirements make them preferable for large-scale deployments.
Dual technology is expected to grow at a CAGR of 15.4%, due to its ability to deliver highly accurate occupancy detection in complex indoor environments. By combining PIR and ultrasonic sensing, it captures both heat-based and micro-movement activity, overcoming the limitations of single-technology sensors. Requiring dual confirmation before triggering occupancy significantly minimizes false activations caused by non-occupant heat or ambient motion. This results in better occupant comfort, higher energy efficiency, and improved operational performance in smart buildings.
Application Insights
Offices command the largest market share at over 26% in 2026, with a value exceeding US$ 910 Mn, driven by strong demand for energy efficiency and cost control across large commercial spaces. Modern offices require automated lighting and HVAC systems optimized for real-time occupancy to reduce energy and cooling waste. The rise of hybrid work models increases the need to monitor space utilization and manage underused areas effectively. Offices prioritize employee comfort, productivity, and compliance with green building norms, making occupancy sensors a standard building requirement rather than an optional add-on.
Residential is expected to grow at a CAGR of 14.9%, driven by the rising need for energy cost reduction in households. The growing adoption of smart homes and connected lighting/HVAC systems is driving demand for automated, presence-based control. Homeowners increasingly seek convenience, comfort, and hands-free operation, especially for lighting and climate control. Rising electricity prices and growing sustainability awareness are prompting residents to adopt occupancy sensors to reduce energy waste in unused rooms.
Regional Insights
North America Occupancy Sensor Market Trends
North America is projected to hold over 34% of the occupancy sensor market, reaching US$ 1.2 Bn by 2026, led by strong regulatory frameworks, high-value commercial real estate, and early technology adoption. The U.S. dominates, driven by ASHRAE 90.1 standards and California’s Title 24, which mandate and encourage voluntary compliance, fueling innovation and competition among manufacturers. Canada supports growth through provincial building codes that require occupancy automation in new construction. Mature distribution networks, strong manufacturer-integrator relationships, and advanced facilities management in corporate real estate further strengthen market leadership, while deep energy retrofits in aging buildings create recurring retrofit opportunities.
Asia Pacific Occupancy Sensor Market Trends
Asia Pacific is expected to grow at the highest rate with a CAGR of 16.7% driven by rapid urbanization, expanding commercial real estate, and government-backed Smart City initiatives. China leads the region, with Smart City programs mandating IoT sensor integration and large-scale commercial developments creating greenfield opportunities, while cost-effective manufacturing enables exports and competitive pricing. Japan’s mature infrastructure and focus on robotics and automation are fostering premium sensor adoption and innovation. India is the fastest-growing market, supported by the Smart Cities Mission, massive urban construction, and a projected 40% urban population by 2036, creating strong demand for affordable sensor solutions.
Europe Occupancy Sensor Market Trends
Europe is expected to hold more than 26% share by 2026, driven by strong regulatory frameworks making occupancy automation mandatory in commercial buildings. The EU Energy Performance of Buildings Directive requires occupancy-based controls in facilities with heating capacities above 290 kW, creating predictable procurement cycles. Germany’s industrial efficiency initiatives and building modernization, along with the UK’s sustainability goals and LEED adoption, boost deployment, while France and Spain benefit from EU funding for retrofits. High electricity costs further incentivize energy optimization through sensors, enhancing payback economics compared to behavioral or equipment-based approaches.
Competitive Landscape
The occupancy sensor market exhibits moderate consolidation, with dominant global players controlling a substantial market share, while regional and specialized competitors maintain viable niches. Top players command an estimated combined market share exceeding 45%. These manufacturers possess end-to-end capabilities spanning sensor technology, building management software, systems integration, and channel distribution. Companies are pursuing product innovation, such as AI- and IoT-enabled sensors, multi-sensor platforms, and portfolio diversification, to stay ahead in this competitive landscape.
Key Industry Developments
- In April 2025, Occuspace launched Micro, a new sensor that measures occupancy in small, shared workspaces like meeting rooms and phone booths, complementing its Macro sensor for larger areas. Using privacy-safe mmWave technology, Micro provides real-time, AI-driven insights to optimize space utilization and can integrate with booking systems, apps, and digital signage.
- In October 2024, XY Sense launched Presence, a wireless occupancy sensor for small office spaces like meeting rooms and phone booths, delivering real-time, privacy-safe insights with ~99% accuracy. The sensor integrates with XY Sense’s cloud platform for live monitoring, analytics, and predictive reporting, enabling organizations to optimize space usage efficiently.
Companies Covered in Occupancy Sensor Market
- Honeywell International Inc.
- Schneider Electric SE
- Johnson Controls
- Acuity Brands Inc.
- Signify Holding
- Legrand
- Lutron
- Eaton
- Hubbell Incorporated
- Leviton Manufacturing Co., Ltd.
- Crestron Electronics
- OSRAM GmbH
- ABB Ltd.
- Others
Frequently Asked Questions
The global occupancy sensor market is projected to be valued at US$3.5 Bn in 2026.
The growing need for energy-efficient buildings and automated space management, helping reduce electricity costs and optimize workplace utilization, is a key driver of the market.
The market is expected to witness a CAGR of 11.9% from 2026 to 2033.
The rising adoption of smart buildings, IoT integration is creating strong growth opportunities.
Honeywell International Inc., Schneider Electric SE, Johnson Controls, Acuity Brands Inc., Signify Holding, Legrand are among the leading key players.


