


- Executive Summary
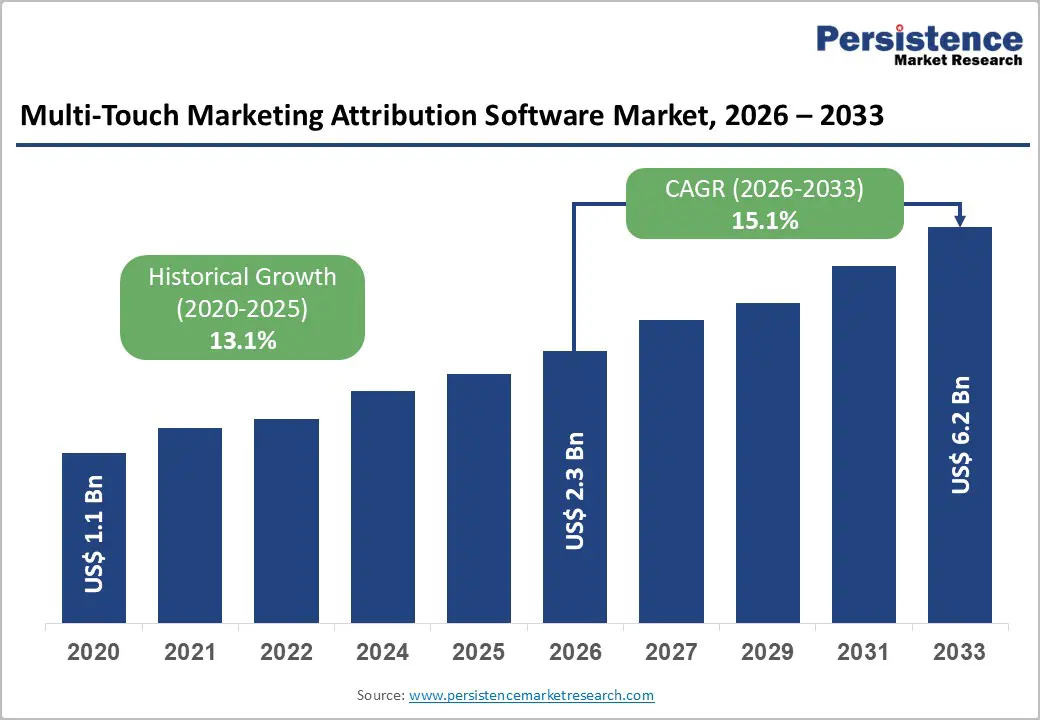
- Global Multi-Touch Marketing Attribution Software Market Snapshot 2026 and 2033
- Market Opportunity Assessment, 2026 - 2033, US$ Bn
- Key Market Trends
- Industry Developments and Key Market Events
- Demand Side and Supply Side Analysis
- PMR Analysis and Recommendations
- Market Overview
- Market Scope and Definitions
- Value Chain Analysis
- Macro-Economic Factors
- Global GDP Outlook
- Global BFS Industry Overview
- Global IT & Telecom Industry Overview
- Global Healthcare Industry Overview
- Global Retail Industry Overview
- Forecast Factors - Relevance and Impact
- COVID-19 Impact Assessment
- PESTLE Analysis
- Porter's Five Forces Analysis
- Geopolitical Tensions: Market Impact
- Regulatory and Technology Landscape
- Market Dynamics
- Drivers
- Restraints
- Opportunities
- Trends
- Price Trend Analysis, 2020 - 2033
- Region-wise Price Analysis
- Price by Segments
- Price Impact Factors
- Global Multi-Touch Marketing Attribution Software Market Outlook: Historical (2020 - 2025) and Forecast (2026 - 2033)
- Key Highlights
- Global Multi-Touch Marketing Attribution Software Market Outlook: Component
- Introduction/Key Findings
- Historical Market Size (US$ Bn) and Volume (Units) Analysis by Component, 2020-2025
- Current Market Size (US$ Bn) and Volume (Units) Forecast, by Component, 2026-2033
- Solutions
- Services
- Integration and Implementation Services
- Advisory Services
- Support and Maintenance Services
- Market Attractiveness Analysis: Component
- Global Multi-Touch Marketing Attribution Software Market Outlook: Deployment Model
- Introduction/Key Findings
- Historical Market Size (US$ Bn) and Volume (Units) Analysis by Deployment Model, 2020-2025
- Current Market Size (US$ Bn) and Volume (Units) Forecast, by Deployment Model, 2026-2033
- On-premise
- Cloud
- Market Attractiveness Analysis: Deployment Model
- Global Multi-Touch Marketing Attribution Software Market Outlook: Organization Size
- Introduction/Key Findings
- Historical Market Size (US$ Bn) and Volume (Units) Analysis by Organization Size, 2020-2025
- Current Market Size (US$ Bn) and Volume (Units) Forecast, by Organization Size, 2026-2033
- Large Enterprises
- Small and Medium-sized Enterprises (SMEs)
- Market Attractiveness Analysis: Organization Size
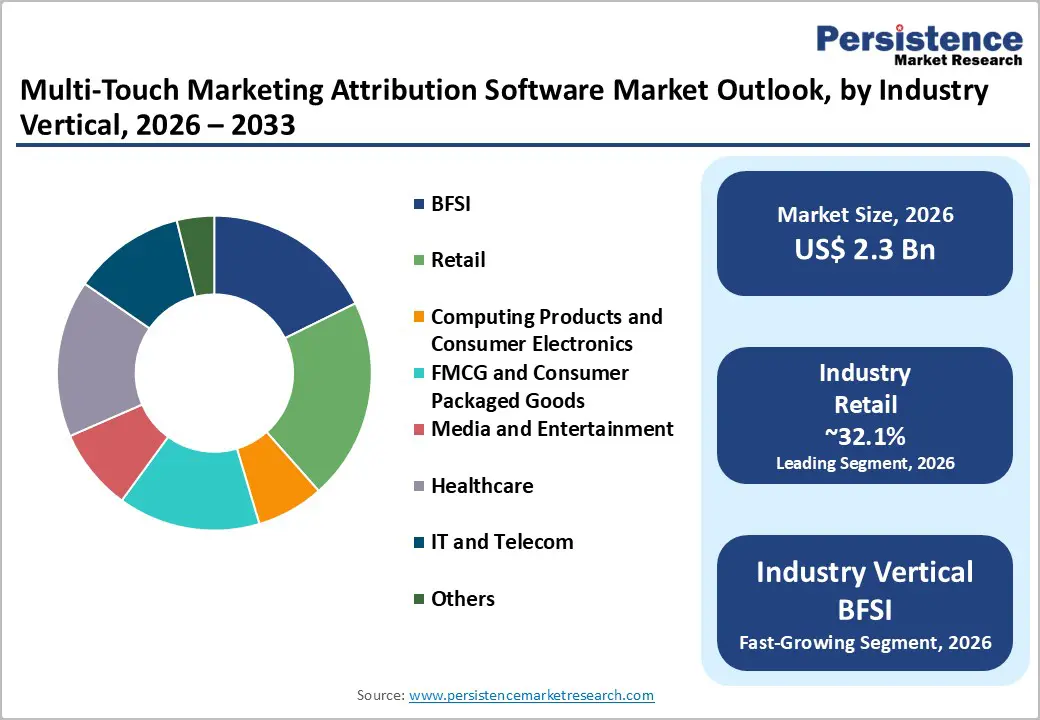
- Global Multi-Touch Marketing Attribution Software Market Outlook: Industry
- Introduction/Key Findings
- Historical Market Size (US$ Bn) and Volume (Units) Analysis by Industry, 2020-2025
- Current Market Size (US$ Bn) and Volume (Units) Forecast, by Industry, 2026-2033
- BFSI
- Retail
- Computing Products and Consumer Electronics
- FMCG and Consumer Packaged Goods
- Media and Entertainment
- Healthcare
- IT and Telecom
- Others
- Market Attractiveness Analysis: Industry
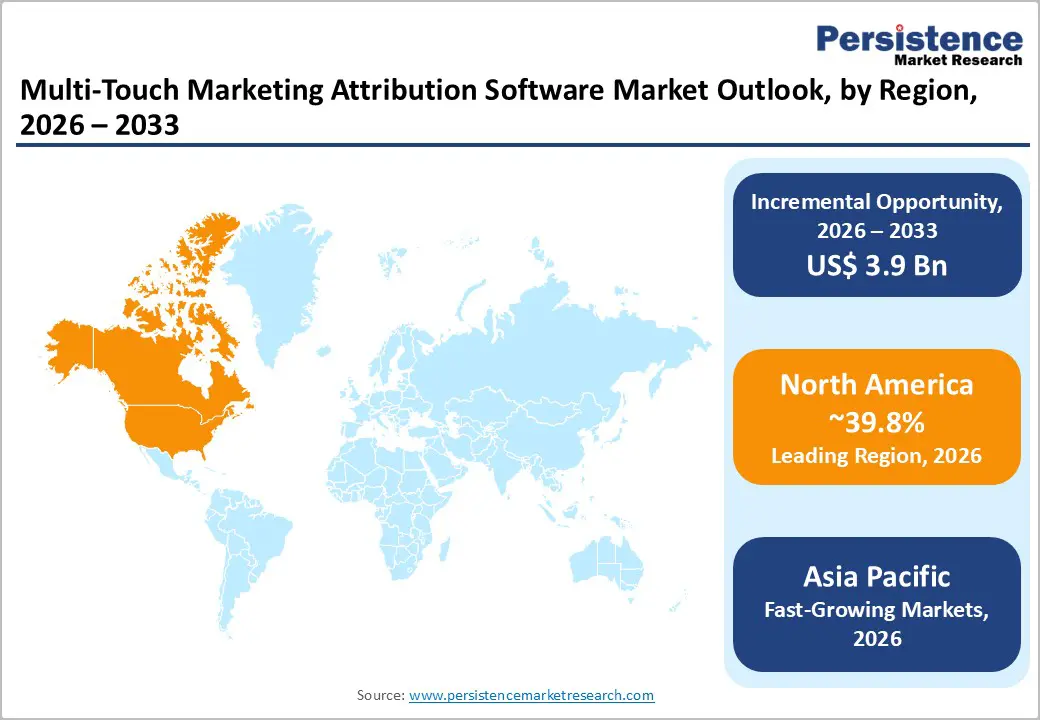
- Global Multi-Touch Marketing Attribution Software Market Outlook: Region
- Key Highlights
- Historical Market Size (US$ Bn) and Volume (Units) Analysis by Region, 2020-2025
- Current Market Size (US$ Bn) and Volume (Units) Forecast, by Region, 2026-2033
- North America
- Europe
- East Asia
- South Asia & Oceania
- Latin America
- Middle East & Africa
- Market Attractiveness Analysis: Region
- North America Multi-Touch Marketing Attribution Software Market Outlook: Historical (2020 - 2025) and Forecast (2026 - 2033)
- Key Highlights
- Pricing Analysis
- North America Market Size (US$ Bn) and Volume (Units) Forecast, by Country, 2026-2033
- U.S.
- Canada
- North America Market Size (US$ Bn) and Volume (Units) Forecast, by Component, 2026-2033
- Solutions
- Services
- Integration and Implementation Services
- Advisory Services
- Support and Maintenance Services
- North America Market Size (US$ Bn) and Volume (Units) Forecast, by Deployment Model, 2026-2033
- On-premise
- Cloud
- North America Market Size (US$ Bn) and Volume (Units) Forecast, by Organization Size, 2026-2033
- Large Enterprises
- Small and Medium-sized Enterprises (SMEs)
- North America Market Size (US$ Bn) and Volume (Units) Forecast, by Industry, 2026-2033
- BFSI
- Retail
- Computing Products and Consumer Electronics
- FMCG and Consumer Packaged Goods
- Media and Entertainment
- Healthcare
- IT and Telecom
- Others
- Europe Multi-Touch Marketing Attribution Software Market Outlook: Historical (2020 - 2025) and Forecast (2026 - 2033)
- Key Highlights
- Pricing Analysis
- Europe Market Size (US$ Bn) and Volume (Units) Forecast, by Country, 2026-2033
- Germany
- Italy
- France
- U.K.
- Spain
- Russia
- Rest of Europe
- Europe Market Size (US$ Bn) and Volume (Units) Forecast, by Component, 2026-2033
- Solutions
- Services
- Integration and Implementation Services
- Advisory Services
- Support and Maintenance Services
- Europe Market Size (US$ Bn) and Volume (Units) Forecast, by Deployment Model, 2026-2033
- On-premise
- Cloud
- Europe Market Size (US$ Bn) and Volume (Units) Forecast, by Organization Size, 2026-2033
- Large Enterprises
- Small and Medium-sized Enterprises (SMEs)
- Europe Market Size (US$ Bn) and Volume (Units) Forecast, by Industry, 2026-2033
- BFSI
- Retail
- Computing Products and Consumer Electronics
- FMCG and Consumer Packaged Goods
- Media and Entertainment
- Healthcare
- IT and Telecom
- Others
- East Asia Multi-Touch Marketing Attribution Software Market Outlook: Historical (2020 - 2025) and Forecast (2026 - 2033)
- Key Highlights
- Pricing Analysis
- East Asia Market Size (US$ Bn) and Volume (Units) Forecast, by Country, 2026-2033
- China
- Japan
- South Korea
- East Asia Market Size (US$ Bn) and Volume (Units) Forecast, by Component, 2026-2033
- Solutions
- Services
- Integration and Implementation Services
- Advisory Services
- Support and Maintenance Services
- East Asia Market Size (US$ Bn) and Volume (Units) Forecast, by Deployment Model, 2026-2033
- On-premise
- Cloud
- East Asia Market Size (US$ Bn) and Volume (Units) Forecast, by Organization Size, 2026-2033
- Large Enterprises
- Small and Medium-sized Enterprises (SMEs)
- East Asia Market Size (US$ Bn) and Volume (Units) Forecast, by Industry, 2026-2033
- BFSI
- Retail
- Computing Products and Consumer Electronics
- FMCG and Consumer Packaged Goods
- Media and Entertainment
- Healthcare
- IT and Telecom
- Others
- South Asia & Oceania Multi-Touch Marketing Attribution Software Market Outlook: Historical (2020 - 2025) and Forecast (2026 - 2033)
- Key Highlights
- Pricing Analysis
- South Asia & Oceania Market Size (US$ Bn) and Volume (Units) Forecast, by Country, 2026-2033
- India
- Southeast Asia
- ANZ
- Rest of SAO
- South Asia & Oceania Market Size (US$ Bn) and Volume (Units) Forecast, by Component, 2026-2033
- Solutions
- Services
- Integration and Implementation Services
- Advisory Services
- Support and Maintenance Services
- South Asia & Oceania Market Size (US$ Bn) and Volume (Units) Forecast, by Deployment Model, 2026-2033
- On-premise
- Cloud
- South Asia & Oceania Market Size (US$ Bn) and Volume (Units) Forecast, by Organization Size, 2026-2033
- Large Enterprises
- Small and Medium-sized Enterprises (SMEs)
- South Asia & Oceania Market Size (US$ Bn) and Volume (Units) Forecast, by Industry, 2026-2033
- BFSI
- Retail
- Computing Products and Consumer Electronics
- FMCG and Consumer Packaged Goods
- Media and Entertainment
- Healthcare
- IT and Telecom
- Others
- Latin America Multi-Touch Marketing Attribution Software Market Outlook: Historical (2020 - 2025) and Forecast (2026 - 2033)
- Key Highlights
- Pricing Analysis
- Latin America Market Size (US$ Bn) and Volume (Units) Forecast, by Country, 2026-2033
- Brazil
- Mexico
- Rest of LATAM
- Latin America Market Size (US$ Bn) and Volume (Units) Forecast, by Component, 2026-2033
- Solutions
- Services
- Integration and Implementation Services
- Advisory Services
- Support and Maintenance Services
- Latin America Market Size (US$ Bn) and Volume (Units) Forecast, by Deployment Model, 2026-2033
- On-premise
- Cloud
- Latin America Market Size (US$ Bn) and Volume (Units) Forecast, by Organization Size, 2026-2033
- Large Enterprises
- Small and Medium-sized Enterprises (SMEs)
- Latin America Market Size (US$ Bn) and Volume (Units) Forecast, by Industry, 2026-2033
- BFSI
- Retail
- Computing Products and Consumer Electronics
- FMCG and Consumer Packaged Goods
- Media and Entertainment
- Healthcare
- IT and Telecom
- Others
- Middle East & Africa Multi-Touch Marketing Attribution Software Market Outlook: Historical (2020 - 2025) and Forecast (2026 - 2033)
- Key Highlights
- Pricing Analysis
- Middle East & Africa Market Size (US$ Bn) and Volume (Units) Forecast, by Country, 2026-2033
- GCC Countries
- South Africa
- Northern Africa
- Rest of MEA
- Middle East & Africa Market Size (US$ Bn) and Volume (Units) Forecast, by Component, 2026-2033
- Solutions
- Services
- Integration and Implementation Services
- Advisory Services
- Support and Maintenance Services
- Middle East & Africa Market Size (US$ Bn) and Volume (Units) Forecast, by Deployment Model, 2026-2033
- On-premise
- Cloud
- Middle East & Africa Market Size (US$ Bn) and Volume (Units) Forecast, by Organization Size, 2026-2033
- Large Enterprises
- Small and Medium-sized Enterprises (SMEs)
- Middle East & Africa Market Size (US$ Bn) and Volume (Units) Forecast, by Industry, 2026-2033
- BFSI
- Retail
- Computing Products and Consumer Electronics
- FMCG and Consumer Packaged Goods
- Media and Entertainment
- Healthcare
- IT and Telecom
- Others
- Competition Landscape
- Market Share Analysis, 2025
- Market Structure
- Competition Intensity Mapping
- Competition Dashboard
- Company Profiles
- Adobe, Inc.
- Company Overview
- Product Portfolio/Offerings
- Key Financials
- SWOT Analysis
- Company Strategy and Key Developments
- SAP SE
- Oracle Corporation
- Neustar, Inc.
- Visual IQ / NielsenIQ
- LeadsRx, Inc.
- LeanData, Inc.
- Merkle, Inc.
- C3 Metrics, Inc.
- AppsFlyer Ltd.
- Adjust GmbH
- HubSpot, Inc.
- Conversion Logic, Inc.
- Engagio / Demandbase
- CaliberMind, Inc.
- Adobe, Inc.
- Appendix
- Research Methodology
- Research Assumptions
- Acronyms and Abbreviations

Loading page data
Please wait a moment


