


- Home Care & Utilities
- Mosquito Repellents Market
Mosquito Repellents Market Size, Share, and Growth Forecast 2026–2033
Mosquito Repellents Market by Product Type (Coil, Spray, Cream and Oil, Vaporizers, Others), Raw Material (Plant-based Repellents, Chemically Derived Repellents), Distribution Channel (Retail Stores, Supermarkets, Online, Others), Industry (Pharmaceuticals, Chemicals & Petrochemicals, Textile & Spandex, Automotive, Paints & Coatings, Electronics, Others), and Regional Analysis for 2026–2033
Mosquito Repellents Market Size and Trend Analysis
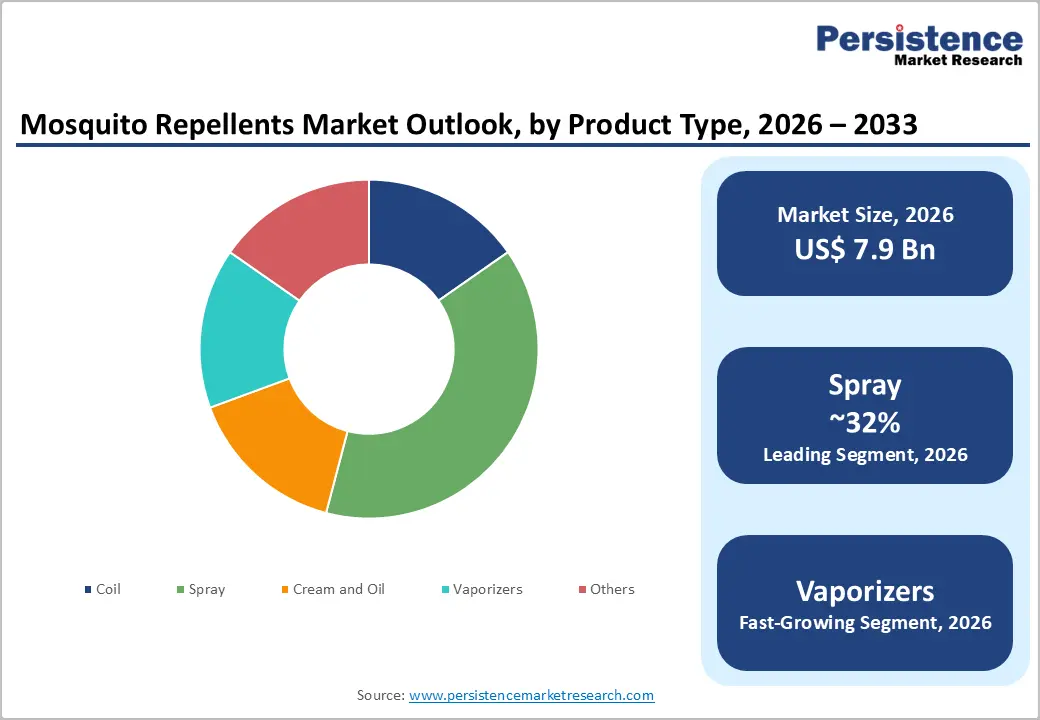
The global mosquito repellents market size is valued at US$ 7.9 billion in 2026 and is projected to reach US$ 12.1 billion by 2033, growing at a CAGR of 6.2% between 2026 and 2033. Mosquito repellents function as an essential protective solution by preventing mosquitoes from landing on human skin, biting, and transmitting dangerous diseases such as malaria, Zika virus, and West Nile virus. These products work by disrupting the insect's ability to detect human body odor and carbon dioxide.
The global mosquito repellents market is strongly influenced by the widespread presence of mosquito species and the increasing prevalence of mosquito-borne diseases across tropical and subtropical regions. According to World Population Review 2026, Brazil has the highest number of mosquito species globally, with approximately 447 species, followed by Indonesia with 439 species, Malaysia with 415 species, Thailand with 379 species, India with 338 species, and Philippines among the leading mosquito-dense nations. These countries represent major high-risk zones for mosquito-borne infections, significantly driving the consumption of mosquito repellent products including coils, vaporizers, sprays, creams, and wearable repellents.
Key Industry Highlights
- Disease Protection Demand: Rising cases of malaria, dengue, Zika virus, chikungunya, and West Nile virus are significantly driving the mosquito repellents market, with the World Health Organization reporting over 700 million mosquito-borne infections annually worldwide across healthcare, residential, travel, and outdoor sectors.
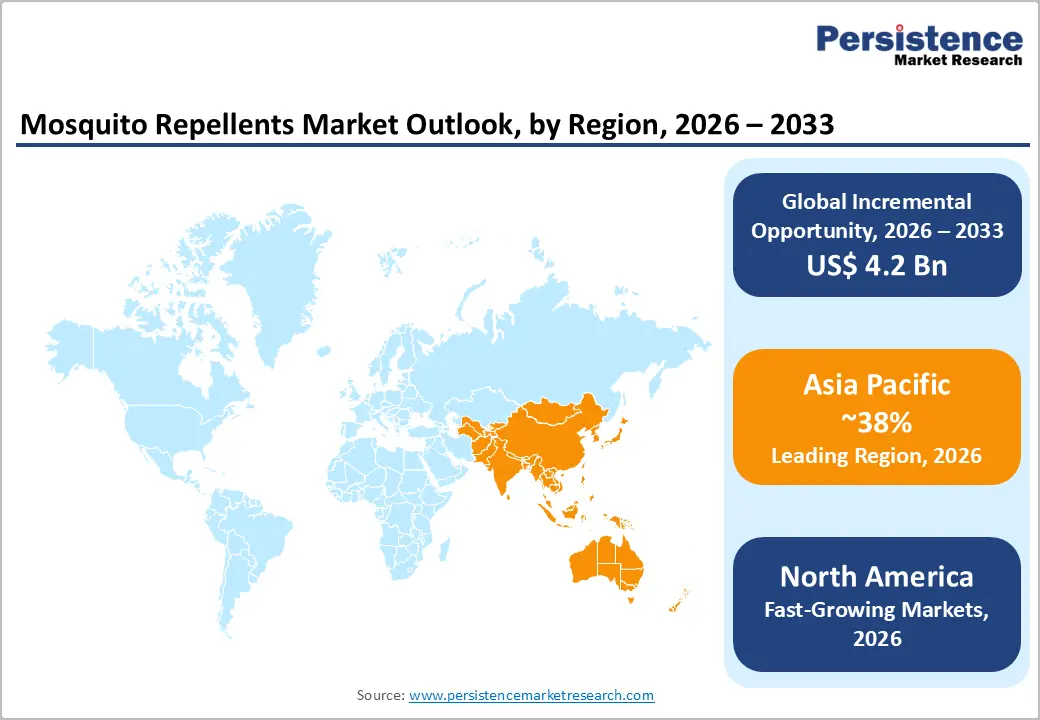
- Asia Pacific Dominance: Asia Pacific accounts for approximately 38% of global mosquito repellents market share due to high tropical disease prevalence, large consumer populations, rapid urbanization, expanding middle-class spending, and strong manufacturing capabilities in countries such as India and China.
- Spray Segment Leadership: Spray-based mosquito repellents dominate the product category with nearly 32% share, supported by portability, ease of application, strong outdoor usage trends, premium product availability, and recommendations from health organizations including the CDC.
- Plant-Based Growth: Plant-based repellents are projected to expand at a CAGR of approximately 9.1% in the forecast period driven by increasing consumer preference for DEET-free formulations, herbal protection products, clean-label ingredients, and eco-friendly mosquito repellent solutions.
- Smart Vaporizer Expansion: Smart vaporizer devices are expected to grow at a CAGR of approximately 8.4% supported by rising demand for connected home protection systems featuring app-based controls, refill alerts, child safety mechanisms, and indoor air-quality benefits.
- Online Channel Growth: Online distribution channels are forecast to register a CAGR of around 10.2% fueled by rapid e-commerce adoption, subscription-based replenishment services, direct-to-consumer brand strategies, and increasing digital retail penetration globally.
- Chemical Segment Dominance: Chemically derived repellents account for nearly 61% of the global share due to their proven effectiveness, regulatory approvals, longer shelf life, affordable pricing, and strong retail and pharmacy presence worldwide.
- Pharmaceutical Industry Leadership: The pharmaceutical sector captures approximately 38% of total mosquito repellents market share, supported by dermatologist-tested formulations, physician recommendations, OTC approvals, and growing preventive healthcare awareness in disease-endemic regions.

Market Dynamics
Drivers - Rising Prevalence of Mosquito-Borne Diseases Fuels Protective Product Demand
The persistent global burden of vector-borne diseases remains the most compelling driver of the mosquito repellents market. The WHO reported 249 million malaria cases globally in 2022, while dengue infections have increased eightfold over the last two decades, with approximately 3.9 billion people in over 129 countries at risk. Emerging outbreaks of Zika virus, chikungunya, and West Nile virus have accelerated public and governmental emphasis on preventive measures.
National health bodies such as the U.S. Centers for Disease Control and Prevention (CDC) and the European Centre for Disease Prevention and Control (ECDC) actively recommend personal protective measures including repellents. These disease vectors' widening geographic spread driven partly by climate change expands the addressable market into previously low-risk temperate regions, creating sustained incremental demand globally.
Increasing Consumer Preference for Natural Repellent Products and Health-Conscious Choices
A shift toward health-oriented and environmentally conscious consumerism is reshaping purchasing patterns across the mosquito repellents landscape. Natural Repellent Products derived from botanical actives such as citronella, eucalyptus oil, neem, and lemon eucalyptus are witnessing elevated consumer preference, particularly among parents, pregnant women, and eco-conscious demographics.
According to the U.S. Environmental Protection Agency (EPA), oil of lemon eucalyptus (OLE) is an EPA-registered plant-based repellent with efficacy comparable to low concentrations of DEET. The organic personal care market has grown consistently, and this trend directly benefits botanical repellent formulations. In 2023, global organic cosmetics and personal care sales exceeded US$ 15 billion, signaling robust consumer appetite for plant-derived protective products that translates into heightened willingness to pay premiums.
Restraints - Regulatory Restrictions and Health Concerns Over Synthetic Chemical Actives
Intensifying regulatory scrutiny of synthetic repellent ingredients, particularly DEET (N,N-Diethyl-meta-toluamide) and permethrin, poses a significant constraint on market expansion. The European Chemicals Agency (ECHA) has reviewed and restricted permissible concentration limits for several synthetic biocides under the EU Biocidal Products Regulation (BPR).
Growing consumer awareness about potential neurological side effects associated with high-concentration DEET applications has led to reduced acceptance, particularly for pediatric use. This dual pressure from regulators and health-conscious consumers constrains product formulation flexibility and increases compliance costs for manufacturers, ultimately limiting accessible market segments.
Seasonal Demand Concentration and Its Impact on Revenue Stability
The mosquito repellents market is subject to pronounced seasonal cyclicality, which creates significant revenue volatility and operational inefficiencies for manufacturers. Demand typically surges during warmer, humid months peaking between April and September in northern hemisphere markets before declining sharply in cooler periods. This seasonality limits manufacturers' ability to maintain steady production runs, optimize supply chains, and plan consistent marketing investments.
Retailers face inventory management challenges, and smaller producers in particular struggle with cash flow constraints during off-peak months. While tropical markets exhibit more year-round demand, the global weighted demand profile remains seasonal, suppressing overall utilization rates.
Opportunities - Rapid Expansion of Smart Vaporizer Devices and Technology-Integrated Repellents
The convergence of consumer electronics and personal protection is generating a high-value opportunity in Smart Vaporizer Devices embedded with IoT connectivity, refill tracking, and app-based usage monitoring. The global smart home device market, valued at over US$ 80 billion in 2023 per Statista, provides a fertile ecosystem for tech-enabled repellent appliances.
Leading players such as Godrej Consumer Products and Reckitt Benckiser have begun launching vaporizers with precision-dose technology and child-safe auto-shutoff mechanisms. The growing indoor air quality concern amplified post-COVID further increases consumer receptivity toward plug-in and USB-powered vaporizers. Product differentiation through patented delivery mechanisms offers manufacturers opportunities to command premium pricing and build strong brand loyalty, particularly in urban Asia Pacific and North American households.
Growing Demand for DEET-Free and Eco-Friendly Repellents Opens New Premium Market Segments
The global pivot toward DEET-Free Formulations and Eco-Friendly Repellents represents a transformative opportunity for innovation-focused manufacturers. Regulatory momentum supporting safer alternatives including icaridin (also known as picaridin), IR3535, and essential oil blends creates an expanding product canvas.
The U.S. National Organic Program (NOP) and equivalent standards in the EU and Australia are formalizing certification pathways for bio-based repellents, enabling trust-building with premium consumers. In 2024, SC Johnson expanded its OFF! Botanicals line, reflecting surging retail demand. Herbal Protection Solutions utilizing neem-based and ayurvedic ingredients are especially attractive in South and Southeast Asian markets where traditional remedies carry cultural resonance, enabling companies to capture consumer trust alongside modern efficacy claims.
Category-wise Analysis
Product Type Insights
Spray-based mosquito repellents represent the leading segment within the product type category, commanding approximately 32% of total market share. The dominance of sprays is attributable to their versatility, ease of application, and broad consumer acceptance across age groups and geographies. Aerosol and pump sprays containing DEET, picaridin, and botanical actives are widely recommended by health authorities including the CDC for personal protection in endemic regions.
The portability of spray formats makes them the preferred choice for outdoor enthusiasts, travelers, and urban consumers alike. Strong brand penetration by companies such as SC Johnson (OFF!) and Reckitt Benckiser (Dettol) has reinforced spray as the default repellent format. Retail shelf visibility, competitive pricing, and a broad spectrum of active ingredient concentrations from 5% to 100% DEET formulations further entrench spray as the market-leading product type.
Vaporizers represent the fastest growing product type segment, projected to expand at a CAGR of approximately 8.4%. Rising urbanization, increasing indoor mosquito activity, and growing consumer preference for passive, continuous protection drive rapid adoption. Smart Vaporizer Devices with programmable settings and refill alerts are reshaping this segment, attracting a tech-savvy, premium-willing consumer base particularly in urban Asia and Europe.
Raw Material Insights
Chemically derived repellents constitute the dominant segment within the raw material category, accounting for approximately 61% of the global market share. Synthetic active ingredients most notably DEET (first developed by the U.S. Army in 1946), picaridin, IR3535, and permethrin offer proven, broad-spectrum efficacy against multiple mosquito species and other arthropods. These compounds benefit from extensive clinical validation, standardized manufacturing processes, and widespread regulatory approval in major markets including the U.S., EU, Australia, and India. Chemically derived formulations retain dominant pharmacy and retail shelf presence, supported by robust supply chains and long shelf life. Mass-market affordability and consumer familiarity with brand names built on synthetic actives reinforce their continued dominance despite growing interest in natural alternatives.
Plant-based repellents are the fast-growing segment within raw materials, expected to record a CAGR of approximately 9.1% between 2026 and 2033. Surging interest in DEET-Free Formulations and Herbal Protection Solutions fueled by heightened health consciousness, regulatory support for botanical actives, and clean-label product trends are collectively driving this momentum. Natural actives such as oil of lemon eucalyptus (OLE) now carry official EPA and WHO efficacy recognition, bridging the efficacy-trust gap for mainstream consumers.
Distribution Channel Insights
Supermarkets and hypermarkets constitute the leading distribution channel for mosquito repellents, accounting for roughly 35% of global sales. The channel's dominance is rooted in its extensive geographic footprint, consumer footfall, and the ability to showcase diverse product portfolios including premium sprays, plug-in vaporizers, and budget coils in a single shopping trip.
Organized retail expansion across Asia Pacific, Latin America, and the Middle East has strengthened this channel's reach. Large chains such as Walmart, Carrefour, and Reliance Retail offer branded promotional endcaps and seasonal campaign support that significantly boosts sell-through rates. In-store trial promotions, bundled packs, and private-label alternatives further consolidate supermarket channels as the primary consumer touchpoint, particularly in price-sensitive emerging markets.
The online distribution channel is the fastest growing segment, projected to achieve a CAGR of 10.2%. Acceleration in e-commerce adoption post-2020, subscription-model replenishment services, and direct-to-consumer brand strategies especially through Amazon, Flipkart, and brand-owned websites are rapidly expanding online as a primary purchase channel for repellent products.
Industry Insights
The pharmaceuticals industry is the leading end-use segment in the mosquito repellents market, capturing approximately 38% of total share. Pharmaceutical-grade repellent formulations including dermatologist-tested skin creams, medicated lotions, and clinically validated sprays are distributed through pharmacy chains, healthcare clinics, and travel medicine centers. The segment benefits from physician and pharmacist endorsements, prescriptions in disease-endemic zones, and reimbursement pathways in some national healthcare systems.
Regulatory bodies such as the U.S. Food and Drug Administration (FDA) classify certain repellents under Over-the-Counter (OTC) drug monographs, ensuring product standardization and consumer confidence. Traveler health programs promoted by the CDC and national health ministries further reinforce pharmaceutical channel demand for repellents, especially DEET and picaridin-based formulations.
The chemicals & petrochemicals industry represents the fastest growing end-use segment, anticipated to expand at a CAGR of 7.6%. The segment's growth is driven by increasing upstream manufacturing of repellent active ingredients and intermediate chemical compounds, particularly in Asia Pacific where chemical production capacity is scaling rapidly to supply both domestic and export-oriented formulation industries.
Regional Insights
North America Mosquito Repellents Trends
North America holds approximately 27% of global market share and is characterized by high per-capita repellent expenditure, sophisticated retail infrastructure, and stringent regulatory oversight. The U.S. Environmental Protection Agency (EPA) maintains a well-established registration process for repellent active ingredients, ensuring product safety and efficacy transparency. Consumer demand for Eco-Friendly Repellents and DEET-Free Formulations has grown substantially, with multiple clean-label brands gaining retail distribution through major chains.
West Nile Virus outbreaks, Zika virus alerts in southern states, and increasing incidence of Eastern Equine Encephalitis (EEE) have reinforced CDC advisories on repellent use, boosting consumer compliance. The region's well-developed e-commerce ecosystem and high digital literacy support strong online sales growth. Premium product innovation including wearable repellent patches, Deet-Free aerosols, and botanical diffusers continues to expand the high-margin product mix in the region.
- United States Outdoor Lifestyle Driving Premium Repellent Demand
The United States is the single largest country market within North America, accounting for over 80% of regional revenues. The U.S. market is projected to grow at a CAGR of approximately 5.5% during the forecast period. Its centrality to the regional market rests on multiple pillars: the country's high outdoor recreation culture, spanning camping, hiking, and outdoor sports, translates into year-round demand for personal protection. The CDC's robust Travel Health advisories and school- and community-level vector control programs normalize repellent use. Major corporate headquarters of SC Johnson and Spectrum Brands in the U.S. ensure strong domestic product availability and first-to-market innovation launches. Premium repellent formats including long-lasting, water-resistant, and sport-specific formulations are well-accepted, enabling strong average selling prices.
Europe Mosquito Repellents Trends
Europe accounts for approximately 22% of global market share. The region's market is shaped by the EU Biocidal Products Regulation (BPR) framework, which mandates rigorous safety and environmental assessments for all repellent active ingredients. This regulatory rigor, while adding compliance costs, enhances consumer confidence and elevates product quality standards region-wide. Northern and Western European consumers exhibit strong preference for premium and natural repellent products, supported by high disposable incomes and environmental awareness.
Southern European countries particularly Spain, Italy, and Greece have experienced heightened mosquito activity with the northward migration of Aedes albopictus (tiger mosquito), driving seasonal demand spikes. The ECDC has issued multiple risk assessments on dengue and West Nile Virus transmission risks within Europe, further prompting health ministry campaigns that raise repellent awareness and adoption across the continent.
- Germany Natural Repellents Supporting Sustainable Market Expansion
Germany is the largest individual European market, contributing roughly 18% of European market revenues. The German market is growing at a CAGR of approximately 5.0%. Germany's prominence reflects high consumer spending power, a strong green consumer culture with significant preference for Natural Repellent Products and plant-derived formulations, and robust pharmacy retail channels.
The Bundesinstitut für Risikobewertung (BfR) regularly updates public guidance on safe repellent use, reinforcing market awareness. Germany's well-organized outdoor sports and travel sector supports consistent year-round demand, and domestic R&D investment from companies like Bayer AG feeds innovation in formulation chemistry, including icaridin-based and botanical combinations.
- United Kingdom Travel Trends Increasing Repellent Product Demand
The United Kingdom holds approximately 14% of European market share and is forecast to expand at around 4.8% CAGR. British consumers have a high travel-health awareness driven by widespread international travel to tropical destinations, fueling demand for travel-segment repellents. The Health Security Agency (UKHSA) and NHS travel health programs regularly recommend repellent use for international travelers. Increasing tiger mosquito sightings in southern England, reported by Public Health England, are gradually shifting repellent use beyond a pure travel category into domestic protection expanding the addressable market.
- France Tropical Territories Boosting Repellent Product Adoption
France contributes approximately 13% of European revenues, with market growth projected at a CAGR of about 5.2%. France's market is notably shaped by its tropical overseas territories (Martinique, Guadeloupe, French Guiana, and Réunion), where mosquito-borne disease risk is elevated and government health agencies actively promote repellent use. Santé Publique France campaigns on dengue and chikungunya prevention have increased domestic consumer engagement with repellent brands. In mainland France, seasonal demand from outdoor tourism particularly in the Camargue and Mediterranean regions drives summer-season product uptake.
- Italy Mosquito Disease Cases Driving Repellent Consumption
Italy accounts for around 11% of European market revenues, growing at a CAGR of approximately 5.5%. Italy is one of the most mosquito-affected Western European countries due to the established presence of Aedes albopictus in densely populated northern and central regions. The Istituto Superiore di Sanità (ISS) has documented local dengue and chikungunya transmission events, prompting health authorities to issue population-wide repellent advisories. This domestic disease burden uncommon in Northern Europe gives Italy a structurally stronger year-round repellent market, with pharmacy channels accounting for a disproportionately large share of sales.
Asia Pacific Mosquito Repellents Trends
Asia Pacific is the dominant regional market, commanding approximately 38% of global revenues. The region's dominance is rooted in its outsized share of global mosquito-borne disease burden it accounts for the majority of worldwide dengue, malaria, and Japanese encephalitis cases combined with large population bases in tropical and subtropical climates. Countries including India, China, Indonesia, Thailand, and Vietnam represent massive consumer bases with rapidly growing middle-class segments increasing repellent spending.
The region also benefits from significant manufacturing cost advantages, with major chemical intermediates and formulation facilities concentrated in China and India. Rising e-commerce penetration particularly via Alibaba's platforms and India's Flipkart is rapidly expanding distribution reach into semi-urban and rural markets. Government initiatives, such as India's National Vector Borne Disease Control Programme (NVBDCP), simultaneously raise disease awareness and implicitly support repellent product adoption.
- China E-Commerce Expansion Accelerating Premium Repellent Sales
China contributes approximately 18% of Asia Pacific market revenues and is expanding at a CAGR of around 7.0%. China is simultaneously the world's largest repellent consumer market by volume and a dominant global supplier of active ingredient intermediates. Domestic giants such as Zhongshan Kaili Health Products and Sawyer Products's distribution arms operate across China's vast tier-1 to tier-4 city spectrum.
The Chinese government's investments in mosquito surveillance and control under national public health frameworks, alongside rising consumer interest in premium personal care, are driving premiumization of repellent products. Online platforms like JD.com and Tmall are primary growth vectors for direct-to-consumer repellent sales.
- India Herbal Innovations Driving Rapid Repellent Market Growth
India holds roughly 15% of Asia Pacific revenues, with the Indian mosquito repellents market projected to grow at a CAGR of approximately 8.0% one of the fastest rates globally. India's structural demand drivers are compelling: it records the world's highest dengue caseloads and remains one of the most malaria-affected countries in Asia. Godrej Consumer Products Limited (GCPL)'s Good Knight and Reckitt's Mortein command dominant market positions in coils and vaporizers. India's thriving Herbal Protection Solutions segment anchored by ayurvedic brands marketing neem, tulsi, and citronella formulations uniquely positions the country as a bellwether for global natural repellent innovation.
- South Korea Premium Skincare Repellents Gaining Consumer Preference
South Korea accounts for nearly 5% of Asia Pacific mosquito repellents market revenue and is projected to expand at a CAGR of approximately 6.8% during the forecast period. The country represents a highly premiumized and innovation-driven market, where consumers strongly prefer skin-safe, fragrance-enhanced, and dermatologically approved repellent formulations. South Korea’s globally recognized K-beauty and personal care industry has significantly influenced mosquito repellent product development, resulting in multifunctional offerings that combine skincare benefits with insect protection.
Consumer preference for DEET-free and gentle formulations remains particularly strong, encouraging manufacturers to introduce repellents integrated into moisturizers, sunscreen products, and cosmetic sprays. In addition, increasing public awareness regarding Japanese encephalitis and imported dengue infections has strengthened routine repellent usage among urban households. Strong retail penetration, advanced e-commerce platforms, and continuous product innovation are further supporting market expansion across the country.
Competitive Landscape
The global mosquito repellents market exhibits a moderately consolidated structure, with a handful of multinational corporations controlling significant volume and revenue shares, while a large number of regional and local players compete vigorously in fragmented sub-segments. Leading firms including SC Johnson, Reckitt Benckiser, and Godrej Consumer Products leverage extensive distribution networks, strong brand equity, and large R&D budgets to maintain competitive advantage. Key strategies include geographic expansion into untapped rural and semi-urban markets, M&A activity to acquire specialty natural repellent brands, and continuous product line extensions into premium and smart device segments. Sustainability claims and clinical efficacy certifications are becoming critical differentiators as consumer and regulatory expectations converge.
Key Developments:
- In February 2026, OFF! partnered with Major League Fishing as the official mosquito and tick repellent sponsor for the 2026 season. The collaboration introduced the new OFF!® Deep Woods® MAX Aerosol, featuring picaridin-based protection designed for outdoor enthusiasts and anglers.
- In January 2025, Reckitt Benckiser expanded its Mortein mosquito repellent portfolio across Southeast Asia by launching aerosol sprays formulated with natural botanical actives, targeting rising consumer demand for eco-friendly repellents in Indonesia and Vietnam.
- In August 2024, Godrej Consumer Products Limited introduced a premium Good Knight Smart Vaporizer in India featuring app-based refill alerts and auto-shutoff technology, strengthening its connected home mosquito protection portfolio for urban consumers.
- In March 2024, SC Johnson expanded its OFF! Botanicals range with new plant-based spray formulations across major retailers in the United States and Canada, addressing growing consumer preference for DEET-free mosquito repellent alternatives.
- In June 2022, AkzoNobel launched a mosquito-repellent coating under its Coral brand in Brazil. The transparent varnish utilized permethrin technology to combat Aedes aegypti mosquitoes associated with dengue, Zika, and chikungunya transmission.
Global Mosquito Repellents Market – Key Insights & Details
| Key Insights | Details |
|---|---|
|
Historical Market Value (2020) |
US$ 5.8 Bn |
|
Current Market Value (2026) |
US$ 7.9 Bn |
|
Projected Market Value (2033) |
US$ 12.1 Bn |
|
CAGR (2026–2033) |
6.2% |
|
Leading Region |
Asia Pacific, ~38% share |
|
Dominant Segment |
Spray (Product Type), ~32% |
|
Top-ranking Segment |
Chemically Derived Repellents (Raw Material), ~61% |
|
Incremental Opportunity (2033 minus 2026) |
US$ 4.2 Bn |
Companies Covered in Mosquito Repellents Market
- SC Johnson & Son, Inc.
- Reckitt Benckiser Group plc
- Godrej Consumer Products Limited
- Spectrum Brands Holdings, Inc.
- Sawyer Products, Inc.
- 3M Company
- Bayer AG
- Earth Chemical Co., Ltd.
Frequently Asked Questions
The global mosquito repellents market is valued at US$ 7.9 Bn in 2026 and is projected to reach US$ 12.1 Bn by 2033, expanding at a CAGR of 6.2%. The historical growth rate between 2020 and 2025 stood at 5.3% CAGR, reflecting consistent long-term demand expansion.
The primary demand drivers include the rising global burden of mosquito-borne diseases such as malaria, dengue, and Zika, which affect hundreds of millions annually. Additionally, growing health consciousness among consumers globally and regulatory endorsements from organizations such as the WHO and CDC are accelerating repellent adoption across all demographic groups.
Spray-based repellents represent the dominant product type segment with approximately 32% market share. Their widespread use is driven by ease of application, availability across multiple active ingredient formulations (DEET, picaridin, botanical), and strong brand recognition from leading manufacturers globally.
Asia Pacific is the leading region, accounting for approximately 38% of global revenues. The region's dominance is underpinned by its disproportionate share of global mosquito-borne disease incidence, large tropical populations, and increasing consumer spending in rapidly developing economies such as China, India, and Southeast Asian nations.
Key opportunities include the growing demand for DEET-Free and eco-friendly botanical formulations, the rapid adoption of Smart Vaporizer Devices with IoT connectivity, and the expansion of e-commerce distribution channels into semi-urban and rural markets in Asia Pacific and Africa. Regulatory frameworks increasingly supporting plant-based actives also unlock premium pricing and new consumer segments.
The leading companies in the global mosquito repellents market include SC Johnson & Son, Inc. (OFF!), Reckitt Benckiser Group plc (Mortein), Godrej Consumer Products Limited (Good Knight), Spectrum Brands Holdings, Bayer AG, 3M Company, and Earth Chemical Co., Ltd., among others. These players compete on product innovation, pricing, distribution depth, and regulatory compliance.


