


- Executive Summary
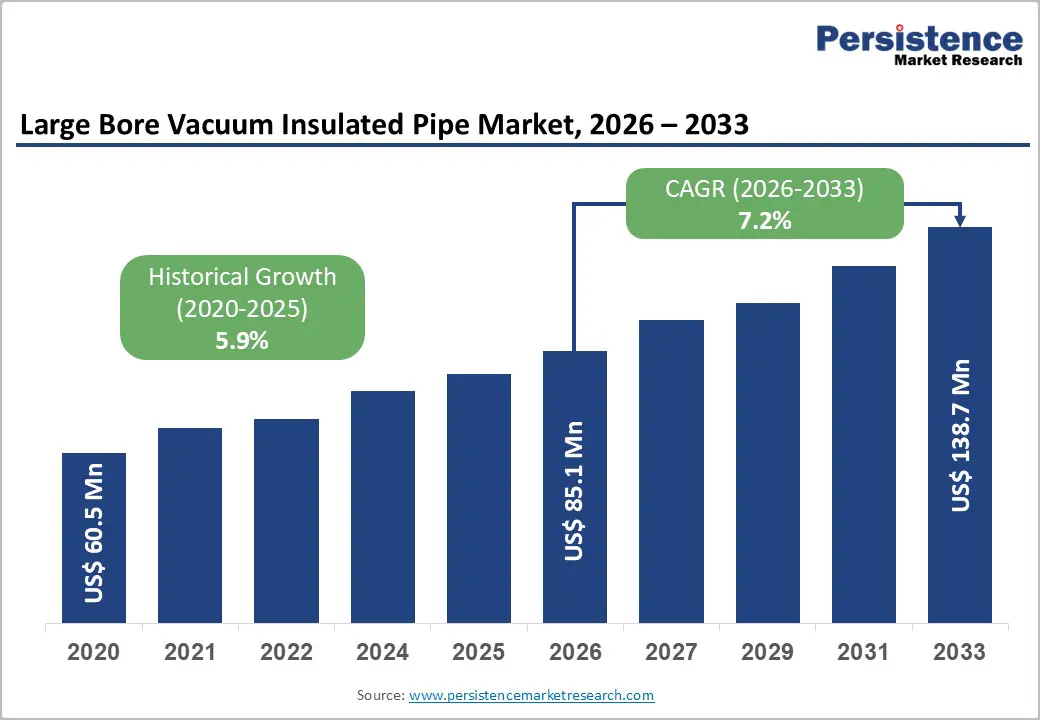
- Global Large Bore Vacuum Insulated Pipe Market Snapshot 2025 and 2033
- Market Opportunity Assessment, 2025-2033, US$ Mn
- Key Market Trends
- Industry Developments and Key Market Events
- Demand Side and Supply Side Analysis
- PMR Analysis and Recommendations
- Market Overview
- Market Scope and Definitions
- Value Chain Analysis
- Macro-Economic Factors
- Global GDP Outlook
- Global Large Bore VIP Demand by Region
- Global Large Bore VIP Demand by Application
- Global LNG & Hydrogen Infrastructure Overview
- Forecast Factors – Relevance and Impact
- COVID-19 Impact Assessment
- PESTLE Analysis
- Porter's Five Forces Analysis
- Geopolitical Tensions: Market Impact
- Regulatory and Technology Landscape
- Market Dynamics
- Drivers
- Restraints
- Opportunities
- Trends
- Price Trend Analysis, 2020 – 2033
- Region-wise Price Analysis
- Price by Segments
- Price Impact Factors
- Global Large Bore Vacuum Insulated Pipe Market Outlook:
- Key Highlights
- Global Large Bore Vacuum Insulated Pipe Market Outlook: Installation Type
- Introduction/Key Findings
- Historical Market Size (US$ Mn) and Volume (Meter) Analysis by Installation Type, 2020-2024
- Current Market Size (US$ Mn) and Volume (Meter) Analysis and Forecast, by Installation Type, 2025-2033
- Above Ground
- Underground
- Under Sea
- Market Attractiveness Analysis: Installation Type
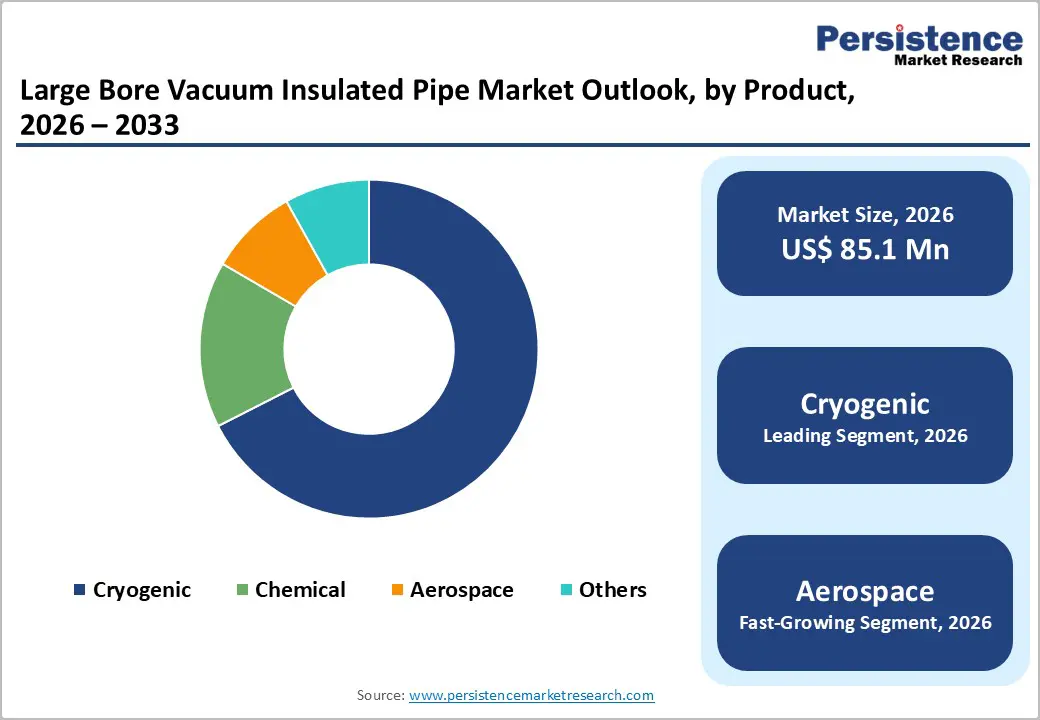
- Global Large Bore Vacuum Insulated Pipe Market Outlook: Application
- Introduction/Key Findings
- Historical Market Size (US$ Mn) and Volume (Meter) Analysis by Application, 2020-2024
- Current Market Size (US$ Mn) and Volume (Meter) Analysis and Forecast, by Application, 2025-2033
- Cryogenic
- Aerospace
- Chemical
- Others
- Market Attractiveness Analysis: Application
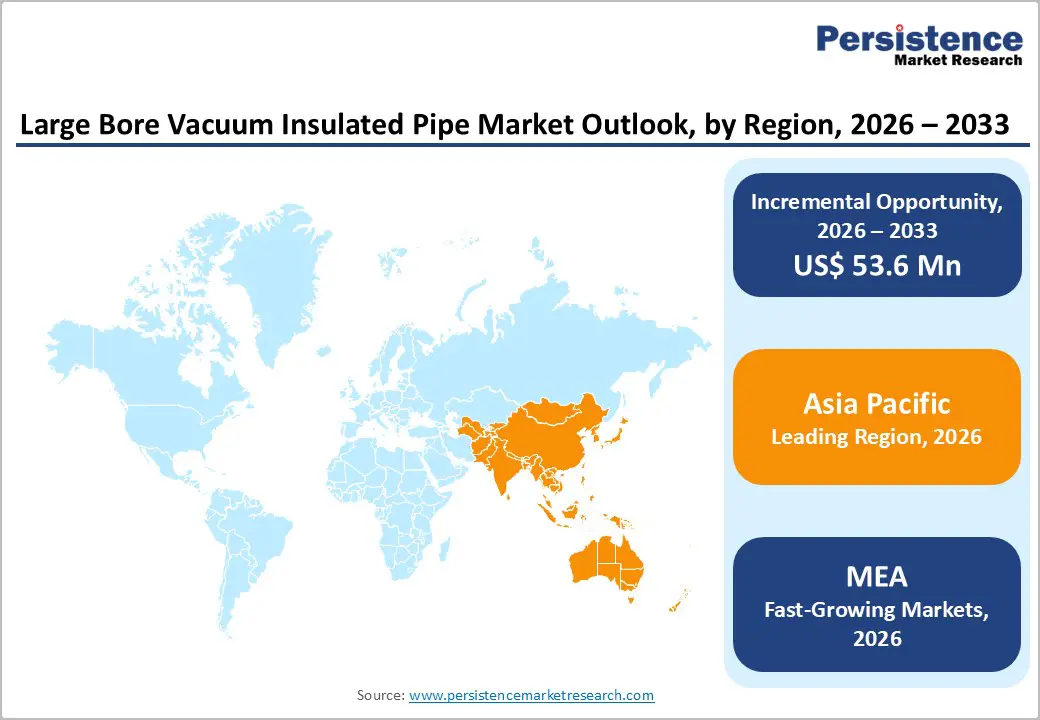
- Global Large Bore Vacuum Insulated Pipe Market Outlook: Region
- Key Highlights
- Historical Market Size (US$ Mn) and Volume (Meter) Analysis by Region, 2020-2024
- Current Market Size (US$ Mn) and Volume (Meter) Analysis and Forecast, by Region, 2025-2033
- North America
- Europe
- East Asia
- South Asia & Oceania
- Latin America
- Middle East & Africa
- Market Attractiveness Analysis: Region
- North America Large Bore Vacuum Insulated Pipe Market Outlook:
- Key Highlights
- Pricing Analysis
- North America Market Size (US$ Mn) and Volume (Meter) Analysis and Forecast, by Country, 2025-2033
- U.S.
- Canada
- North America Market Size (US$ Mn) and Volume (Meter) Analysis and Forecast, by Installation Type, 2025-2033
- Above Ground
- Underground
- Under Sea
- North America Market Size (US$ Mn) and Volume (Meter) Analysis and Forecast, by Application, 2025-2033
- Cryogenic
- Aerospace
- Chemical
- Others
- Europe Large Bore Vacuum Insulated Pipe Market Outlook:
- Key Highlights
- Pricing Analysis
- Europe Market Size (US$ Mn) and Volume (Meter) Analysis and Forecast, by Country, 2025-2033
- Germany
- Italy
- France
- U.K.
- Spain
- Russia
- Rest of Europe
- Europe Market Size (US$ Mn) and Volume (Meter) Analysis and Forecast, by Installation Type, 2025-2033
- Above Ground
- Underground
- Under Sea
- Europe Market Size (US$ Mn) and Volume (Meter) Analysis and Forecast, by Application, 2025-2033
- Cryogenic
- Aerospace
- Chemical
- Others
- East Asia Large Bore Vacuum Insulated Pipe Market Outlook:
- Key Highlights
- Pricing Analysis
- East Asia Market Size (US$ Mn) and Volume (Meter) Analysis and Forecast, by Country, 2025-2033
- China
- Japan
- South Korea
- East Asia Market Size (US$ Mn) and Volume (Meter) Analysis and Forecast, by Installation Type, 2025-2033
- Above Ground
- Underground
- Under Sea
- East Asia Market Size (US$ Mn) and Volume (Meter) Analysis and Forecast, by Application, 2025-2033
- Cryogenic
- Aerospace
- Chemical
- Others
- East Asia Market Size (US$ Mn) and Volume (Meter) Analysis and Forecast, by , 2025-2033
- South Asia & Oceania Large Bore Vacuum Insulated Pipe Market Outlook:
- Key Highlights
- Pricing Analysis
- South Asia & Oceania Market Size (US$ Mn) and Volume (Meter) Analysis and Forecast, by Country, 2025-2033
- India
- Southeast Asia
- ANZ
- Rest of SAO
- South Asia & Oceania Market Size (US$ Mn) and Volume (Meter) Analysis and Forecast, by Installation Type, 2025-2033
- Above Ground
- Underground
- Under Sea
- South Asia & Oceania Market Size (US$ Mn) and Volume (Meter) Analysis and Forecast, by Application, 2025-2033
- Cryogenic
- Aerospace
- Chemical
- Others
- Latin America Large Bore Vacuum Insulated Pipe Market Outlook:
- Key Highlights
- Pricing Analysis
- Latin America Market Size (US$ Mn) and Volume (Meter) Analysis and Forecast, by Country, 2025-2033
- Brazil
- Mexico
- Rest of LATAM
- Latin America Market Size (US$ Mn) and Volume (Meter) Analysis and Forecast, by Installation Type, 2025-2033
- Above Ground
- Underground
- Under Sea
- Latin America Market Size (US$ Mn) and Volume (Meter) Analysis and Forecast, by Application, 2025-2033
- Cryogenic
- Aerospace
- Chemical
- Others
- Middle East & Africa Large Bore Vacuum Insulated Pipe Market Outlook:
- Key Highlights
- Pricing Analysis
- Middle East & Africa Market Size (US$ Mn) and Volume (Meter) Analysis and Forecast, by Country, 2025-2033
- GCC Countries
- South Africa
- Northern Africa
- Rest of MEA
- Middle East & Africa Market Size (US$ Mn) and Volume (Meter) Analysis and Forecast, by Installation Type, 2025-2033
- Above Ground
- Underground
- Under Sea
- Middle East & Africa Market Size (US$ Mn) and Volume (Meter) Analysis and Forecast, by Application, 2025-2033
- Cryogenic
- Aerospace
- Chemical
- Others
- Competition Landscape
- Market Share Analysis, 2024
- Market Structure
- Competition Intensity Mapping
- Competition Dashboard
- Company Profiles
- Chart Industries
- Company Overview
- Product Portfolio/Offerings
- Key Financials
- SWOT Analysis
- Company Strategy and Key Developments
- Air Products and Chemicals
- Parker-Hannifin
- Flowserve
- Linde
- Air Liquide
- Nikkiso
- Demaco
- Cryofab
- Inox Group
- Emerson Electric
- HEROSE GmbH
- Fives Group
- Wessington Cryogenics
- Sulzer
- Chart Industries
- Appendix
- Research Methodology
- Research Assumptions
- Acronyms and Abbreviations

Loading page data
Please wait a moment


