


- Electrical Equipment & Services
- In-Line Transit Time Ultrasonic Flow Meter Market
In-Line Transit Time Ultrasonic Flow Meter Market Size, Trends, Share, and Growth Forecast, 2026 - 2033
In-Line Transit Time Ultrasonic Flow Meter Market by Technology (Single/Dual Path and Multi Path), by Application (Liquid Flow Measurement and Gas Flow Measurement), by End-User (Oil & Gas, Power Generation, Chemicals, and Others (Water & Wastewater, Food & Beverages) and Regional Analysis for 2026 - 2033
In-Line Transit Time Ultrasonic Flow Meter Market Size and Trends Analysis
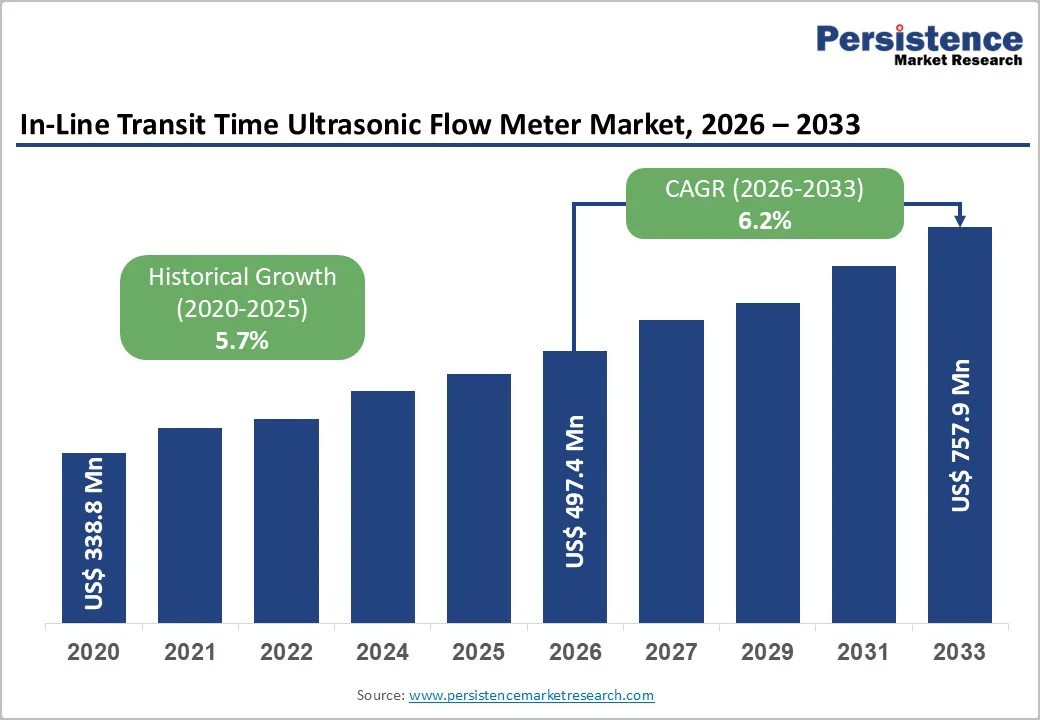
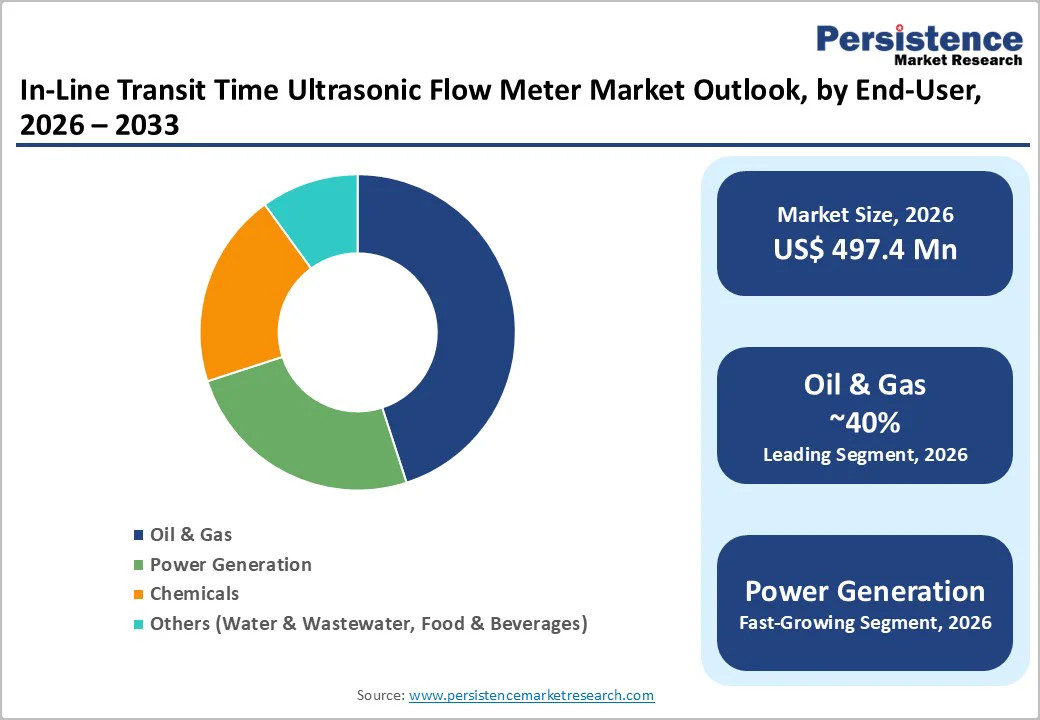
The global in-line transit time ultrasonic flow meter market size is likely to be valued at US$ 497.4 million in 2026 and is projected to reach US$ 757.9 million by 2033, growing at a CAGR of 6.2% between 2026 and 2033.
Growth is driven by increasing demand for non-invasive, accurate flow measurement across oil & gas, power generation, and water infrastructure, integration with IoT and advanced diagnostics, and the emphasis on energy efficiency and regulatory compliance.
Key Industry Highlights:
- Technology segmentation: Single/dual-path systems dominate at 65% share (US$ 323 million 2026), while multi-path systems are fastest-growing at 9.52% CAGR, driven by custody transfer requirements and hydrogen measurement.
- Application mix: Liquid flow measurement leads at 59.6% share (US$ 296 million), while gas flow measurement is the fastest growing at 9% CAGR, supported by hydrogen infrastructure and renewable energy integration.
- End-use dynamics: Oil & gas represents 40% share (US$ 198 million 2026), while power generation is fastest growing at 10% CAGR, driven by renewable capacity expansion and thermal plant modernization.
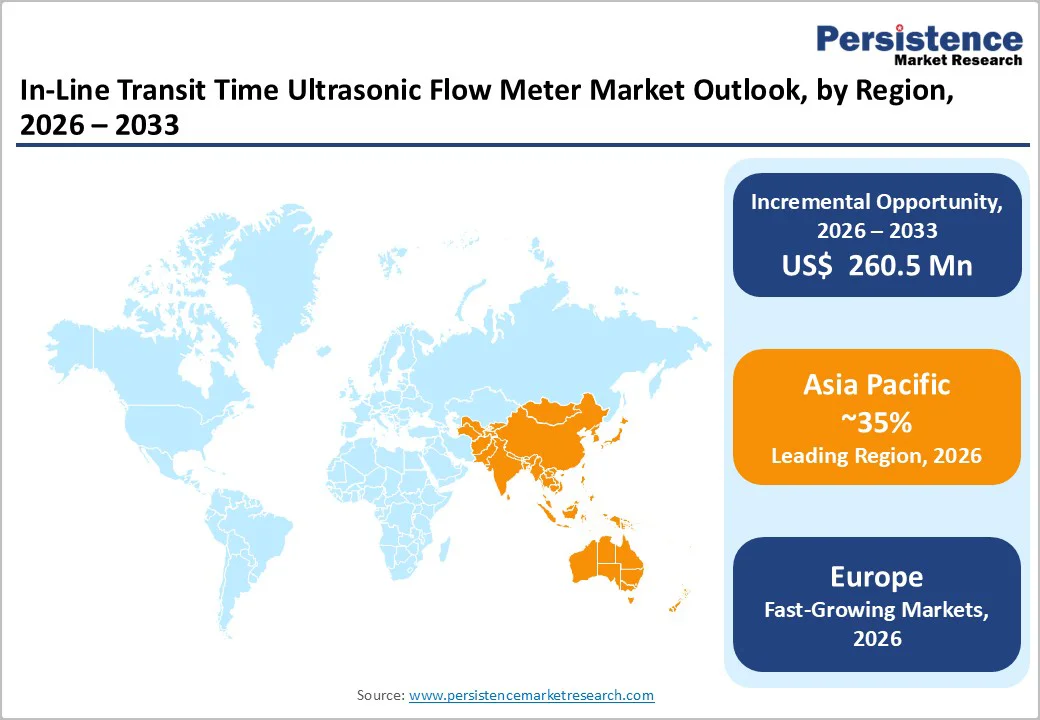
- Regional performance: Asia Pacific exhibits fastest growth at 7.0% CAGR (US$ 189 million 2026 → US$ 330 million 2033); North America shows mature market characteristics Europe balances stability with hydrogen infrastructure opportunity.
- Strategic consolidation and partnerships: SICK-Endress+Hauser strategic partnership completion (January 2025) combined gas analysis/flow measurement expertise under unified platform; major suppliers launched hydrogen-compatible and IoT-integrated ultrasonic systems (2024 - 2025); ongoing platform consolidation reflects industry shift toward comprehensive instrumentation solutions.
| Key Insights | Details |
|---|---|
| In-Line Transit Time Ultrasonic Flow Meter Market Size (2026E) | US$ 497.4 Mn |
| Market Value Forecast (2033F) | US$ 757.9 Mn |
| Projected Growth (CAGR 2026 to 2033) | 6.2% |
| Historical Market Growth (CAGR 2020 to 2024) | 5.7% |
Market Dynamics
Drivers - Regulatory Requirements for Custody Transfer, Emissions Monitoring, and Energy Efficiency
Regulatory mandates globally, including EPA emissions monitoring, EU energy efficiency directives, and national carbon accounting standards, require accurate, auditable flow measurement across oil & gas pipelines, power plants, and chemical processing facilities. Custody transfer in the oil & gas industry alone demands uncertainty specifications of ±0.5% or better, directly favoring ultrasonic systems that meet or exceed these thresholds.
The U.S. EPA's emissions monitoring requirements and the EU's commitment to decarbonization drive investments in precise thermal energy metering and carbon accounting systems. Regulatory pressure is estimated to support an incremental market value of US$ 90 million annually across the forecast period, creating non-discretionary purchasing drivers independent of cyclical economic conditions.
Machine Learning and In-Situ Validation: Reducing Operational Complexity
Advanced ultrasonic systems now integrate machine-learning-driven profile correction, in-situ self-verification algorithms, and automated diagnostic capabilities, achieving ±0.5% accuracy under variable temperature regimes and reducing dependency on manual proving and recalibration. Eight-path ultrasonic models with dynamic path weighting eliminate costly quarterly prover campaigns, reducing operational overhead by 40-60% while simultaneously improving uptime and measurement confidence.
Smart integration with SCADA systems, cloud-based analytics, and predictive maintenance platforms enables utilities and operators to optimize asset life, anticipate failures, and reduce unscheduled downtime. This technology-driven value proposition supports premium positioning for advanced ultrasonic systems, sustaining revenue growth even in mature markets experiencing price deflation.
Restraints - High Capital Equipment Costs and Extended Installation Timelines
Transit-time ultrasonic flow meters represent significant capex investments, with in-line systems priced between US$ 2,000-8,000 per unit, plus installation, calibration, and integration expenses adding 30-50% to total cost of ownership. For small municipalities and price-sensitive industrial operators, this investment barrier delays adoption and extends procurement cycles. Additionally, installation complexity particularly for multi-path systems requiring specific upstream piping configurations, precise transducer alignment (±2 mm tolerance), and flow profile stabilization, necessitates specialized expertise and extended commissioning timelines (2-8 weeks typical). In emerging markets lacking technical expertise and capital availability, these barriers meaningfully constrain near-term adoption despite strong long-term fundamentals.
Competitive Pressure from Emerging Technologies and Mechanical Alternatives
While ultrasonic technology dominates new installations, mechanical flow meters (orifice plates, turbine meters, positive displacement devices) remain entrenched across existing infrastructure, with lower upfront capex and established service networks providing competitive advantages for replacement cycles. Additionally, digital pressure differential (DP) transmitter technology offers 50-60% lower capex relative to ultrasonic systems in low-accuracy applications where ±2-5% uncertainty is acceptable. Doppler ultrasonic technology, while less accurate, provides 30-40% cost savings and tolerates flow profile variations better than transit-time systems, attracting cost-conscious customers. These competing technologies constrain market expansion and pressure pricing in price-sensitive segments.
Opportunity - Smart Water Metering and District Heating Infrastructure Modernization
Municipal water utilities globally are deploying smart metering infrastructure to reduce non-revenue water (NRW) losses currently averaging 35% in many developing markets. Ultrasonic flow meters are central to real-time leak detection, water quality monitoring, and demand-side management, creating a US$ 48 million annual opportunity for ultrasonic suppliers targeting municipal water and wastewater segments. Similarly, district heating and cooling infrastructure modernization in Europe (targeting net-zero emissions by 2050) requires precise thermal energy metering for building-level billing, grid optimization, and renewable energy integration. This segment is estimated at US$ 38 million annually and growing at 7.5% CAGR, driven by EU directives and national climate commitments.
Power Generation and Renewable Energy Thermal Management
Thermal power generation (coal, gas, nuclear) requires precise cooling water flow measurement for generator efficiency, heat exchange optimization, and emissions compliance. Renewable energy infrastructure (concentrating solar power, geothermal, district heating) demands ultra-precise thermal energy measurement for performance monitoring, revenue accounting, and operational optimization. These segments collectively represent an estimated US$ 50 million annual opportunity growing at 6% CAGR, supported by global energy transition investments exceeding US$ 2 trillion annually. Suppliers offering hydrogen-compatible systems, integrated renewable energy monitoring solutions, and cloud-based analytics platforms can capture disproportionate share within this high-growth segment.
Category-wise Analysis
Technology Path Configuration Insights
Single and dual-path transit-time ultrasonic flow meters dominate with around 65% market share and a market value of US$ 323 million in 2026. These systems offer cost-effective performance with ±1-2% accuracy, making them suitable for general industrial and utility applications where extreme precision is unnecessary. Dual-path setups provide better flow profile compensation at a moderate price point.
Multi-path systems (3-8 paths) are the fastest-growing segment, expanding at about 9.5% CAGR. Their high accuracy (±0.15-0.50%), bidirectional capability, and compliance with strict custody-transfer standards drive adoption in oil & gas and hydrogen measurement. Valued at US$ 174 million in 2026, this segment is projected to reach US$ 280 million by 2033.
Application Type Insights
Liquid flow measurement is the largest application segment, holding 59.6% share and valued at approximately US$ 296 million in 2026. Its dominance stems from extensive use in oil & gas custody transfer, chemical processing, and water utilities, where accurate measurement is essential and mandated. Liquids provide stable acoustic conditions, enabling higher accuracy and reduced turbulence effects. The segment is expected to grow steadily at 5% CAGR through 2033, driven by regulatory compliance and ongoing infrastructure maintenance.
Gas flow measurement, including natural gas, hydrogen, LNG, and industrial gases, is the fastest-growing segment at around 8% CAGR, reaching US$ 201 million in 2026. Growth is fueled by hydrogen blending, clean energy transition, and expanding LNG trade. Gas applications require advanced compensation and multi-path systems, supporting higher pricing and margins.
Application Insights
Oil and gas applications including pipeline custody transfer, LNG terminals, processing facilities, and E&P operations constitute the largest segment with 40% market share, valued at roughly US$ 200 million in 2026. This leadership is driven by stringent custody transfer regulations, high financial stakes in flow accuracy, and the vast installed global infrastructure. The segment is expected to grow at around 5% CAGR through 2033, supported by hydrogen blending initiatives, offshore modernization, and increasing integration of alternative energy systems.
Power generation is the fastest-growing end-use segment, projected at an 8% CAGR. Covering thermal, nuclear, hydro, geothermal, and CSP facilities, it is valued at about US$ 99 million in 2026 and set to reach US$ 155 million by 2033. Growth is fueled by global renewable energy expansion, thermal plant upgrades, and rising demand for precise cooling water and thermal energy monitoring.
Regional Market Insights
North America In-Line Transit Time Ultrasonic Flow Meter Market Trends
North America represents an estimated US$ 149 million market (2026) with projected growth to US$ 210 million by 2033, reflecting 3.5% CAGR-below global baseline, reflecting market maturity but stable underlying demand. The U.S. dominates regional demand, driven by mature oil & gas infrastructure, regulatory compliance requirements, and smart water initiatives. North America's regulatory environment emphasizes EPA emissions monitoring, NIST traceability standards, and AGA (American Gas Association) custody transfer requirements.
U.S. power generation is undergoing modernization with 15-20% coal fleet retirement and rapid renewable energy deployment (solar, wind projected at 50%+ by 2035). This transition drives demand for precision flow measurement in geothermal, CSP, and district heating systems. The competitive landscape features global leaders (Siemens, Emerson, Endress+Hauser, Yokogawa) with strong established relationships, alongside regional specialists and OEM-integrated solutions.
Europe In-Line Transit Time Ultrasonic Flow Meter Market Trends
Europe represents an estimated US$ 159 million market (2026) with projected growth to US$ 240 million by 2033, reflecting 4.5% CAGR. Germany, France, and the U.K. lead European demand, driven by strict EU energy efficiency directives, carbon accounting mandates, and district heating modernization.
The regulatory environment is characterized by EU Energy Efficiency Directive (EED) compliance, GDPR data protection, and ISO 4217 measurement standards. Germany's Energiewende (energy transition) prioritizes renewable energy integration and district heating expansion, requiring precision thermal energy metering at scale. The U.K. is pursuing "heat networks" development targeting decarbonization of heating systems, creating embedded demand for ultrasonic thermal energy metering.
Asia Pacific In-Line Transit Time Ultrasonic Flow Meter Market Trends
Asia Pacific represents an estimated US$ 195 million market (2026) with projected growth to US$ 320 million by 2033, reflecting 6.5% CAGR highest among global regions. China dominates regional demand with approximately US$ 65 million market (2026) and 8% projected CAGR, driven by rapid industrialization, smart city initiatives, and water infrastructure modernization.
China's investment in district heating system upgrades, LNG infrastructure, and renewable energy integration creates substantial demand for precision ultrasonic flow metering. India and Southeast Asian markets represent high-growth emerging opportunities with 10% CAGR driven by infrastructure development, urbanization, and industrial manufacturing expansion.
Competitive Landscape
The global in-line transit time ultrasonic flow meter market is moderately concentrated, with global leaders (Siemens, Emerson, Endress+Hauser, Yokogawa, KROHNE, Honeywell) commanding approximately 50% of global revenues. The market supports meaningful participation from regional specialists and niche providers focusing on specific applications (custody transfer, hydrogen, geothermal) or geographic markets.
Barriers to entry include substantial R&D investment, OEM certification processes, and established utility relationships, but are not prohibitively high for specialized competitors offering application-specific solutions or regional advantages.
Key Industry Developments:
- In April 2025, Emerson unveiled the Flexim FLUXUS/PIOX 731 clamp-on series featuring modular hardware that trims assembly time by 20% and integrates Advanced Meter Verification for wet-gas compensation.
- In March 2025, KROHNE demonstrated small-volume prover verification, achieving API-compliant repeatability for gasoline custody transfer, enabled by high-speed PLC signal processing.
- In March 2025, Flonidan secured a contract to supply 600,000 ultrasonic SciFlo residential gas meters to Enexis Netbeheer for 2025 - 2028 rollout, expanding smart metering in the Netherlands.
Companies Covered in In-Line Transit Time Ultrasonic Flow Meter Market
- Emerson Electric Co
- KROHNE Group
- Pietro Fiorentini S.p.A.
- SICK MAIHAK, Inc.
- Siemens AG
- Gruppo Antonini S.p.A. (M&T)
- Endress+Hauser Management AG
- Baker Hughes Company
- Elster Instromet (Honeywell)
- Danfoss
- Omega Engineering Inc.
- Transus Instruments
- RMG Messtechnik GmbH
- Others Key Players
Frequently Asked Questions
The In-Line Transit Time Ultrasonic Flow Meter market is estimated to be valued at US$ 497.4 Mn in 2026.
The primary demand driver is the shift toward non-intrusive, maintenance-free, and highly accurate flow measurement solutions across water, wastewater, oil & gas, and industrial processing sectors.
In 2026, the Asia Pacific region will dominate the market with an exceeding 35% revenue share in the global In-Line Transit Time Ultrasonic Flow Meter market.
Among the Applications, Oil & Gas holds the highest preference, capturing beyond 40% of the market revenue share in 2026, surpassing other End- use type.
The key players in In-Line Transit Time Ultrasonic Flow Meter are Emerson Electric Co, KROHNE Group, Pietro Fiorentini S.p.A., SICK MAIHAK, Inc., and Siemens AG


