


- Executive Summary
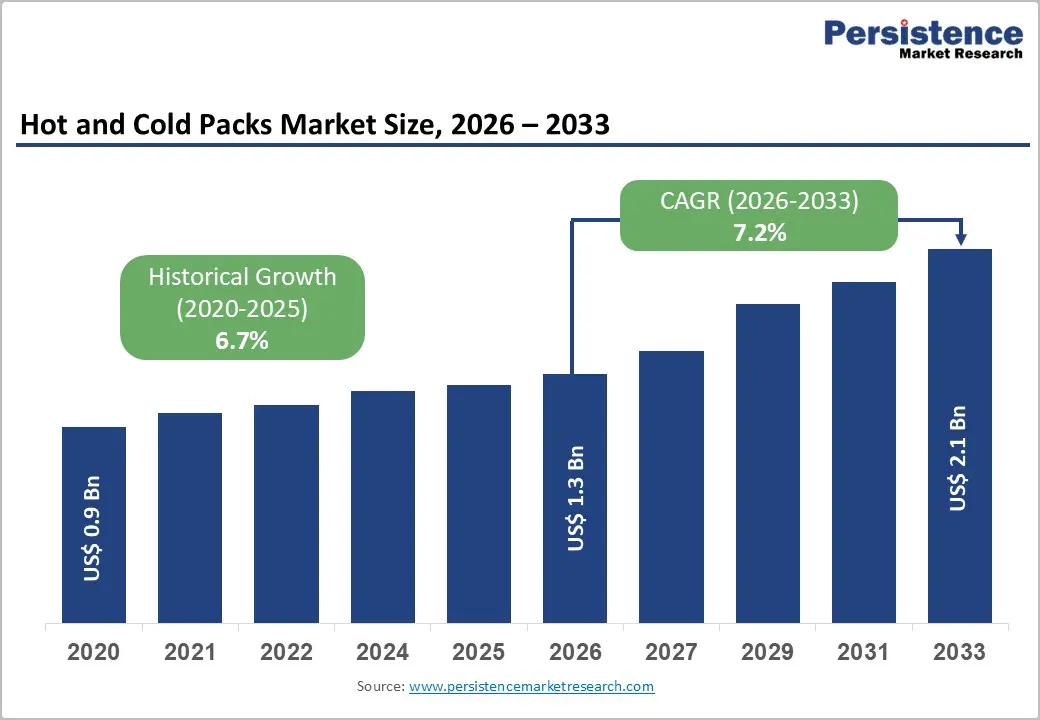
- Global Hot and Cold Packs Market Snapshot 2026 and 2033
- Market Opportunity Assessment, 2026-2033, US$ Bn
- Key Market Trends
- Industry Developments and Key Market Events
- Demand Side and Supply Side Analysis
- PMR Analysis and Recommendations
- Market Overview
- Market Scope and Definitions
- Market Dynamics
- Driver
- Restraint
- Opportunities
- Trends
- Macro-Economic Factors
- Global GDP Outlook
- Global Prison Growth Outlook
- Global Crime Rates by Country
- Global Prison Population by Country
- Global Private Prison Market Growth Outlook
- Other Macro-economic Factors
- Forecast Factors – Relevance and Impact
- COVID-19 Impact Assessment
- Value Added Insights
- Value Chain analysis
- Key Market Players
- Product Adoption Analysis
- Key Promotional Strategies by key players
- PESTLE Analysis
- Porter's Five Forces Analysis
- Regulatory and Technology Landscape
- Price Trend Analysis, 2025
- Region-wise Price Analysis
- Price by Segments
- Price Impact Factors
- Global Hot and Cold Packs Market Outlook: Historical (2020 – 2025) and Forecast (2026 – 2033)
- Key Highlights
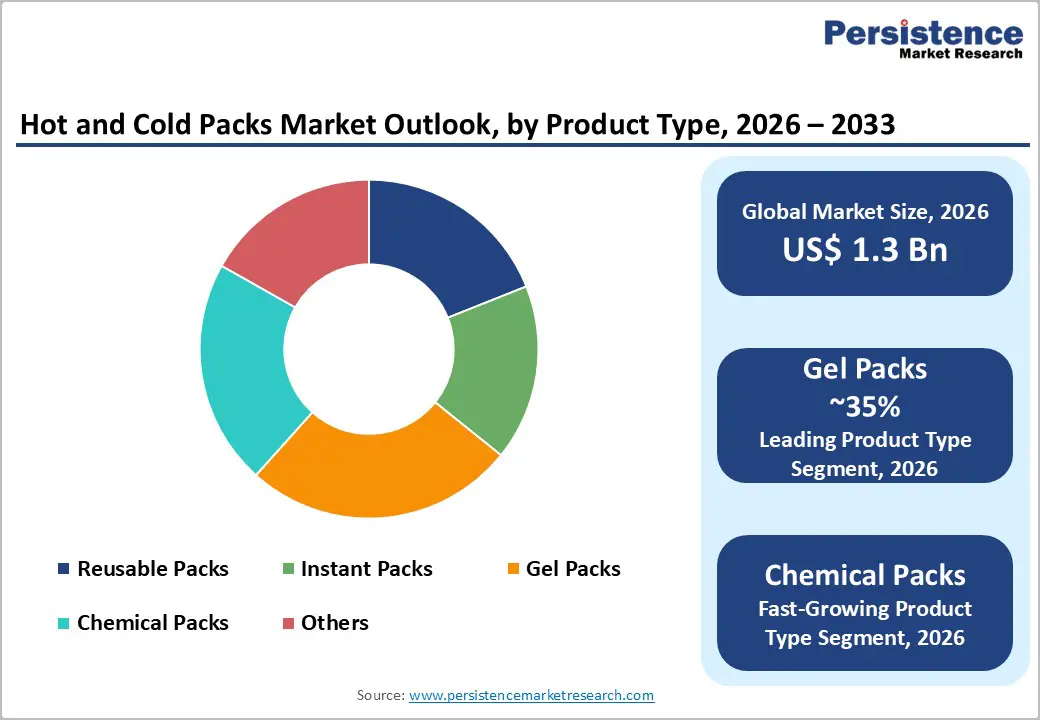
- Global Hot and Cold Packs Market Outlook: Product Type
- Introduction/Key Findings
- Historical Market Size (US$ Bn) and Volume (Units) Analysis by Product Type, 2020-2025
- Current Market Size (US$ Bn) and Volume (Units) Forecast, by Product Type, 2026-2033
- Reusable Packs
- Instant Packs
- Gel Packs
- Chemical Packs
- Others
- Market Attractiveness Analysis: Product Type
- Global Hot and Cold Packs Market Outlook: Application
- Introduction/Key Findings
- Historical Market Size (US$ Bn) and Volume (Units) Analysis by Application, 2020-2025
- Current Market Size (US$ Bn) and Volume (Units) Forecast, by Application, 2026-2033
- Pain Management
- Injury Treatment
- Post-Surgical Recovery
- Sports Medicine
- Others
- Market Attractiveness Analysis: Application
- Global Hot and Cold Packs Market Outlook: End-User
- Introduction/Key Findings
- Historical Market Size (US$ Bn) and Volume (Units) Analysis by End-User, 2020-2025
- Current Market Size (US$ Bn) and Volume (Units) Forecast, by End-User, 2026-2033
- Hospitals & Clinics
- Sports & Fitness Centers
- Home Care
- Others
- Market Attractiveness Analysis: End-User
- Global Hot and Cold Packs Market Outlook: Distribution Channel
- Introduction/Key Findings
- Historical Market Size (US$ Bn) and Volume (Units) Analysis by Distribution Channel, 2020-2025
- Current Market Size (US$ Bn) and Volume (Units) Forecast, by Distribution Channel, 2026-2033
- Pharmacies
- Online Stores
- Supermarkets/Hypermarkets
- Others
- Market Attractiveness Analysis: Distribution Channel
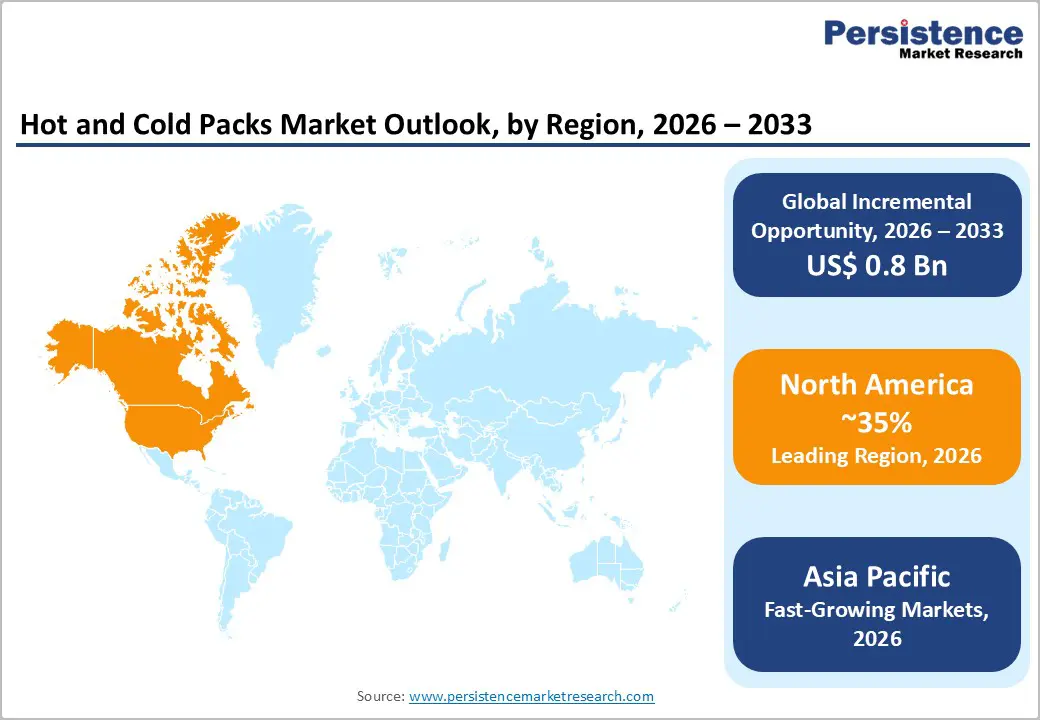
- Global Hot and Cold Packs Market Outlook: Region
- Key Highlights
- Historical Market Size (US$ Bn) and Volume (Units) Analysis by Region, 2020-2025
- Current Market Size (US$ Bn) and Volume (Units) Forecast, by Region, 2026-2033
- North America
- Europe
- East Asia
- South Asia & Oceania
- Latin America
- Middle East & Africa
- Market Attractiveness Analysis: Region
- North America Hot and Cold Packs Market Outlook: Historical (2020 – 2025) and Forecast (2026 – 2033)
- Key Highlights
- Pricing Analysis
- North America Market Size (US$ Bn) and Volume (Units) Forecast, by Country, 2026-2033
- U.S.
- Canada
- North America Market Size (US$ Bn) and Volume (Units) Forecast, by Product Type, 2026-2033
- Reusable Packs
- Instant Packs
- Gel Packs
- Chemical Packs
- Others
- North America Market Size (US$ Bn) and Volume (Units) Forecast, by Application, 2026-2033
- Pain Management
- Injury Treatment
- Post-Surgical Recovery
- Sports Medicine
- Others
- North America Market Size (US$ Bn) and Volume (Units) Forecast, by End-User, 2026-2033
- Hospitals & Clinics
- Sports & Fitness Centers
- Home Care
- Others
- North America Market Size (US$ Bn) and Volume (Units) Forecast, by Distribution Channel, 2026-2033
- Pharmacies
- Online Stores
- Supermarkets/Hypermarkets
- Others
- Europe Hot and Cold Packs Market Outlook: Historical (2020 – 2025) and Forecast (2026 – 2033)
- Key Highlights
- Pricing Analysis
- Europe Market Size (US$ Bn) and Volume (Units) Forecast, by Country, 2026-2033
- Germany
- Italy
- France
- U.K.
- Spain
- Russia
- Rest of Europe
- Europe Market Size (US$ Bn) and Volume (Units) Forecast, by Product Type, 2026-2033
- Reusable Packs
- Instant Packs
- Gel Packs
- Chemical Packs
- Others
- Europe Market Size (US$ Bn) and Volume (Units) Forecast, by Application, 2026-2033
- Pain Management
- Injury Treatment
- Post-Surgical Recovery
- Sports Medicine
- Others
- Europe Market Size (US$ Bn) and Volume (Units) Forecast, by End-User, 2026-2033
- Hospitals & Clinics
- Sports & Fitness Centers
- Home Care
- Others
- Europe Market Size (US$ Bn) and Volume (Units) Forecast, by Distribution Channel, 2026-2033
- Pharmacies
- Online Stores
- Supermarkets/Hypermarkets
- Others
- East Asia Hot and Cold Packs Market Outlook: Historical (2020 – 2025) and Forecast (2026 – 2033)
- Key Highlights
- Pricing Analysis
- East Asia Market Size (US$ Bn) and Volume (Units) Forecast, by Country, 2026-2033
- China
- Japan
- South Korea
- East Asia Market Size (US$ Bn) and Volume (Units) Forecast, by Product Type, 2026-2033
- Reusable Packs
- Instant Packs
- Gel Packs
- Chemical Packs
- Others
- East Asia Market Size (US$ Bn) and Volume (Units) Forecast, by Application, 2026-2033
- Pain Management
- Injury Treatment
- Post-Surgical Recovery
- Sports Medicine
- Others
- East Asia Market Size (US$ Bn) and Volume (Units) Forecast, by End-User, 2026-2033
- Hospitals & Clinics
- Sports & Fitness Centers
- Home Care
- Others
- East Asia Market Size (US$ Bn) and Volume (Units) Forecast, by Distribution Channel, 2026-2033
- Pharmacies
- Online Stores
- Supermarkets/Hypermarkets
- Others
- South Asia & Oceania Hot and Cold Packs Market Outlook: Historical (2020 – 2025) and Forecast (2026 – 2033)
- Key Highlights
- Pricing Analysis
- South Asia & Oceania Market Size (US$ Bn) and Volume (Units) Forecast, by Country, 2026-2033
- India
- Southeast Asia
- ANZ
- Rest of SAO
- South Asia & Oceania Market Size (US$ Bn) and Volume (Units) Forecast, by Product Type, 2026-2033
- Reusable Packs
- Instant Packs
- Gel Packs
- Chemical Packs
- Others
- South Asia & Oceania Market Size (US$ Bn) and Volume (Units) Forecast, by Application, 2026-2033
- Pain Management
- Injury Treatment
- Post-Surgical Recovery
- Sports Medicine
- Others
- South Asia & Oceania Market Size (US$ Bn) and Volume (Units) Forecast, by End-User, 2026-2033
- Hospitals & Clinics
- Sports & Fitness Centers
- Home Care
- Others
- South Asia & Oceania Market Size (US$ Bn) and Volume (Units) Forecast, by Distribution Channel, 2026-2033
- Pharmacies
- Online Stores
- Supermarkets/Hypermarkets
- Others
- Latin America Hot and Cold Packs Market Outlook: Historical (2020 – 2025) and Forecast (2026 – 2033)
- Key Highlights
- Pricing Analysis
- Latin America Market Size (US$ Bn) and Volume (Units) Forecast, by Country, 2026-2033
- Brazil
- Mexico
- Rest of LATAM
- Latin America Market Size (US$ Bn) and Volume (Units) Forecast, by Product Type, 2026-2033
- Reusable Packs
- Instant Packs
- Gel Packs
- Chemical Packs
- Others
- Latin America Market Size (US$ Bn) and Volume (Units) Forecast, by Application, 2026-2033
- Pain Management
- Injury Treatment
- Post-Surgical Recovery
- Sports Medicine
- Others
- Latin America Market Size (US$ Bn) and Volume (Units) Forecast, by End-User, 2026-2033
- Hospitals & Clinics
- Sports & Fitness Centers
- Home Care
- Others
- Latin America Market Size (US$ Bn) and Volume (Units) Forecast, by Distribution Channel, 2026-2033
- Pharmacies
- Online Stores
- Supermarkets/Hypermarkets
- Others
- Middle East & Africa Hot and Cold Packs Market Outlook: Historical (2020 – 2025) and Forecast (2026 – 2033)
- Key Highlights
- Pricing Analysis
- Middle East & Africa Market Size (US$ Bn) and Volume (Units) Forecast, by Country, 2026-2033
- GCC Countries
- South Africa
- Northern Africa
- Rest of MEA
- Middle East & Africa Market Size (US$ Bn) and Volume (Units) Forecast, by Product Type, 2026-2033
- Reusable Packs
- Instant Packs
- Gel Packs
- Chemical Packs
- Others
- Middle East & Africa Market Size (US$ Bn) and Volume (Units) Forecast, by Application, 2026-2033
- Pain Management
- Injury Treatment
- Post-Surgical Recovery
- Sports Medicine
- Others
- Middle East & Africa Market Size (US$ Bn) and Volume (Units) Forecast, by End-User, 2026-2033
- Hospitals & Clinics
- Sports & Fitness Centers
- Home Care
- Others
- Middle East & Africa Market Size (US$ Bn) and Volume (Units) Forecast, by Distribution Channel, 2026-2033
- Pharmacies
- Online Stores
- Supermarkets/Hypermarkets
- Others
- Competition Landscape
- Market Share Analysis, 2025
- Market Structure
- Competition Intensity Mapping
- Competition Dashboard
- Company Profiles
- Motorola Solutions, Inc.
- Company Overview
- Product Portfolio/Offerings
- Key Financials
- SWOT Analysis
- Company Strategy and Key Developments
- Nokia Corporation
- Ericsson AB
- AT&T Inc.
- Verizon Communications Inc.
- Samsung Electronics Co., Ltd.
- Huawei Technologies Co., Ltd.
- Cisco Systems, Inc.
- General Dynamics Mission Systems
- Airbus Defence and Space
- L3Harris Technologies
- Qualcomm Technologies, Inc.
- Hytera Communications
- Sierra Wireless
- Sepura PLC
- Motorola Solutions, Inc.
- Appendix
- Research Methodology
- Research Assumptions
- Acronyms and Abbreviations

Loading page data
Please wait a moment


