


- Smart Packaging
- Freshness Monitoring Packaging Market
Freshness Monitoring Packaging Market Size, Share, and Growth Forecast, 2026 - 2033
Freshness Monitoring Packaging Market by Technology Type (Time-Temperature Indicators, RFID-Based Sensors, Others), Material Type (Plastic Films, Bio-Based Packaging, Others), Application, and Regional Analysis for 2026 - 2033
Freshness Monitoring Packaging Market Size and Trends Analysis
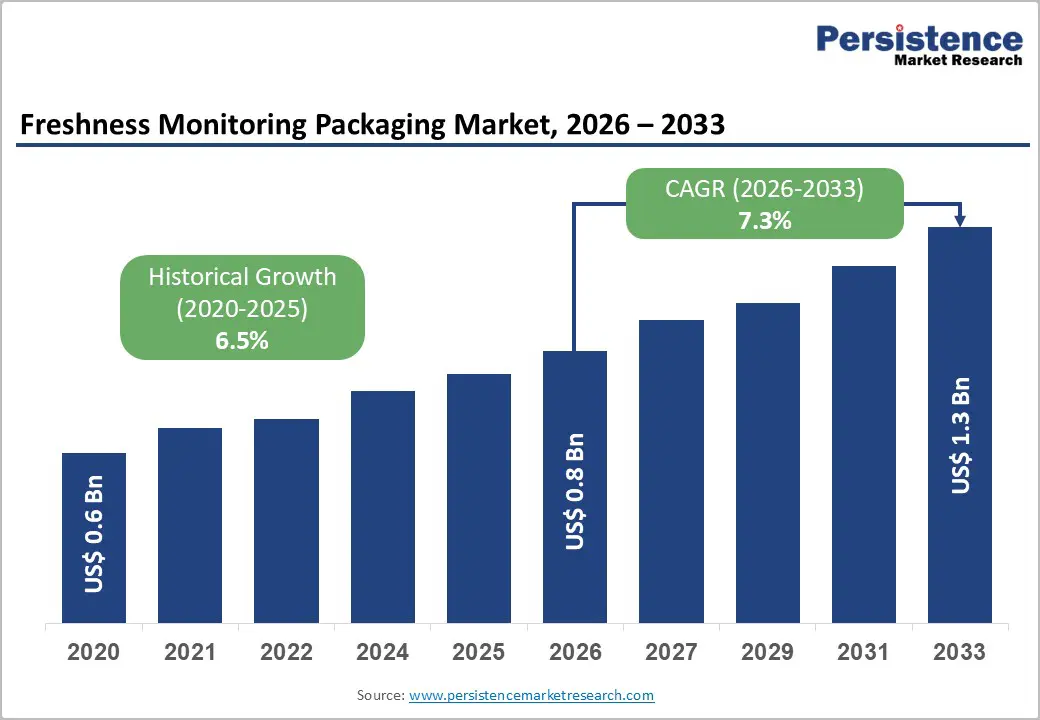
The global freshness monitoring packaging market size is likely to be valued at US$0.8 billion in 2026 and is expected to reach US$1.3 billion by 2033, growing at a CAGR of 7.3% between 2026 and 2033, driven by increasing cold-chain complexity, stricter food safety and waste reduction mandates, and accelerated adoption of IoT-enabled tracking systems across retail and logistics networks.
Growth is concentrated in packaged fresh produce and temperature-sensitive protein categories, where spoilage risk directly translates into financial losses. Adoption trends for smart labels and monitoring technologies indicate sustained mid-single- to high-single-digit growth momentum through the forecast period. Manufacturers are implementing layered monitoring strategies that combine low-cost irreversible time-temperature indicators (TTIs) for unit-level validation with RFID and IoT sensor systems for pallet and fleet-level visibility.
Key Industry Highlights:
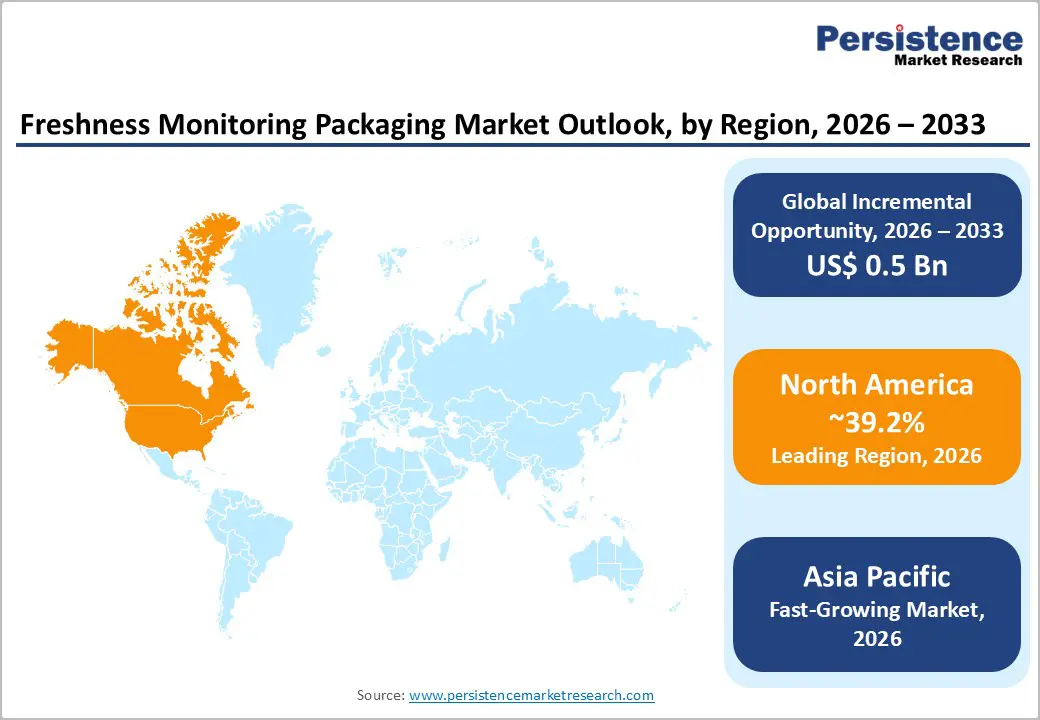
- Leading Region: North America is projected to lead the market with approximately 39.2% market share, driven by advanced cold-chain infrastructure, large-scale retail adoption, and early integration of IoT-enabled freshness monitoring across food and pharmaceutical supply chains.
- Fastest-Growing Region: Asia Pacific is the fastest-growing region, supported by the rapid expansion of modern retail, increasing cold-chain investments, and export-driven traceability requirements across China, Japan, India, and ASEAN economies.
- Investment Plans: Investment activity is concentrated in RFID-enabled freshness monitoring, cloud analytics platforms, and ERP-integrated cold-chain solutions, with capital increasingly directed toward vertically integrated offerings that combine sensors, data services, and predictive shelf-life modeling to reduce spoilage and shrinkage.
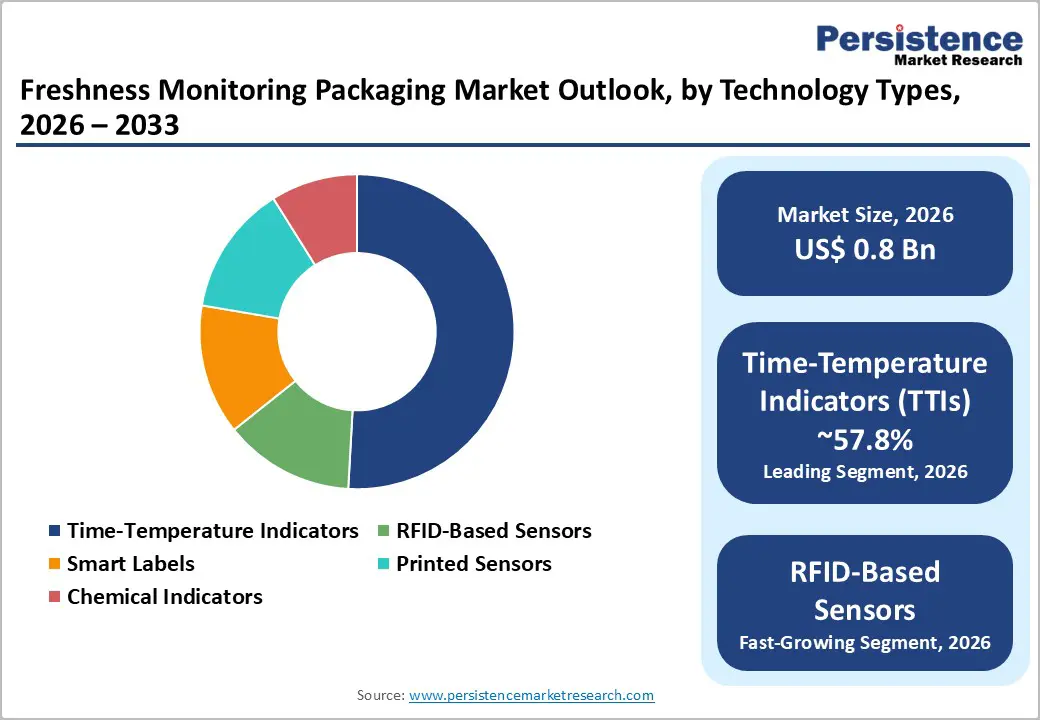
- Dominant Technology Type: Time-Temperature Indicators (TTIs) are estimated to dominate the technology landscape with approximately 57.8% market share, reflecting their low cost, ease of integration, and suitability for large-scale deployment in fresh produce, dairy, and pharmaceutical logistics.
- Leading Material Type: Plastic films remain the leading material type with around 36.9% market share, supported by strong barrier performance, compatibility with printed sensors and indicators, and established manufacturing scalability across flexible food packaging formats.
| Key Insights | Details |
|---|---|
| Freshness Monitoring Packaging Market Size (2026E) | US$0.8 Bn |
| Market Value Forecast (2033F) | US$1.3 Bn |
| Projected Growth (CAGR 2026 to 2033) | 7.3% |
| Historical Market Growth (CAGR 2020 to 2025) | 6.5% |
Market Factors - Growth, Barriers, and Opportunity Analysis
Growth Analysis - Rising Cold-Chain Complexity and the Economic Value of Spoilage Reduction
Globalization of fresh food trade and rapid expansion of temperature-sensitive distribution channels have significantly increased cumulative exposure risk across supply chains. Perishable goods now travel longer distances, pass through multiple distribution nodes, and experience variable storage environments. Even minor temperature deviations can reduce shelf life and increase shrink rates. Reducing spoilage delivers measurable financial benefits to producers, distributors, and retailers. Food waste studies consistently indicate that shrinkage and spoilage account for a meaningful percentage of revenue loss in fresh categories. Freshness monitoring technologies mitigate these risks by providing visual or digital evidence of temperature exposure. Purchasing decisions are increasingly ROI-driven rather than compliance-only. Companies evaluate solutions based on shrink reduction, extended shelf life, fewer recalls, and improved demand forecasting.
Regulatory and Standards Pressure for Traceability and Shelf-Life Accuracy
Food labeling regulations and safety frameworks emphasize accurate consumer information and documented temperature control. Regulatory agencies require evidence of safe handling and storage practices for temperature-sensitive goods. Retailer-driven compliance frameworks and traceability standards further reinforce demand for machine-readable freshness data. Traceability systems aligned with global supply chain standards enhance recall efficiency and reduce liability exposure. Freshness monitoring packaging provides defensible documentation of cold-chain integrity, particularly in meat, seafood, and dairy categories. Freshness sensors and indicators are transitioning from optional enhancements to expected quality-control tools in high-value product segments. Procurement teams factor regulatory compliance, recall cost avoidance, and brand protection into purchasing decisions.
Technology Convergence across Printed Electronics, IoT, and Data Analytics
Advances in printed electronics, NFC, RFID, low-power Bluetooth, and cloud analytics have reduced the cost and complexity of implementing smart packaging systems. Improved miniaturization and scalable manufacturing techniques enable integration of sensors directly into packaging substrates. Cloud-based analytics platforms convert raw temperature or chemical sensor data into actionable insights such as predictive shelf-life modeling and automated replenishment triggers. Falling tag and reader costs further support broader implementation. Vendors now offer tiered solution portfolios ranging from single-use chemical indicators to persistent RFID-enabled telemetry systems. This technological convergence expands the addressable market and allows customized deployments based on cost sensitivity and operational complexity.
Barrier Analysis - Cost and Unit Economics for Per-Unit Deployment
Smart labels and integrated sensors increase per-unit packaging costs. For low-margin product categories, even small cost increments can create adoption barriers. Many commodity food producers operate under tight margin constraints, limiting their willingness to implement technology without demonstrated ROI. Deployment typically begins with premium SKUs or high-risk perishables where spoilage costs justify higher packaging investment. Broad adoption across mass-market categories will depend on continued cost reductions, volume scaling, and standardized manufacturing processes.
Fragmented Standards and Data Integration Complexity
Multiple sensor chemistries, communication protocols, and backend data systems create interoperability challenges. Printed sensors, NFC, UHF RFID, and Bluetooth technologies each require different infrastructure components. Integration with existing ERP, warehouse management, and POS systems adds complexity. Retailers often face extended pilot timelines and integration budgets that can increase total deployment costs by 5-10% during early stages. Although industry standards aim to harmonize traceability frameworks, implementation remains uneven across regions and supply chains.
Opportunity Analysis - Scaling Fresh Produce Applications
Fresh produce accounts for the largest share of application demand due to high perishability and distributed sourcing networks. Implementing freshness monitoring at packhouse, transport, and retail stages can reduce post-harvest losses and optimize inventory rotation. Applying monitoring technologies to 10-15% of fresh produce supply chains in developed markets presents a substantial revenue opportunity within the 2026-2033 forecast window. Vendor-retailer partnerships focused on shrink reduction and dynamic pricing integration can accelerate adoption.
Expansion into Pharmaceutical and Biotech Cold Chains
Pharmaceutical and vaccine supply chains require rigorous documentation of temperature exposure. These verticals demonstrate a strong willingness to pay for accurate data loggers and persistent sensor systems. Entering healthcare cold chains provides higher average selling prices and recurring service revenues. Even limited-volume deployments can significantly increase vendor revenue due to premium pricing structures. Cross-vertical scalability enables companies to subsidize food-sector expansion with higher-margin pharmaceutical contracts.
Sustainability and Circular Packaging Integration
Sustainability mandates are influencing packaging procurement decisions. Integrating freshness monitoring into bio-based or recyclable materials supports retailer environmental goals while enhancing food waste reduction metrics. Premium sustainability lines can capture disproportionate growth within the existing plastic film segment, which currently holds 36.9% market share. Vendors that certify sensor compatibility with recycling streams and compostable substrates gain a competitive advantage in environmentally regulated markets.
Category-wise Analysis
Technology Type Insights
Time-temperature indicators are expected to account for approximately 57.8% of market share in 2026, reflecting their simplicity, cost-efficiency, and immediate visual interpretability. These irreversible indicators display cumulative thermal exposure over time, enabling frontline personnel to quickly assess product viability at receiving points, distribution centers, and retail shelves. Their widespread use across fresh produce, dairy, meat, and pharmaceutical shipments underscores their role as a baseline freshness assurance tool. TTIs integrate seamlessly into existing labeling and packaging workflows without requiring digital readers, connectivity, or backend software. This ease of implementation supports large-scale deployment in cost-sensitive categories where per-unit packaging costs must remain minimal. For example, exporters of berries and leafy greens frequently apply TTIs to cartons to validate cold-chain compliance during long-haul transport, while pharmaceutical distributors use them for last-mile temperature verification. Their low learning curve and proven reliability continue to reinforce adoption across high-volume perishables.
RFID-based freshness monitoring systems represent the fastest-growing technology segment, driven by expanding IoT integration across retail and logistics operations. These solutions combine product identification with environmental sensing, enabling automated data capture, real-time shelf-life modeling, and centralized analytics. Pallet- and case-level telemetry supports continuous monitoring without manual intervention, creating operational efficiencies across warehouses and stores. RFID sensors enable automated inventory rotation, expiry tracking, and exception alerts within warehouse management and point-of-sale systems. Large grocery chains and cold-chain logistics providers increasingly deploy RFID-enabled freshness tracking for seafood, meat, and high-value produce, where spoilage avoidance delivers measurable returns. Vendors are shifting toward bundled offerings that combine sensor hardware, cloud platforms, and subscription-based analytics, lowering upfront capital expenditure and accelerating adoption at scale.
Material Type Insights
Plastic films are projected to maintain a leading share of approximately 36.9% in 2026, supported by their superior barrier properties, durability, and compatibility with printed sensor integration. Flexible film structures allow efficient incorporation of colorimetric freshness indicators, TTIs, and thin printed electronic components without compromising package integrity or seal performance. Well-established global supply chains and scalable manufacturing processes further reinforce the dominance of plastic films. These materials are widely used in thermoformed trays, flow-wrap formats, and multilayer laminated packaging for fresh produce, meat, and dairy. For example, modified-atmosphere packaging for protein products often integrates freshness indicators directly into film layers to provide visible quality cues throughout distribution and retail handling.
Bio-based and compostable substrates are expected to represent the fastest-growing material segment, driven by retailer sustainability commitments and tightening regulations on conventional plastics. Packaging solutions that combine renewable materials with low-impact sensor chemistries, such as enzymatic or water-based printed indicators, are gaining traction in premium and private-label programs. While technical challenges remain, particularly around sensor stability, moisture sensitivity, and recycling compatibility, ongoing advances in printed electronics and bio-compatible inks continue to improve performance. Pilot programs in fresh produce and specialty food packaging demonstrate growing commercial readiness. Packaging converters that can certify recyclability or compostability while maintaining sensor accuracy are increasingly positioned to secure long-term supply agreements and access premium sustainability-driven procurement budgets.
Regional Market Insights
North America Freshness Monitoring Packaging Market Trends - Retail-Led IoT Integration and Cold-Chain Data Commercialization
North America is expected to account for approximately 39.2% of the market share in 2026, with the U.S. serving as the primary growth engine. High supermarket penetration, a highly developed refrigerated transportation network, and early adoption of smart labeling and IoT-enabled supply chain technologies underpin regional leadership. The presence of major retail chains such as Walmart, Kroger, and Costco accelerates pilot testing and large-scale rollout of temperature-monitoring and traceability solutions across fresh food categories.
The U.S. demonstrates strong uptake in fresh produce, seafood, and pharmaceutical logistics, where shrink reduction and compliance documentation provide measurable economic returns. For example, Walmart’s long-standing RFID adoption strategy in supply chain management has created a scalable infrastructure that supports the integration of smart labels and freshness sensors. Similarly, cold-chain monitoring firms such as Sensitech and Cold Chain Technologies have expanded digital visibility platforms for food and life sciences clients, reinforcing demand for sensor-enabled packaging. Canada mirrors U.S. adoption patterns, particularly in grocery retail and vaccine logistics, while Mexico’s growth aligns with export-driven produce supply chains serving U.S. retailers, especially in berries, avocados, and leafy greens.
Primary drivers include demand from large retail chains for shrink reduction, advanced IoT infrastructure, and regulatory compliance considerations tied to food safety documentation. The U.S. Food Safety Modernization Act has strengthened traceability expectations, indirectly supporting technologies that validate temperature integrity. Investment activity increasingly focuses on integrating freshness data into ERP, warehouse management, and point-of-sale systems to enable automated expiry management and dynamic pricing. Mergers and acquisitions in the region have targeted digital cold-chain analytics firms and sensor technology providers, enabling vertically integrated offerings that combine hardware, data loggers, and cloud-based monitoring services. These developments reinforce North America’s position as the most commercially mature market.
Europe Freshness Monitoring Packaging Market Trends - Regulation-Backed Traceability and Sustainable Smart Packaging Scale-up
Europe maintains a mature adoption landscape supported by harmonized food labeling regulations, strict traceability frameworks, and strong sustainability mandates. EU food information regulations and waste-reduction targets encourage retailers and producers to invest in technologies that enhance transparency and reduce spoilage. Germany and the U.K. lead in smart packaging pilots and digital traceability initiatives, while France and Spain leverage extensive fresh-produce export markets to justify cold-chain monitoring investments.
Retailers such as Tesco and Carrefour have implemented digital traceability and inventory optimization systems that create a supportive environment for freshness monitoring integration. In Germany and the Netherlands, research institutions, including Fraunhofer have collaborated with packaging converters to develop colorimetric spoilage sensors for meat and fish, demonstrating validated microbial detection capabilities. Government-supported R&D programs across the European Union accelerate printed electronics development and sustainable sensor integration.
Regulatory frameworks require substantiated performance data for any freshness-related claims, which favors established vendors with certified testing credentials and compliance documentation. Sustainability-driven procurement policies are particularly influential in Northern Europe, where retailers increasingly request recyclable or compostable smart packaging solutions. Cross-border consolidation among European label converters has enhanced technological capabilities, allowing companies to combine printed electronics, sensor chemistry, and sustainable substrate expertise within integrated product portfolios. This consolidation supports scalable deployments across multinational retail networks.
Asia Pacific Freshness Monitoring Packaging Market Trends - Cold-Chain Infrastructure Expansion and E-Grocery-Driven Sensor Adoption
Asia Pacific represents the fastest-growing regional market, driven by rapid urbanization, expanding middle-class consumption, and large-scale investment in cold-chain infrastructure. Growth in organized retail and e-grocery platforms is increasing the need for real-time freshness validation across extended distribution networks. China leads in overall scale, supported by government-backed cold-chain expansion initiatives and stricter food safety oversight following past safety incidents. Major retailers such as Alibaba’s Freshippo and JD.com have invested heavily in digital supply chain systems, including temperature-controlled distribution and traceability technologies.
These digital ecosystems create a natural platform for integrating RFID-enabled freshness sensors and real-time monitoring tools. Japan demonstrates advanced sensor integration within premium retail and seafood sectors, where quality assurance standards are particularly stringent. Japanese packaging and electronics firms continue to innovate in printed sensor miniaturization and accuracy.
India and ASEAN countries are experiencing accelerating adoption as logistics modernization progresses. India’s investment in refrigerated transport corridors and food processing infrastructure is improving cold-chain reliability, encouraging exporters and organized retailers to trial temperature-monitoring solutions. Thailand and Vietnam, major seafood exporters, increasingly adopt digital cold-chain verification technologies to meet international buyer requirements. Partnerships between global sensor providers and local packaging converters help reduce unit costs and tailor solutions to regional compliance standards. Rising private equity and infrastructure investment in cold storage facilities and logistics fleets further supports the long-term expansion of freshness monitoring technologies throughout the region.
Competitive Landscape
The global freshness monitoring packaging market exhibits moderate concentration. Established label manufacturers and packaging converters dominate large-scale TTI production, while specialized sensor and IoT companies lead higher-margin analytics-driven solutions. The top six to eight suppliers hold a meaningful combined share, while numerous niche innovators focus on chemical and printed sensor technologies. Leading companies emphasize bundled hardware and analytics solutions, vertical integration of sensor capabilities, and validated performance certifications. Competitive differentiation centers on accuracy, interoperability, cost efficiency, and sustainability alignment.
Key Industry Developments:
- In May 2025, Amcor introduced AmFreshGuard, a smart film embedded with freshness indicators for meat and seafood packaging that visually changes color based on microbial activity, enhancing spoilage detection at retail and consumer levels.
- In June 2025, Timestrip UK Ltd. partnered with Holtronic Ltd. to launch the Timestrip Neo platform featuring an irreversible, multi-threshold temperature indicator designed for both perishable foods and blood products, signaling a move toward advanced, integrated sensor networks.
Companies Covered in Freshness Monitoring Packaging Market
- CCL Industries
- Avery Dennison Corporation
- 3M Company
- Carrier Global Corporation (Sensitech)
- Timestrip UK Ltd
- Berlinger & Co. AG
- Cold Chain Technologies
- ELPRO-BUCHS AG
- Blulog
- Thin Film Electronics ASA
- Evigence Sensors
- FreshSurety Corporation
- DeltaTrak Inc.
- SpotSee
- Insignia Technologies Ltd
- Temptime Corporation
- Identiv, Inc.
- NXP Semiconductors N.V.
Frequently Asked Questions
The freshness monitoring packaging market size is valued at US$0.8 billion in 2026.
By 2033, the freshness monitoring packaging market is expected to reach US$1.3 billion.
Key trends include rising adoption of time-temperature indicators, rapid growth of RFID- and IoT-enabled freshness sensors, increasing integration with cloud-based analytics platforms, and growing use of bio-based smart packaging materials aligned with sustainability mandates.
Time-Temperature Indicators (TTIs) represent the leading technology segment, accounting for approximately 57.8% adoption, driven by their low cost, simplicity, and ease of integration into existing packaging lines.
The freshness monitoring packaging market is projected to grow at a CAGR of 7.3% between 2026 and 2033.
Major players include CCL Industries, Avery Dennison, 3M, Carrier (Sensitech), and Timestrip.


