


- Executive Summary
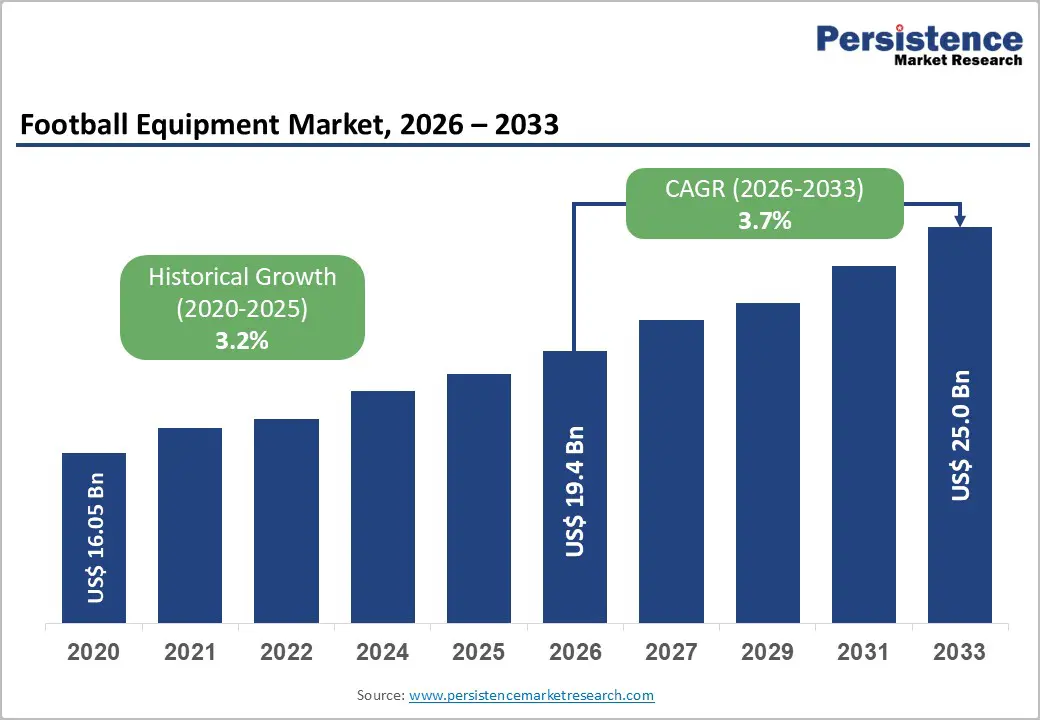
- Global Football Equipment Market Snapshot 2026 and 2033
- Market Opportunity Assessment, 2026-2033, US$ Bn
- Key Market Trends
- Industry Developments and Key Market Events
- Demand Side and Supply Side Analysis
- PMR Analysis and Recommendations
- Market Overview
- Market Scope and Definitions
- Value Chain Analysis
- Macro-Economic Factors
- Global GDP Outlook
- Global Football Industry Overview
- Global Sports Apparel Industry Overview
- Forecast Factors – Relevance and Impact
- COVID-19 Impact Assessment
- PESTLE Analysis
- Porter's Five Forces Analysis
- Geopolitical Tensions: Market Impact
- Regulatory and Technology Landscape
- Market Dynamics
- Drivers
- Restraints
- Opportunities
- Trends
- Price Trend Analysis, 2020 – 2033
- Region-wise Price Analysis
- Price by Segments
- Price Impact Factors
- Global Football Equipment Market Outlook: Historical (2020 – 2025) and Forecast (2026 – 2033)
- Key Highlights
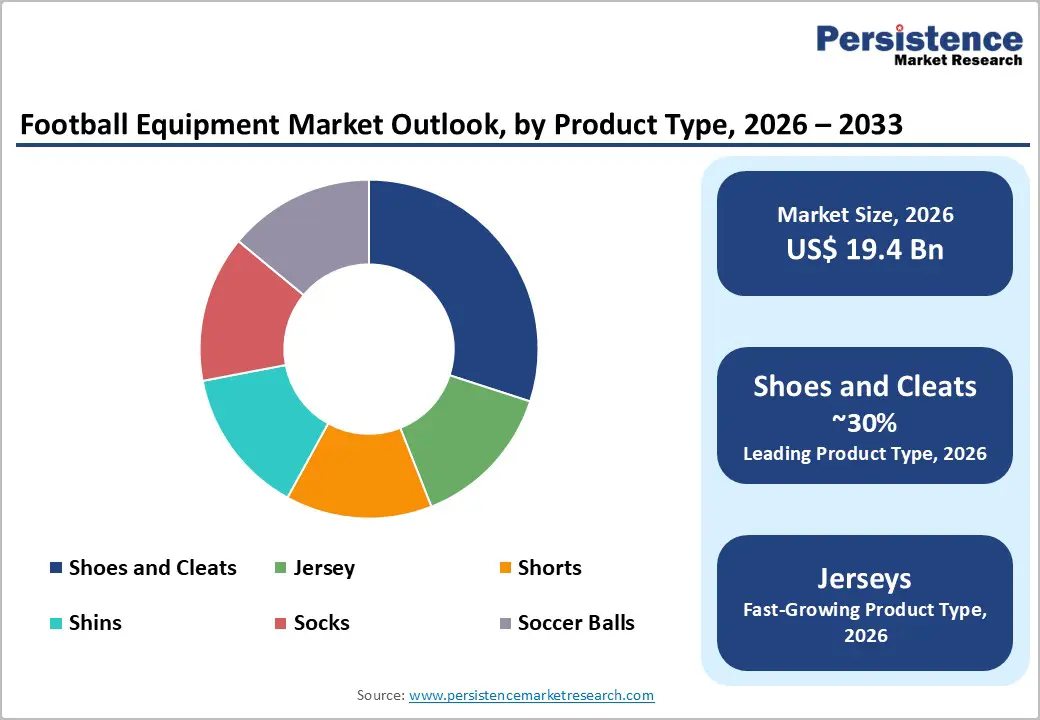
- Global Football Equipment Market Outlook: Product Type
- Introduction/Key Findings
- Historical Market Size (US$ Bn) and Volume (Units) Analysis by Product Type, 2020-2025
- Current Market Size (US$ Bn) and Volume (Units) Forecast, by Product Type, 2026-2033
- Shoes and Cleats
- Jersey
- Shorts
- Shins
- Socks
- Soccer Balls
- Market Attractiveness Analysis: Product Type
- Global Football Equipment Market Outlook: End User
- Introduction/Key Findings
- Historical Market Size (US$ Bn) and Volume (Units) Analysis by End User, 2020-2025
- Current Market Size (US$ Bn) and Volume (Units) Forecast, by End User, 2026-2033
- Men
- Women
- Kids
- Market Attractiveness Analysis: End User
- Global Football Equipment Market Outlook: Distribution Channel
- Introduction/Key Findings
- Historical Market Size (US$ Bn) and Volume (Units) Analysis by Distribution Channel, 2020-2025
- Current Market Size (US$ Bn) and Volume (Units) Forecast, by Distribution Channel, 2026-2033
- Online
- Specialty Stores
- Sports Shops
- Hypermarkets/ Supermarkets
- Market Attractiveness Analysis: Distribution Channel
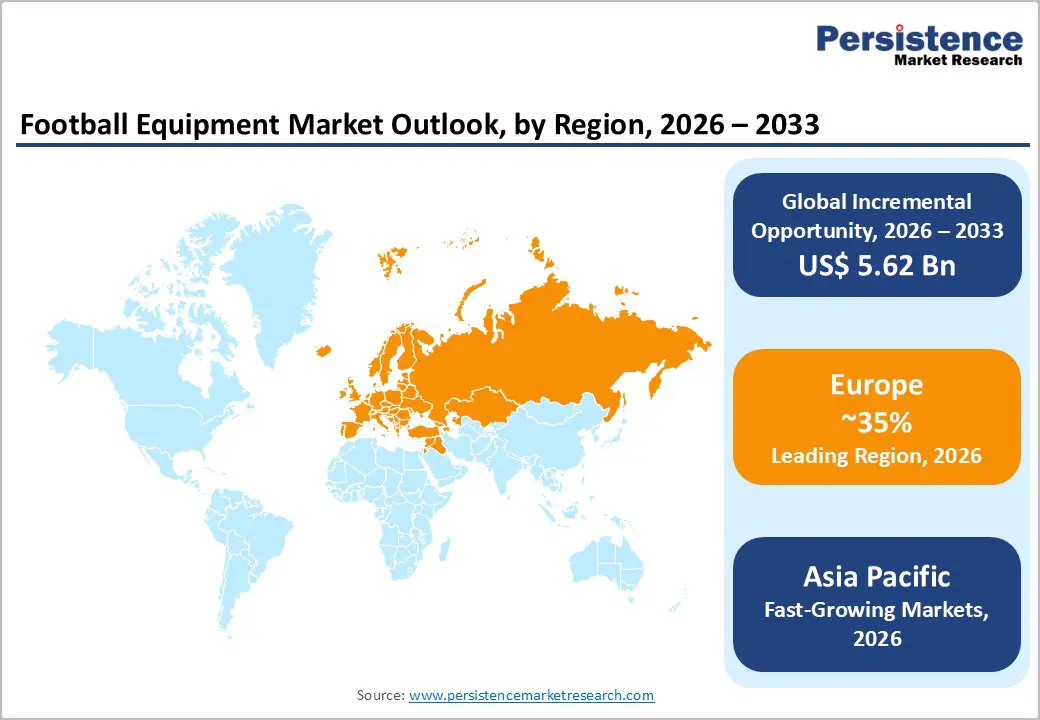
- Global Football Equipment Market Outlook: Region
- Key Highlights
- Historical Market Size (US$ Bn) and Volume (Units) Analysis by Region, 2020-2025
- Current Market Size (US$ Bn) and Volume (Units) Forecast, by Region, 2026-2033
- North America
- Europe
- East Asia
- South Asia & Oceania
- Latin America
- Middle East & Africa
- Market Attractiveness Analysis: Region
- North America Football Equipment Market Outlook: Historical (2020 – 2025) and Forecast (2026 – 2033)
- Key Highlights
- Pricing Analysis
- North America Market Size (US$ Bn) and Volume (Units) Forecast, by Country, 2026-2033
- U.S.
- Canada
- North America Market Size (US$ Bn) and Volume (Units) Forecast, by Product Type, 2026-2033
- Shoes and Cleats
- Jersey
- Shorts
- Shins
- Socks
- Soccer Balls
- North America Market Size (US$ Bn) and Volume (Units) Forecast, by End User, 2026-2033
- Men
- Women
- Kids
- North America Market Size (US$ Bn) and Volume (Units) Forecast, by Distribution Channel, 2026-2033
- Online
- Specialty Stores
- Sports Shops
- Hypermarkets/ Supermarkets
- Europe Football Equipment Market Outlook: Historical (2020 – 2025) and Forecast (2026 – 2033)
- Key Highlights
- Pricing Analysis
- Europe Market Size (US$ Bn) and Volume (Units) Forecast, by Country, 2026-2033
- Germany
- Italy
- France
- U.K.
- Spain
- Russia
- Rest of Europe
- Europe Market Size (US$ Bn) and Volume (Units) Forecast, by Product Type, 2026-2033
- Shoes and Cleats
- Jersey
- Shorts
- Shins
- Socks
- Soccer Balls
- Europe Market Size (US$ Bn) and Volume (Units) Forecast, by End User, 2026-2033
- Men
- Women
- Kids
- Europe Market Size (US$ Bn) and Volume (Units) Forecast, by Distribution Channel, 2026-2033
- Online
- Specialty Stores
- Sports Shops
- Hypermarkets/ Supermarkets
- East Asia Football Equipment Market Outlook: Historical (2020 – 2025) and Forecast (2026 – 2033)
- Key Highlights
- Pricing Analysis
- East Asia Market Size (US$ Bn) and Volume (Units) Forecast, by Country, 2026-2033
- China
- Japan
- South Korea
- East Asia Market Size (US$ Bn) and Volume (Units) Forecast, by Product Type, 2026-2033
- Shoes and Cleats
- Jersey
- Shorts
- Shins
- Socks
- Soccer Balls
- East Asia Market Size (US$ Bn) and Volume (Units) Forecast, by End User, 2026-2033
- Men
- Women
- Kids
- East Asia Market Size (US$ Bn) and Volume (Units) Forecast, by Distribution Channel, 2026-2033
- Online
- Specialty Stores
- Sports Shops
- Hypermarkets/ Supermarkets
- South Asia & Oceania Football Equipment Market Outlook: Historical (2020 – 2025) and Forecast (2026 – 2033)
- Key Highlights
- Pricing Analysis
- South Asia & Oceania Market Size (US$ Bn) and Volume (Units) Forecast, by Country, 2026-2033
- India
- Southeast Asia
- ANZ
- Rest of SAO
- South Asia & Oceania Market Size (US$ Bn) and Volume (Units) Forecast, by Product Type, 2026-2033
- Shoes and Cleats
- Jersey
- Shorts
- Shins
- Socks
- Soccer Balls
- South Asia & Oceania Market Size (US$ Bn) and Volume (Units) Forecast, by End User, 2026-2033
- Men
- Women
- Kids
- South Asia & Oceania Market Size (US$ Bn) and Volume (Units) Forecast, by Distribution Channel, 2026-2033
- Online
- Specialty Stores
- Sports Shops
- Hypermarkets/ Supermarkets
- Latin America Football Equipment Market Outlook: Historical (2020 – 2025) and Forecast (2026 – 2033)
- Key Highlights
- Pricing Analysis
- Latin America Market Size (US$ Bn) and Volume (Units) Forecast, by Country, 2026-2033
- Brazil
- Mexico
- Rest of LATAM
- Latin America Market Size (US$ Bn) and Volume (Units) Forecast, by Product Type, 2026-2033
- Shoes and Cleats
- Jersey
- Shorts
- Shins
- Socks
- Soccer Balls
- Latin America Market Size (US$ Bn) and Volume (Units) Forecast, by End User, 2026-2033
- Men
- Women
- Kids
- Latin America Market Size (US$ Bn) and Volume (Units) Forecast, by Distribution Channel, 2026-2033
- Online
- Specialty Stores
- Sports Shops
- Hypermarkets/ Supermarkets
- Middle East & Africa Football Equipment Market Outlook: Historical (2020 – 2025) and Forecast (2026 – 2033)
- Key Highlights
- Pricing Analysis
- Middle East & Africa Market Size (US$ Bn) and Volume (Units) Forecast, by Country, 2026-2033
- GCC Countries
- South Africa
- Northern Africa
- Rest of MEA
- Middle East & Africa Market Size (US$ Bn) and Volume (Units) Forecast, by Product Type, 2026-2033
- Shoes and Cleats
- Jersey
- Shorts
- Shins
- Socks
- Soccer Balls
- Middle East & Africa Market Size (US$ Bn) and Volume (Units) Forecast, by End User, 2026-2033
- Men
- Women
- Kids
- Middle East & Africa Market Size (US$ Bn) and Volume (Units) Forecast, by Distribution Channel, 2026-2033
- Online
- Specialty Stores
- Sports Shops
- Hypermarkets/ Supermarkets
- Competition Landscape
- Market Share Analysis, 2025
- Market Structure
- Competition Intensity Mapping
- Competition Dashboard
- Company Profiles
- Adidas AG
- Company Overview
- Product Portfolio/Offerings
- Key Financials
- SWOT Analysis
- Company Strategy and Key Developments
- Nike Inc.
- Under Armour, Inc.
- New Balance, Inc
- ASICS Corporation
- MIZUNO Corporation
- Lotto SpA
- Hummel
- BasicNet
- PUMA SE
- Baden Sports Inc.
- Diadora Spa
- Adams
- Adidas AG
- Appendix
- Research Methodology
- Research Assumptions
- Acronyms and Abbreviations

Loading page data
Please wait a moment


