

- Executive Summary
- Global Foil Shavers Market Snapshot 2026 and 2033
- Market Opportunity Assessment, 2026 - 2033, US$ Mn
- Key Market Trends
- Industry Developments and Key Market Events
- PMR Analysis and Recommendations
- Market Overview
- Market Scope and Definitions
- Value Chain Analysis
- Macro-Economic Factors
- Global GDP Outlook
- Personal Hygiene Product Overview
- Global Electronic Consumer Goods Demand by Region
- Global Foil Shavers Sales Overview
- Forecast Factors - Relevance and Impact
- COVID-19 Impact Assessment
- PESTLE Analysis
- Porter's Five Forces Analysis
- Geopolitical Tensions: Market Impact
- Regulatory and Technology Landscape
- Market Dynamics
- Drivers
- Restraints
- Opportunities
- Trends
- Price Trend Analysis, 2020 - 2033
- Region-wise Price Analysis
- Price by Segments
- Price Impact Factors
- Global Foil Shavers Market Outlook:
- Key Highlights
- Global Foil Shavers Market Outlook: Price Range
- Introduction/Key Findings
- Historical Market Size (US$ Mn) and Volume (Units) Analysis by Price Range, 2020-2025
- Current Market Size (US$ Mn) and Volume (Units) Analysis and Forecast, by Price Range, 2026-2033
- Low (Up to 40 US$ )
- Mid Range (US$ 40 to US$ 200)
- US$ 200 & Above
- Market Attractiveness Analysis: Price Range
- Global Foil Shavers Market Outlook: Product Type
- Introduction/Key Findings
- Historical Market Size (US$ Mn) and Volume (Units) Analysis by Product Type, 2020-2025
- Current Market Size (US$ Mn) and Volume (Units) Analysis and Forecast, by Product Type, 2026-2033
- Rechargeable Foil Shavers
- Battery-Operated Foil Shavers
- Corded Foil Shavers
- Market Attractiveness Analysis: Product Type
- Global Foil Shavers Market Outlook: Sales Channel
- Introduction/Key Findings
- Historical Market Size (US$ Mn) and Volume (Units) Analysis by Sales Channel, 2020-2025
- Current Market Size (US$ Mn) and Volume (Units) Analysis and Forecast, by Sales Channel, 2026-2033
- Online Retail
- Supermarkets/Hypermarkets
- Specialty Stores
- Others
- Market Attractiveness Analysis: Sales Channel
- Global Foil Shavers Market Outlook: Region
- Key Highlights
- Historical Market Size (US$ Mn) and Volume (Units) Analysis by Region, 2020-2025
- Current Market Size (US$ Mn) and Volume (Units) Analysis and Forecast, by Region, 2026-2033
- North America
- Europe
- East Asia
- South Asia & Oceania
- Latin America
- Middle East & Africa
- Market Attractiveness Analysis: Region
- North America Foil Shavers Market Outlook:
- Key Highlights
- Pricing Analysis
- North America Market Size (US$ Mn) and Volume (Units) Analysis and Forecast, by Country, 2026-2033
- U.S.
- Canada
- North America Market Size (US$ Mn) and Volume (Units) Analysis and Forecast, by Price Range, 2026-2033
- Low (Up to 40 US$ )
- Mid Range (US$ 40 to US$ 200)
- US$ 200 & Above
- North America Market Size (US$ Mn) and Volume (Units) Analysis and Forecast, by Product Type, 2026-2033
- Rechargeable Foil Shavers
- Battery-Operated Foil Shavers
- Corded Foil Shavers
- North America Market Size (US$ Mn) and Volume (Units) Analysis and Forecast, by Sales Channel, 2026-2033
- Online Retail
- Supermarkets/Hypermarkets
- Specialty Stores
- Others
- Europe Foil Shavers Market Outlook:
- Key Highlights
- Pricing Analysis
- Europe Market Size (US$ Mn) and Volume (Units) Analysis and Forecast, by Country, 2026-2033
- Germany
- Italy
- France
- U.K.
- Spain
- Russia
- Rest of Europe
- Europe Market Size (US$ Mn) and Volume (Units) Analysis and Forecast, by Price Range, 2026-2033
- Low (Up to 40 US$ )
- Mid Range (US$ 40 to US$ 200)
- US$ 200 & Above
- Europe Market Size (US$ Mn) and Volume (Units) Analysis and Forecast, by Product Type, 2026-2033
- Rechargeable Foil Shavers
- Battery-Operated Foil Shavers
- Corded Foil Shavers
- Europe Market Size (US$ Mn) and Volume (Units) Analysis and Forecast, by Sales Channel, 2026-2033
- Online Retail
- Supermarkets/Hypermarkets
- Specialty Stores
- Others
- East Asia Foil Shavers Market Outlook:
- Key Highlights
- Pricing Analysis
- East Asia Market Size (US$ Mn) and Volume (Units) Analysis and Forecast, by Country, 2026-2033
- China
- Japan
- South Korea
- East Asia Market Size (US$ Mn) and Volume (Units) Analysis and Forecast, by Price Range, 2026-2033
- Low (Up to 40 US$ )
- Mid Range (US$ 40 to US$ 200)
- US$ 200 & Above
- East Asia Market Size (US$ Mn) and Volume (Units) Analysis and Forecast, by Product Type, 2026-2033
- Rechargeable Foil Shavers
- Battery-Operated Foil Shavers
- Corded Foil Shavers
- East Asia Market Size (US$ Mn) and Volume (Units) Analysis and Forecast, by Sales Channel, 2026-2033
- Online Retail
- Supermarkets/Hypermarkets
- Specialty Stores
- Others
- South Asia & Oceania Foil Shavers Market Outlook:
- Key Highlights
- Pricing Analysis
- South Asia & Oceania Market Size (US$ Mn) and Volume (Units) Analysis and Forecast, by Country, 2026-2033
- India
- Southeast Asia
- ANZ
- Rest of SAO
- South Asia & Oceania Market Size (US$ Mn) and Volume (Units) Analysis and Forecast, by Price Range, 2026-2033
- Low (Up to 40 US$ )
- Mid Range (US$ 40 to US$ 200)
- US$ 200 & Above
- South Asia & Oceania Market Size (US$ Mn) and Volume (Units) Analysis and Forecast, by Product Type, 2026-2033
- Rechargeable Foil Shavers
- Battery-Operated Foil Shavers
- Corded Foil Shavers
- South Asia & Oceania Market Size (US$ Mn) and Volume (Units) Analysis and Forecast, by Sales Channel, 2026-2033
- Online Retail
- Supermarkets/Hypermarkets
- Specialty Stores
- Others
- Latin America Foil Shavers Market Outlook:
- Key Highlights
- Pricing Analysis
- Latin America Market Size (US$ Mn) and Volume (Units) Analysis and Forecast, by Country, 2026-2033
- Brazil
- Mexico
- Rest of LATAM
- Latin America Market Size (US$ Mn) and Volume (Units) Analysis and Forecast, by Price Range, 2026-2033
- Low (Up to 40 US$ )
- Mid Range (US$ 40 to US$ 200)
- US$ 200 & Above
- Latin America Market Size (US$ Mn) and Volume (Units) Analysis and Forecast, by Product Type, 2026-2033
- Rechargeable Foil Shavers
- Battery-Operated Foil Shavers
- Corded Foil Shavers
- Latin America Market Size (US$ Mn) and Volume (Units) Analysis and Forecast, by Sales Channel, 2026-2033
- Online Retail
- Supermarkets/Hypermarkets
- Specialty Stores
- Others
- Middle East & Africa Foil Shavers Market Outlook:
- Key Highlights
- Pricing Analysis
- Middle East & Africa Market Size (US$ Mn) and Volume (Units) Analysis and Forecast, by Country, 2026-2033
- GCC Countries
- South Africa
- Northern Africa
- Rest of MEA
- Middle East & Africa Market Size (US$ Mn) and Volume (Units) Analysis and Forecast, by Price Range, 2026-2033
- Low (Up to 40 US$ )
- Mid Range (US$ 40 to US$ 200)
- US$ 200 & Above
- Middle East & Africa Market Size (US$ Mn) and Volume (Units) Analysis and Forecast, by Product Type, 2026-2033
- Rechargeable Foil Shavers
- Battery-Operated Foil Shavers
- Corded Foil Shavers
- Middle East & Africa Market Size (US$ Mn) and Volume (Units) Analysis and Forecast, by Sales Channel, 2026-2033
- Online Retail
- Supermarkets/Hypermarkets
- Specialty Stores
- Others
- Competition Landscape
- Market Share Analysis, 2026
- Market Structure
- Competition Intensity Mapping
- Competition Dashboard
- Company Profiles
- Panasonic Corporation
- Company Overview
- Product Portfolio/Offerings
- Key Financials
- SWOT Analysis
- Company Strategy and Key Developments
- Wahl Clipper Corporation
- Koninklijke Philips N.V.
- Braun GmbH
- Havells India Limited
- Carrera (Safilo Group S.p.A)
- Conair Corporation (Jarden)
- Gamma+ LLC
- Bevel (Walker and Company)
- Mangroomer
- Remington
- Andis Company, Inc.
- Other Players (As Requested)
- Panasonic Corporation
- Appendix
- Research Methodology
- Research Assumptions
- Acronyms and Abbreviations


- Beauty & Personal Care
- Foil Shavers Market
Foil Shavers Market Size, Trends, Share, and Growth Forecast, 2026 - 2033
Foil Shavers Market by Product Type (Rechargeable Foil Shavers, Battery-Operated Foil Shavers, Corded Foil Shavers), By Sales Channel (Online Retail, Supermarkets/Hypermarkets, Specialty Stores, Others), By Price Range (Mid-Range (US$ 40 to US$ 200), Low (Up to 40 US$ ), and US$ 200 & Above), and Regional Analysis for 2026 - 2033
Foil Shavers Market Size and Trends Analysis
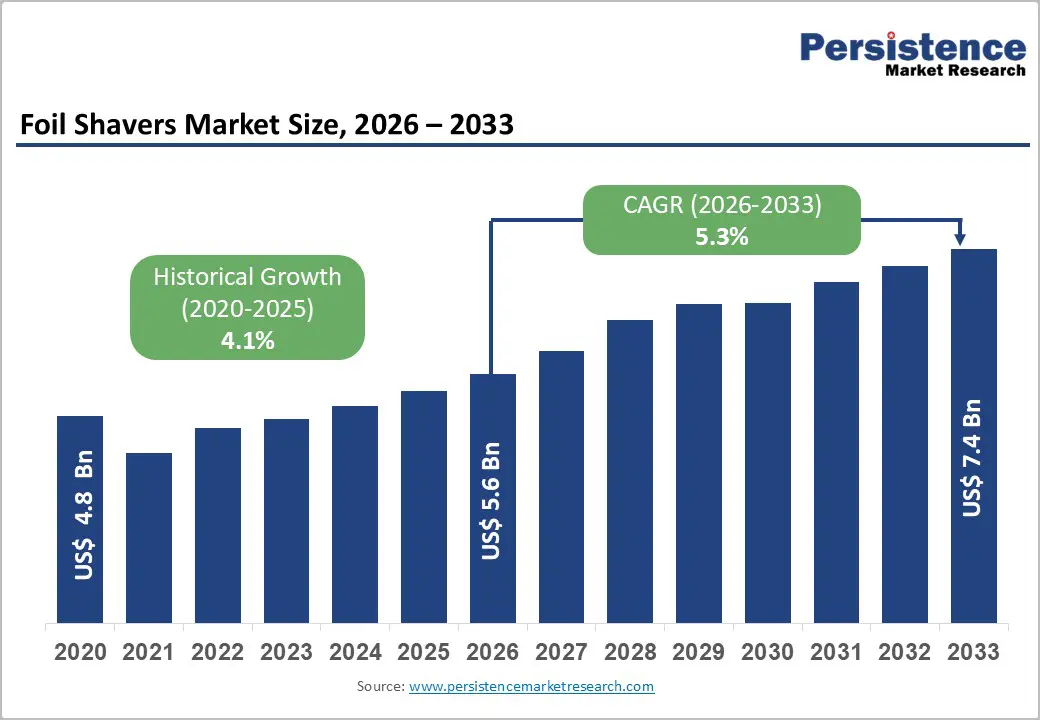
The global foil shavers market size is likely to be valued at US$ 5.6 billion in 2026 and is projected to reach US$ 7.4 billion by 2033, growing at a CAGR of 5.3% between 2026 and 2033. The market demonstrated a historical CAGR of 4.1% from 2020 to 2026, indicating accelerating growth momentum as consumer adoption strengthens globally.
This market expansion is driven by the convergence of rising personal grooming awareness, technological advancements in battery and motor efficiency, and the rapid expansion of e-commerce distribution channels. Rechargeable foil shavers dominate the product landscape, capturing over 55% revenue share, while online retail represents the primary growth driver with over 40% market concentration. The market presents a compelling investment opportunity, characterized by premiumization trends, sustainability mandates, and geographic expansion into high-growth emerging economies, particularly across Asia Pacific and selected European markets.
Key Industry Highlights:
- Segmentation Leadership and Growth Dynamics: Rechargeable foil shavers dominate product type with over 55% revenue share while simultaneously representing the fastest-growing segment at 5.6% CAGR, driven by technological advancement and sustainability consciousness.
- Online retail channels command over 40% market revenue share with supermarkets/hypermarkets emerging as the fastest-growing channel at 5.8% CAGR, reflecting omnichannel distribution optimization and emerging market retail infrastructure expansion.
- Regional Market Leadership and Growth: Asia Pacific commands above 45% revenue share with dominant market position, while Europe emerges as fastest-growing region, driven by sustainability mandates and premium consumer preferences supporting accelerated expansion trajectories across developing and developed markets.
- Price Positioning and Market Accessibility: Mid-range products (US$ 40-US$ 200) dominate with over 50% revenue share, while low-price entry-level shavers demonstrate fastest growth at 5.9% CAGR, indicating market democratization across geographic and income-based consumer segments.
- Strategic Innovation and Competitive Development: Recent product innovations including Manscaped's Chairman Pro (2024), Philips' AI-powered Series 7000/i9000 (2025), and Laifen's market entry (2025) demonstrate sustained industry innovation momentum supporting differentiation and competitive positioning across premium, mainstream, and emerging competitive segments.
| Key Insights | Details |
|---|---|
| Foil Shavers Market Size (2026E) | US$ 5.6 Bn |
| Market Value Forecast (2033F) | US$ 7.4 Bn |
| Projected Growth (CAGR 2026 to 2033) | 5.3% |
| Historical Market Growth (CAGR 2020 to 2025) | 4.1% |
Market Dynamics
Drivers - Rising Personal Grooming and Hygiene Consciousness
The global surge in personal grooming awareness represents the primary market driver for foil shavers, particularly among younger demographics including Gen Z and millennials. Social media influence and changing beauty ideals have fundamentally shifted consumer perceptions regarding self-care and appearance management, creating sustained demand across both male and female consumer segments. Public health policies endorsed by organizations such as the CDC and WHO actively advocate for improved personal care standards, reinforcing the adoption of hygienic grooming devices that minimize skin irritation and infection risks.
The post-pandemic focus on personal hygiene has become an ingrained behavioral norm, with electric shavers increasingly recognized as more hygienic alternatives to traditional razors, which can harbor bacteria and trigger skin reactions. This health consciousness spans all demographic groups, positioning foil shavers as premium grooming essentials rather than discretionary purchases. Market data reveals that 89% of consumers in developed markets prioritize hygiene and skin health when selecting grooming products, directly supporting foil shaver adoption rates.
Restraint - Availability of Low-Cost Alternatives and Competitive Substitution
The persistent availability of affordable cartridge razors and traditional manual shaving solutions presents structural competitive challenges to foil shaver market growth. These alternatives maintain significant market presence due to their minimal entry costs, established distribution networks, and deeply ingrained consumer preferences rooted in generational usage patterns. Male consumers in price-sensitive markets continue selecting disposable razors despite recognized hygiene and performance disadvantages, prioritizing cost considerations over functional benefits.
The women population in developing markets frequently opt for waxing services or low-cost razors, creating substitution dynamics that limit electric shaver market expansion despite superior performance characteristics. The competitive pressure from substitute solutions necessitates aggressive marketing investments and consumer education initiatives, diverting resources from product development and limiting profitability margins for market participants, particularly smaller regional competitors lacking brand equity and distribution infrastructure.
Opportunity- Gender-Inclusive Product Development and Women's Grooming Expansion
The expanding recognition of female grooming markets presents a substantial growth opportunity, with women increasingly adopting electric shavers for facial and body hair removal as alternatives to waxing and traditional razors. Side effects associated with waxing, including burns, skin peeling, and rashes, drive consumer migration toward electric shaver solutions offering safety and convenience advantages. Brands developing gender-specific and gender-neutral products with ergonomic designs tailored to female anatomy capture emerging market segments, with market intelligence indicating women's grooming product adoption rates increasing at 8.2% CAGR across developed markets. This demographic expansion addresses previously underserved consumer segments, with potential market sizing indicating that women's foil shavers could represent 25-30% of total market volume by 2033, substantially expanding total addressable market dimensions and supporting premium pricing strategies aligned with specialized product features.
Category-wise Analysis
Product Type Insights
Online Retail Dominates Foil Shaver Sales as Supermarkets Accelerate Global Market Growth
Online retail has emerged as the dominant distribution channel for foil shavers, generating over 40% of global revenue and acting as the market’s strongest growth driver. The channel’s leadership is supported by the rapid rise of digital commerce, improved logistics networks, and growing consumer confidence in purchasing grooming products online. E-commerce platforms such as Amazon, regional marketplaces, specialized beauty retailers, and direct-to-consumer brand websites offer extensive product variety, transparent pricing, customer reviews, and convenient home delivery features that significantly influence purchasing decisions. Moreover, online platforms allow manufacturers to collect real-time consumer feedback, enabling faster product development cycles, personalized marketing, and data-driven promotional strategies. Lower operational costs compared to physical stores further strengthen profitability for brands operating online.
In parallel, supermarkets and hypermarkets represent the fastest-growing sales channel, expanding at a 5.8% CAGR. These stores enhance consumer engagement by enabling physical product evaluation, product trials, and immediate purchasing, which is particularly appealing to older or price-sensitive buyers. Their rapid expansion in emerging markets especially in Asia Pacific and Latin America extends product accessibility where e-commerce penetration remains limited. Strategic collaborations between manufacturers and large retail chains support wider shelf presence, reinforcing balanced omnichannel growth across global markets.
Price Range Insights
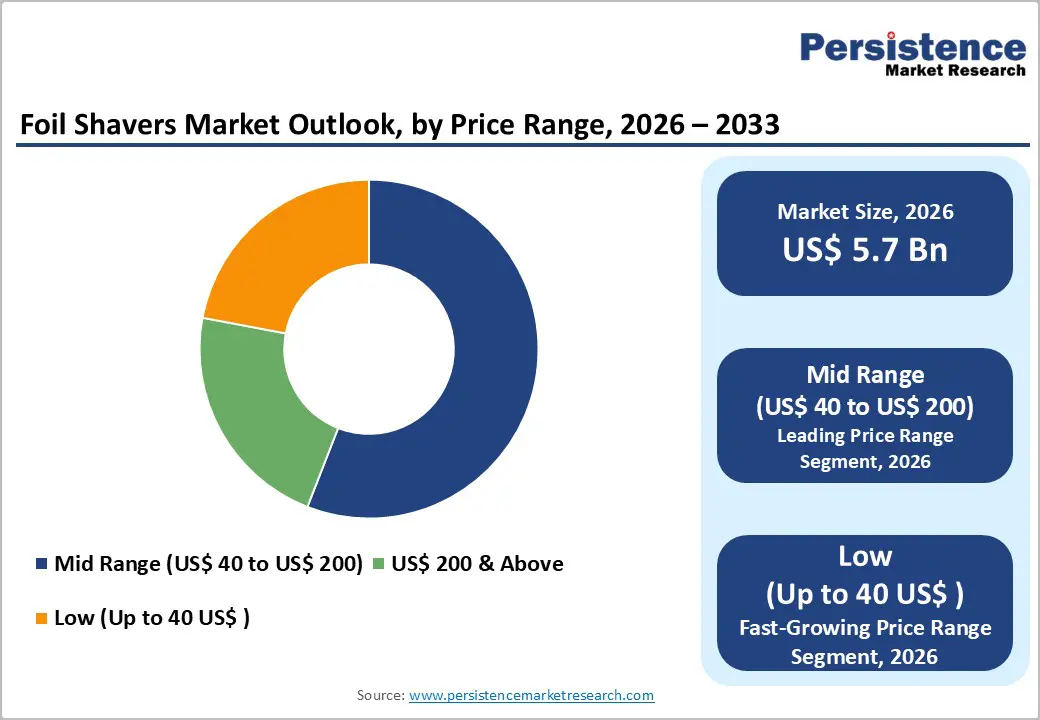
Mid-Range Leads Revenue While Low-Price Segment Drives Fastest Foil Shaver Growth
The mid-range price segment, spanning US$40 to US$200, remains the dominant category with over 50% revenue share, largely because it delivers the strongest balance between advanced functionality, trusted brand quality, and broad consumer affordability. Products in this band typically include precision trimming systems, waterproof designs, faster motors, and long-lasting rechargeable batteries features that appeal to consumers who prioritize durability and performance without entering the premium price tier. Leading brands such as Philips, Braun, and Panasonic anchor most of their portfolios in this segment, leveraging strong brand equity to maintain stable demand even during economic fluctuations. This consumer group also demonstrates high purchasing consistency, reinforcing predictable revenue streams for manufacturers.
In contrast, the low-price segment (up to US$40) stands out as the fastest-growing category, expanding at a 5.9% CAGR. Growth is driven by increased accessibility of essential foil shaver technology and the rapid entry of cost-competitive brands targeting emerging markets. Manufacturers such as Enchen and Xiaomi have accelerated adoption by offering feature-rich yet affordable models that challenge traditional pricing structures. Rising disposable incomes, large population bases, and demand for cost-effective grooming solutions in developing regions are fueling exceptional volume expansion. This segment’s growth underscores ongoing market democratization and deeper penetration across price-sensitive geographies.
Regional Insights and Trends
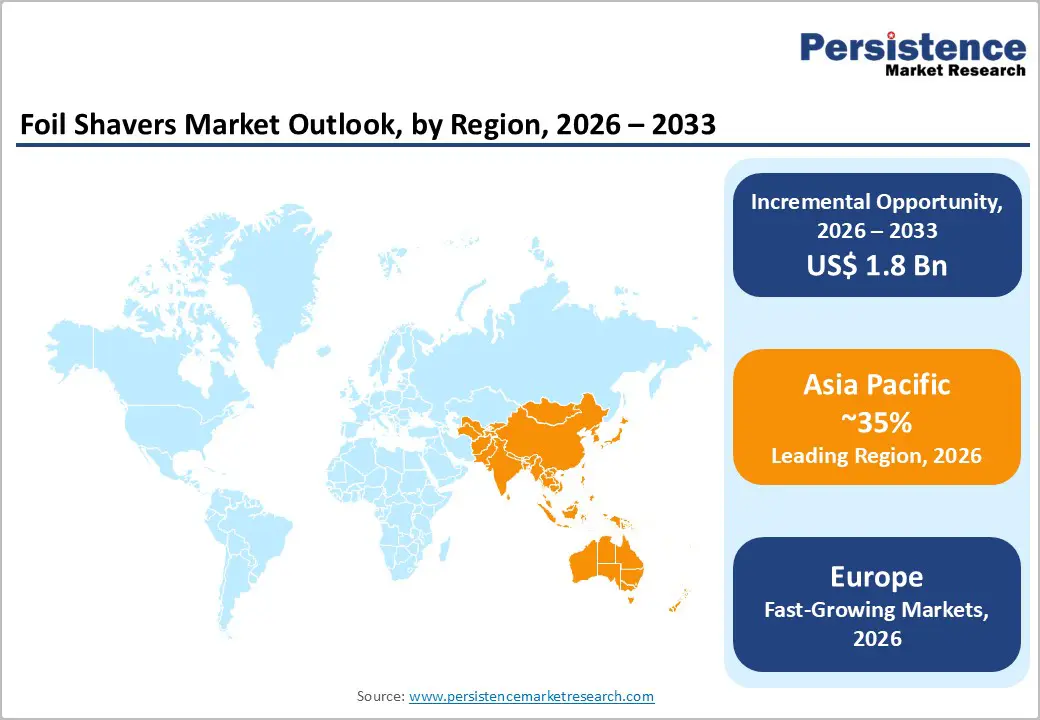
Asia Pacific Leads Foil Shavers Market with Strong Growth and Expanding Regional Opportunities
Asia Pacific dominates the global foil shavers market, commanding above 45% revenue share and representing the fastest-growing geographic region with sustained expansion momentum. The region's dominance reflects several converging macroeconomic factors, including rapid urbanization, rising disposable incomes, particularly among younger demographics, and accelerating e-commerce adoption, enabling broad product accessibility.
China maintains a market leadership position within Asia Pacific, with 2022 market valuation reaching US$ 1,107.1 Million and projected growth to substantial multiples by 2030. India's aggressive market expansion, demonstrated by 7.1% CAGR and market valuation trajectory from US$ 689.3 Million (2024) to US$ 1,263.8 Million (2030), reflects demographic advantages, including a massive population base, rising middle-class affluence, and digital transformation initiatives. Japan's consistent 5.8% CAGR and established consumer preference for premium grooming products support sustained market growth despite mature market characteristics.
Growth drivers across Asia Pacific encompass manufacturing advantage, positioning the region as a global production hub, reducing supply-chain costs, digital payment infrastructure facilitating e-commerce transactions, and social media proliferation enabling brand awareness among digitally native consumer cohorts. Government initiatives promoting domestic manufacturing and trade facilitation enhance supply-chain robustness while reducing production costs, enabling broader market penetration.
Regulatory environments across the Asia Pacific vary significantly, with developed markets including Japan and Singapore maintaining stringent quality and safety standards aligning with global norms, while emerging markets implement progressively strengthened environmental and safety regulations. Investment trends indicate substantial capital allocation toward distribution network expansion, e-commerce infrastructure development, and brand-building marketing initiatives targeting young urban consumers. Geographic expansion opportunities exist particularly across Southeast Asia, including Vietnam, Malaysia, and Indonesia, where rising consumer affluence and expanding retail infrastructure create favorable market entry conditions.
Europe’s Premium Grooming Surge Driven by Sustainability, Regulations, and Evolving Consumer Preferences
Europe represents the fastest-growing region, driven by stringent environmental regulations, sustainability consciousness among consumers, and strong purchasing power supporting premium product adoption. Germany's dominant position within Europe, commanding 19.43% share of the broader personal care appliances market, reflects manufacturing heritage, premium brand positioning, and consumer preference for durable, quality-focused products over budget alternatives. The UK market demonstrates notable CAGR expansion propelled by growing male grooming habits, increasing preference for multipurpose devices suitable for sensitive skin, and advanced retail infrastructure supporting omnichannel distribution strategies.
France and Spain present complementary growth dynamics, with French consumers emphasizing technological sophistication and sustainability credentials, while Spanish consumers demonstrate price sensitivity requiring value-oriented product positioning. Regulatory harmonization across European Union jurisdictions accelerates environmental compliance standardization, enabling streamlined manufacturing processes and supply-chain optimization. However, economic headwinds including inflation, geopolitical uncertainty, and potential recession risks create consumer spending constraints that may dampen growth velocity in certain markets. Sustainability mandates from regulatory bodies including the European Environment Agency compel manufacturers to adopt circular economy principles, creating competitive differentiation opportunities for brands implementing eco-friendly production methodologies and sustainable packaging solutions. Investment trends emphasize R&D allocation toward sustainable technologies, with notable 2025 developments including Laifen's product portfolio expansion into electric shavers at Berlin's IFA 2025, signaling manufacturer commitment to European market penetration.
Competitive Landscape
The global foil shavers market exhibits a moderately concentrated competitive structure dominated by multinational corporations with established brand recognition, substantial R&D investments, and global distribution networks. Leading players including Koninklijke Philips, Braun GmbH (Procter & Gamble subsidiary), Panasonic Corporation, Wahl Clipper Corporation, and Spectrum Brands (Remington) collectively command approximately 55-60% global market share through premium product positioning and comprehensive geographic coverage.
Mid-tier competitors including Havells India, Conair Corporation, and Manscaped capture regional market segments and emerging consumer niches through differentiated product offerings and targeted marketing strategies. Emerging Chinese manufacturers including Enchen and Xiaomi aggressively penetrate price-sensitive markets with feature-competitive products at significantly discounted price points, creating competitive pressures on established brands' mid-range product segments.
Market concentration analysis indicates that while the sector demonstrates moderate fragmentation with opportunities for specialized competitors, substantial barriers to entry including capital requirements for R&D, manufacturing infrastructure, and brand-building marketing investments protect incumbent market leaders.
Distribution partnerships, particularly with major e-commerce platforms and retail chains, represent critical competitive differentiators, with manufacturers securing prominent online placement and retail shelf space commanding disproportionate market visibility and sales velocity. Innovation velocity and speed-to-market for technologically advanced products determine competitive positioning, with leading manufacturers launching two to three new models annually, incorporating incremental technological enhancements and feature innovations.
Key Industry Developments:
- In September 2025, Laifen expanded into the electric shaver market at IFA 2025 in Berlin, introducing the T1 Pro, designed for precision shaving, and the P3 Pro, targeted at users with demanding, dense beards. These models feature high-speed motors, CNC-milled aluminum construction, and advanced skin-friendly technologies. The launch marked a significant push into the European market, with the products becoming available from September 19.
- In 2025, Philips unveiled its next-generation electric shaver lineup the Philips Series 7000, i9000, and i9000 Prestige Ultra. Powered by SkinIQ technology, these intelligent shavers automatically adapt to the user's skin type to deliver a close and comfortable shaving experience. Philips (NYSE: PHG, AEX: PHIA), a global leader in health technology, showcased the new models in India during an exclusive event co-hosted by Vidyut Kaul, Head of Personal Health for the Philips Growth Region, and India’s well-known tech expert Rajiv Makhni (Gadget Guru).
- In 2024, MANSCAPED®, the global men’s grooming and lifestyle brand, announced the launch of The Chairman™ Pro electric foil shaver and The Chairman™ Pro Package face shaving kit. Featuring an interchangeable dual-head system paired with premium gel and serum, the products were designed to help users maintain a smooth shave or precise stubble with ease and consistency.
Companies Covered in Foil Shavers Market
- Panasonic Corporation
- Wahl Clipper Corporation
- Koninklijke Philips N.V.
- Braun GmbH
- Havells India Limited
- Carrera (Safilo Group S.p.A)
- Conair Corporation (Jarden)
- Gamma+ LLC
- Bevel (Walker and Company)
- Mangroomer
- Remington
- Andis Company, Inc.
- Other Market Players
Frequently Asked Questions
The Foil Shavers market is estimated to be valued at US$ 5.7 Bn in 2026.
The key demand driver for the Foil Shavers market is the rising consumer preference for fast, precise, and skin-friendly shaving solutions enabled by advanced technologies such as high-speed motors, multi-foil cutting systems, and intelligent skin-adaptive sensors.
In 2026, the Asia Pacific region will dominate the market with an exceeding 45% revenue share in the global Foil Shavers market.
Among product types, rechargeable foil shavers have the highest preference, capturing beyond 60% of the market revenue share in 2026, surpassing other product types.
Panasonic Corporation, Wahl Clipper Corporation, Koninklijke Philips N.V., Braun GmbH, Havells India Limited, Carrera (Safilo Group S.p.A), and Conair Corporation (Jarden)are a few leading players in the Foil Shavers market.


