

- Executive Summary
- Global Fatty Acid Supplements Market Snapshot 2026 and 2033
- Market Opportunity Assessment, 2026-2033, US$ Bn
- Key Market Trends
- Industry Developments and Key Market Events
- Demand Side and Supply Side Analysis
- PMR Analysis and Recommendations
- Market Overview
- Market Scope and Definitions
- Market Dynamics
- Driver
- Restraint
- Opportunities
- Trends
- Macro-Economic Factors
- Forecast Factors – Relevance and Impact
- COVID-19 Impact Assessment
- Value Added Insights
- Value Chain analysis
- Key Market Players
- Key Promotional Strategies by key players
- PESTLE Analysis
- Porter's Five Forces Analysis
- Regulatory Landscape
- Price Trend Analysis, 2025
- Region-wise Price Analysis
- Price by Segments
- Price Impact Factors
- Global Fatty Acid Supplements Market Outlook: Historical (2020 – 2025) and Forecast (2026 – 2033)
- Key Highlights
- Global Fatty Acid Supplements Market Outlook: Source
- Introduction/Key Findings
- Historical Market Size (US$ Bn) Analysis by Source, 2020-2025
- Current Market Size (US$ Bn) Forecast, by Source, 2026-2033
- Marine Oil
- Algal Oil
- Flaxseed Oil
- Others
- Market Attractiveness Analysis: Source
- Global Fatty Acid Supplements Market Outlook: End Use
- Introduction/Key Findings
- Historical Market Size (US$ Bn) Analysis by End Use, 2020-2025
- Current Market Size (US$ Bn) Forecast, by End Use, 2026-2033
- Dietary Supplements
- Functional Food
- Beverages
- Infant Formula
- Pharmaceuticals
- Others
- Market Attractiveness Analysis: End Use
- Global Fatty Acid Supplements Market Outlook: Sales Channel
- Introduction/Key Findings
- Historical Market Size (US$ Bn) Analysis by Sales Channel, 2020-2025
- Current Market Size (US$ Bn) Forecast, by Sales Channel, 2026-2033
- Supermarkets / Hypermarkets
- Pharmacies & Drug Stores
- Specialty Stores
- Online Retail
- Others
- Market Attractiveness Analysis: Sales Channel
- Global Fatty Acid Supplements Market Outlook: Region
- Key Highlights
- Historical Market Size (US$ Bn) Analysis by Region, 2020-2025
- Current Market Size (US$ Bn) Forecast, by Region, 2026-2033
- North America
- Europe
- East Asia
- South Asia & Oceania
- Latin America
- Middle East & Africa
- Market Attractiveness Analysis: Region
- North America Fatty Acid Supplements Market Outlook: Historical (2020 – 2025) and Forecast (2026 – 2033)
- Key Highlights
- Pricing Analysis
- North America Market Size (US$ Bn) Forecast, by Country, 2026-2033
- U.S.
- Canada
- North America Market Size (US$ Bn) Forecast, by Source, 2026-2033
- Marine Oil
- Algal Oil
- Flaxseed Oil
- Others
- North America Market Size (US$ Bn) Forecast, by End Use, 2026-2033
- Dietary Supplements
- Functional Food
- Beverages
- Infant Formula
- Pharmaceuticals
- Others
- North America Market Size (US$ Bn) Forecast, by Sales Channel, 2026-2033
- Supermarkets / Hypermarkets
- Pharmacies & Drug Stores
- Specialty Stores
- Online Retail
- Others
- Europe Fatty Acid Supplements Market Outlook: Historical (2020 – 2025) and Forecast (2026 – 2033)
- Key Highlights
- Pricing Analysis
- Europe Market Size (US$ Bn) Forecast, by Country, 2026-2033
- Germany
- Italy
- France
- U.K.
- Spain
- Russia
- Rest of Europe
- Europe Market Size (US$ Bn) Forecast, by Source, 2026-2033
- Marine Oil
- Algal Oil
- Flaxseed Oil
- Others
- Europe Market Size (US$ Bn) Forecast, by End Use, 2026-2033
- Dietary Supplements
- Functional Food
- Beverages
- Infant Formula
- Pharmaceuticals
- Others
- Europe Market Size (US$ Bn) Forecast, by Sales Channel, 2026-2033
- Supermarkets / Hypermarkets
- Pharmacies & Drug Stores
- Specialty Stores
- Online Retail
- Others
- East Asia Fatty Acid Supplements Market Outlook: Historical (2020 – 2025) and Forecast (2026 – 2033)
- Key Highlights
- Pricing Analysis
- East Asia Market Size (US$ Bn) Forecast, by Country, 2026-2033
- China
- Japan
- South Korea
- East Asia Market Size (US$ Bn) Forecast, by Source, 2026-2033
- Marine Oil
- Algal Oil
- Flaxseed Oil
- Others
- East Asia Market Size (US$ Bn) Forecast, by End Use, 2026-2033
- Dietary Supplements
- Functional Food
- Beverages
- Infant Formula
- Pharmaceuticals
- Others
- East Asia Market Size (US$ Bn) Forecast, by Sales Channel, 2026-2033
- Supermarkets / Hypermarkets
- Pharmacies & Drug Stores
- Specialty Stores
- Online Retail
- Others
- South Asia & Oceania Fatty Acid Supplements Market Outlook: Historical (2020 – 2025) and Forecast (2026 – 2033)
- Key Highlights
- Pricing Analysis
- South Asia & Oceania Market Size (US$ Bn) Forecast, by Country, 2026-2033
- India
- Southeast Asia
- ANZ
- Rest of SAO
- South Asia & Oceania Market Size (US$ Bn) Forecast, by Source, 2026-2033
- Marine Oil
- Algal Oil
- Flaxseed Oil
- Others
- South Asia & Oceania Market Size (US$ Bn) Forecast, by End Use, 2026-2033
- Dietary Supplements
- Functional Food
- Beverages
- Infant Formula
- Pharmaceuticals
- Others
- South Asia & Oceania Market Size (US$ Bn) Forecast, by Sales Channel, 2026-2033
- Supermarkets / Hypermarkets
- Pharmacies & Drug Stores
- Specialty Stores
- Online Retail
- Others
- Latin America Fatty Acid Supplements Market Outlook: Historical (2020 – 2025) and Forecast (2026 – 2033)
- Key Highlights
- Pricing Analysis
- Latin America Market Size (US$ Bn) Forecast, by Country, 2026-2033
- Brazil
- Mexico
- Rest of LATAM
- Latin America Market Size (US$ Bn) Forecast, by Source, 2026-2033
- Marine Oil
- Algal Oil
- Flaxseed Oil
- Others
- Latin America Market Size (US$ Bn) Forecast, by End Use, 2026-2033
- Dietary Supplements
- Functional Food
- Beverages
- Infant Formula
- Pharmaceuticals
- Others
- Latin America Market Size (US$ Bn) Forecast, by Sales Channel, 2026-2033
- Supermarkets / Hypermarkets
- Pharmacies & Drug Stores
- Specialty Stores
- Online Retail
- Others
- Middle East & Africa Fatty Acid Supplements Market Outlook: Historical (2020 – 2025) and Forecast (2026 – 2033)
- Key Highlights
- Pricing Analysis
- Middle East & Africa Market Size (US$ Bn) Forecast, by Country, 2026-2033
- GCC Countries
- South Africa
- Northern Africa
- Rest of MEA
- Middle East & Africa Market Size (US$ Bn) Forecast, by Source, 2026-2033
- Marine Oil
- Algal Oil
- Flaxseed Oil
- Others
- Middle East & Africa Market Size (US$ Bn) Forecast, by End Use, 2026-2033
- Dietary Supplements
- Functional Food
- Beverages
- Infant Formula
- Pharmaceuticals
- Others
- Middle East & Africa Market Size (US$ Bn) Forecast, by Sales Channel, 2026-2033
- Supermarkets / Hypermarkets
- Pharmacies & Drug Stores
- Specialty Stores
- Online Retail
- Others
- Competition Landscape
- Market Share Analysis, 2025
- Market Structure
- Competition Intensity Mapping
- Competition Dashboard
- Company Profiles
- DSM-Firmenich
- Company Overview
- Product Portfolio/Offerings
- Key Financials
- SWOT Analysis
- Company Strategy and Key Developments
- BASF SE
- Croda International Plc
- ADM
- Evonik Industries AG
- Corbion NV
- GC Rieber VivoMega AS
- Omega Protein Corporation
- Nordic Naturals
- KD Pharma Group SA
- Others
- DSM-Firmenich
- Appendix
- Research Methodology
- Research Assumptions
- Acronyms and Abbreviations


- Nutraceuticals & Functional Foods
- Fatty Acid Supplements Market
Fatty Acid Supplements Market Size, Share, and Growth Forecast 2026 - 2033
Fatty Acid Supplements Market by Source (Marine Oil, Algal Oil, Flaxseed Oil, Others), by End Use (Dietary Supplements, Functional Food, Beverages, Infant Formula, Pharmaceuticals, Others), by Sales Channel (Supermarkets/Hypermarkets, Pharmacies & Drug Stores, Specialty Stores, Online Retail, Others), by Regional Analysis, 2026-203
Fatty Acid Supplements Market Size and Trend Analysis
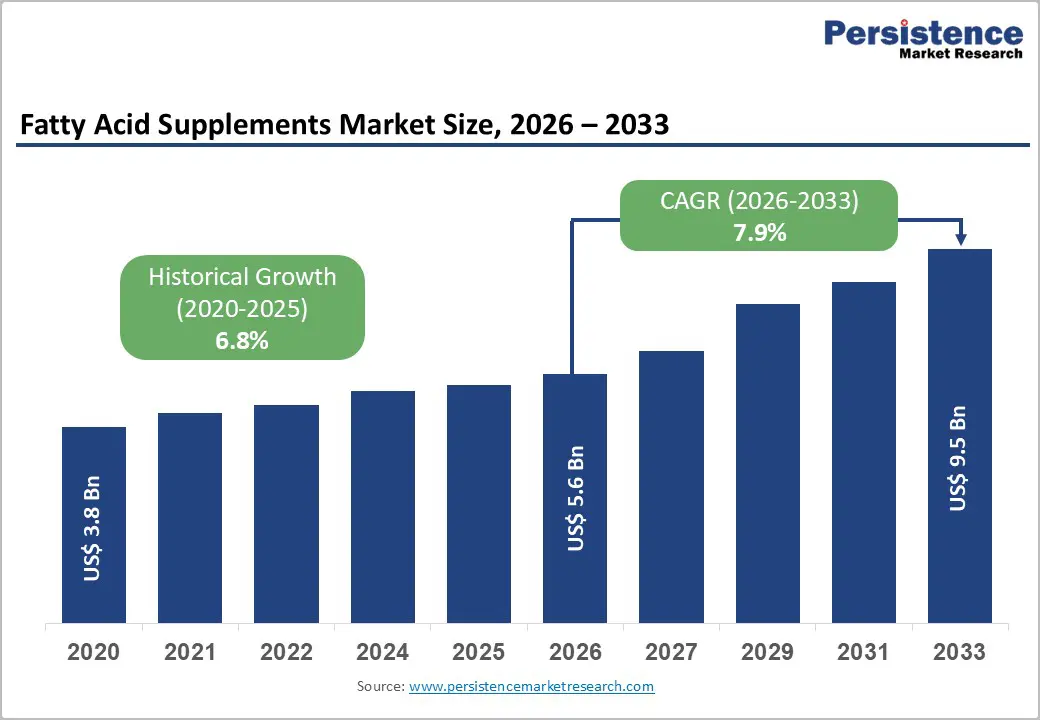
The global Fatty Acid Supplements market size is expected to be valued at US$ 5.6 billion in 2026 and projected to reach US$ 9.5 billion by 2033, growing at a CAGR of 7.9% between 2026 and 2033.
Shifting health priorities, digital retail expansion, and innovation in formulation are redefining how fatty acid supplements are produced, positioned, and consumed worldwide. The market is increasingly shaped by preventive wellness behaviors, sustainability expectations, and science-led product differentiation across regions
Key Industry Highlights
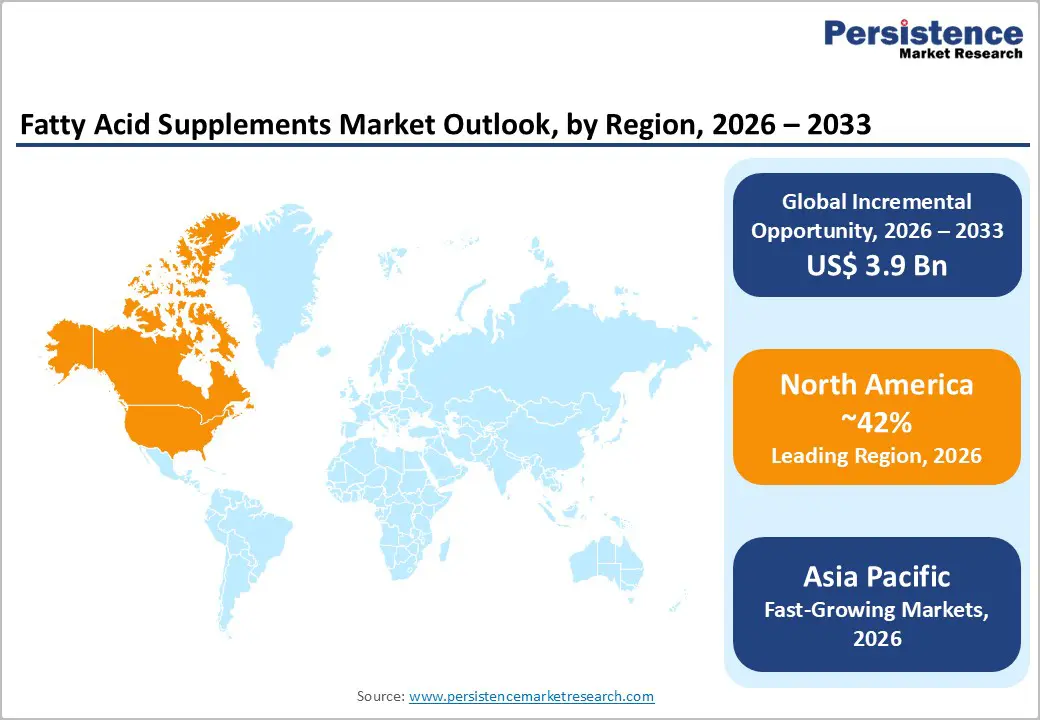
- Leading Region: North America, holding approximately 42% market share, driven by strong preventive health awareness, physician-guided supplementation, clean-label preferences, and high adoption of omega-based heart and cognitive health products.
- Fastest-Growing Region: Asia Pacific, supported by rising disposable incomes, rapid health awareness growth, premiumization of supplements, and expanding digital and pharmacy-based distribution in India, China, Japan, and South Korea.
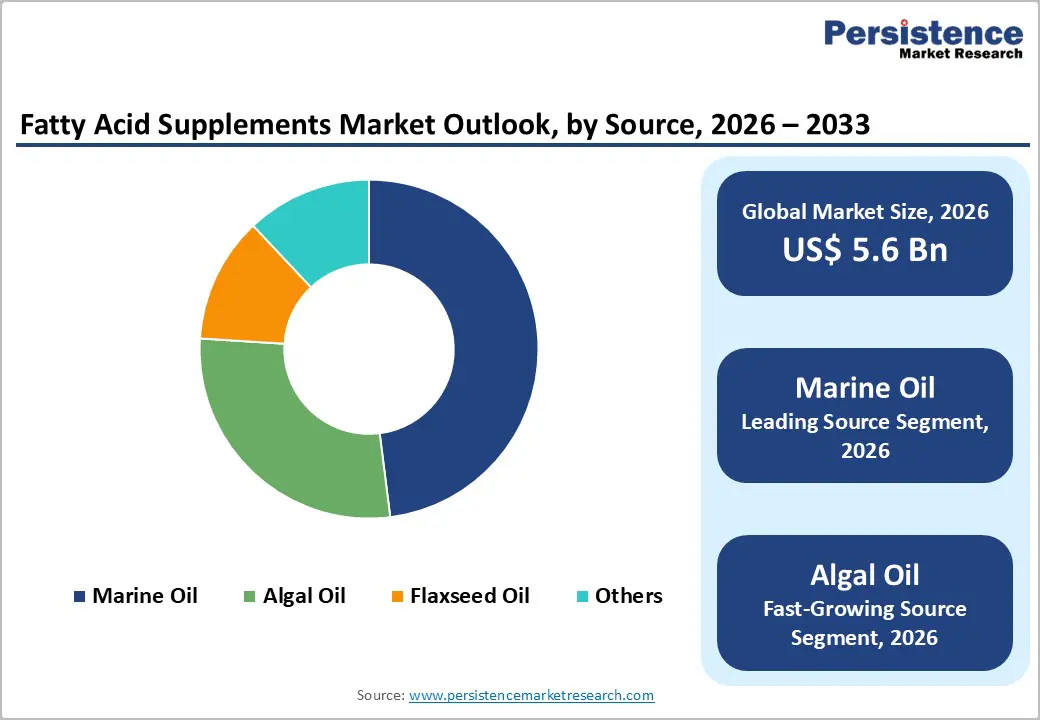
- Dominant Source Segment: Marine Oil, accounting for around 47% market share, supported by strong consumer trust, established clinical usage, high bioavailability, and formulation flexibility across capsules, liquids, and functional formats.
- Market Drivers: Rising consumer focus on preventive health and heart wellness, supported by lifestyle disease awareness, aging populations, digital health education, and daily nutrition routines emphasizing omega intake.
- Key Opportunities: Innovation in delivery formats such as gummies, chewables, and emulsions, enabling improved compliance, better sensory appeal, higher bioavailability, and clear differentiation for both startups and established brands.
- Key Developments: In August 2025, TriNutra partnered with Nutritunes to supply USP-grade ThymoQuin black seed oil for premium supplements. In August 2025, Epax launched EPAX® Evolve 05, the world’s first commercially available VLC-PUFA concentrate at Vitafoods Europe 2025.
| Key Insights | Details |
|---|---|
| Fatty Acid Supplements Market Size (2026E) | US$ 5.6 Bn |
| Market Value Forecast (2033F) | US$ 9.5 Bn |
| Projected Growth (CAGR 2026 to 2033) | 7.9% |
| Historical Market Growth (CAGR 2020 to 2025) | 6.8% |
Market Dynamics
Driver – Rising consumer focus on preventive health and heart wellness
A quiet shift toward long-term wellness is reshaping supplement choices as consumers prioritize prevention over treatment. Fatty acid supplements benefit strongly from this mindset due to their established role in supporting cardiovascular balance, lipid management, and metabolic health. Awareness around lifestyle-linked conditions pushes individuals to adopt daily nutrition routines that support heart function from an early age. Omega-rich formulations are increasingly viewed as foundational wellness tools rather than condition-specific aids.
This driver gains momentum through medical advice, digital health content, and self-tracking culture that emphasizes proactive care. Aging populations seek joint and cognitive support, while younger consumers focus on endurance and circulatory health. Fatty acids fit seamlessly into these goals because they are easy to consume and align with clean nutrition habits. As preventive health becomes a lifestyle priority, the sustained demand for fatty acid supplementation continues to expand globally.
Restraints – Sustainability and overfishing concerns
Environmental awareness is reshaping how consumers and regulators view marine-sourced ingredients. Fatty acid supplements face growing scrutiny linked to overfishing, ecosystem imbalance, and resource depletion. Concerns over fish stock sustainability influence purchasing decisions, particularly among environmentally conscious buyers. Brands relying on traditional marine oils encounter pressure to justify sourcing practices and traceability. This scrutiny raises reputational risks and complicates supply planning.
The restraint deepens as advocacy groups and policymakers demand responsible harvesting and transparent supply chains. Limited access to certified raw materials can constrain production scalability and raise costs. Smaller manufacturers struggle to secure sustainable inputs without eroding margins. As environmental accountability becomes non-negotiable, sustainability challenges remain a structural constraint that suppliers must actively address to maintain market credibility.
Opportunity – Innovation in delivery formats such as gummies and emulsions
Fresh thinking around how supplements are consumed is unlocking new growth paths for fatty acid brands. Innovative delivery formats like gummies, chewables, and emulsions address long-standing issues related to taste, swallowing difficulty, and absorption. These formats attract younger consumers and lifestyle-focused buyers who prefer convenient, enjoyable supplementation experiences. Improved bioavailability through emulsified systems further enhances perceived value.
For startups, alternative formats create clear differentiation without competing purely on ingredient sourcing. Established players leverage delivery innovation to refresh mature portfolios and expand usage occasions. Functional gummies and ready-to-mix emulsions fit seamlessly into daily routines, increasing compliance. As consumer expectations evolve toward convenience and sensory appeal, delivery innovation emerges as a high-impact opportunity across both premium and mass-market fatty acid supplements.
Category-wise Analysis
Source Analysis
Marine Oil holds approx. 47% market share as of 2025, reflecting its deep-rooted credibility in fatty acid nutrition. Fish-derived oils remain widely trusted for their natural concentration of essential omega compounds with proven bioavailability. Long-standing consumer familiarity and clinical usage reinforce preference for marine sources across heart, brain, and joint health applications.
Dominance is further supported by established supply chains and standardized refining technologies that ensure consistent quality. Marine oils integrate easily into capsules, liquids, and functional foods, offering formulation flexibility. Healthcare professionals frequently recommend marine-based fatty acids, strengthening consumer confidence. Despite emerging alternatives, marine oil continues to anchor the market due to efficacy perception, legacy usage, and strong alignment with preventive health routines worldwide.
End Use Analysis
Online Retail is projected to grow at a CAGR of 9.6% during the forecast period as digital purchasing reshapes supplement consumption. Consumers increasingly favor direct access to product information, reviews, and subscription options when buying fatty acid supplements. Online platforms allow easy comparison of formulations, dosages, and sourcing claims, supporting informed decision-making. Convenience and discreet home delivery further strengthen adoption.
Growth accelerates through brand-owned websites and curated wellness platforms offering personalized bundles and auto-replenishment. Online channels enable rapid launch of niche formulations without reliance on physical shelf space. Educational content and influencer-driven awareness build trust and engagement. As digital health ecosystems expand, online retail becomes a critical growth engine for fatty acid supplements, especially among tech-savvy and repeat-purchase consumers.
Region-wise Insights
North America Fatty Acid Supplements Market Trends and Insights
North America holds approximately 42% market share in the global Fatty Acid Supplements Market, driven by strong wellness awareness and supplement adoption. In the U.S., consumers increasingly integrate fatty acids into daily routines for heart, cognitive, and joint support. Demand rises for high-purity, traceable products aligned with preventive healthcare habits. Functional nutrition and physician-guided supplementation influence purchasing behavior.
Canada mirrors this trend with emphasis on quality assurance, clean labeling, and sustainability-linked sourcing. Retailers highlight science-backed formulations and dosage clarity. Growth of subscription models and practitioner-recommended brands strengthens market maturity. Across North America, innovation focuses on absorption efficiency and convenience formats, positioning the region as a stable, premium-driven market for fatty acid supplements.
Asia Pacific Fatty Acid Supplements Market Trends and Insights
Asia Pacific Fatty Acid Supplements Market is expected to grow at a CAGR of 9.4% as health awareness expands rapidly. In India, rising lifestyle-related health concerns increase interest in heart and metabolic support supplements. Urban consumers adopt omega products through pharmacies and digital platforms.
China shows strong momentum through preventive nutrition culture and growing trust in imported supplements. Japan emphasizes purity, precise dosing, and functional benefits, aligning fatty acids with healthy aging. South Korea integrates fatty acid supplements into beauty-from-within and cognitive wellness trends. Across the region, education-driven marketing and rising disposable incomes accelerate adoption. Diverse consumption habits and evolving retail channels position Asia Pacific as a dynamic growth region for fatty acid supplements
Market Competitive Landscape
The global Fatty Acid Supplements Market is moderately consolidated, combining multinational ingredient leaders with agile niche brands. Leading companies emphasize clean label sourcing, transparency, and third-party certifications to build trust. Sustainability commitments increasingly shape sourcing strategies and brand narratives.
Competition centers on product innovation, delivery format advancement, and formulation differentiation. Companies invest in regulatory compliance to navigate varying regional standards. Emerging players leverage focused positioning and digital reach, while established firms expand portfolios through science-backed upgrades. Government oversight on labeling and quality continues influencing competitive strategy. Success increasingly depends on balancing efficacy, ethical sourcing, and consumer education in a tightly regulated global environment.
Key Developments:
- In August 2025, TriNutra partnered with Nutritunes to supply ThymoQuin, a USP-grade black seed oil, for Nutritunes’ premium dietary supplement line, strengthening the focus on high-purity, clinically positioned botanical ingredients.
- In August 2025, at Vitafoods Europe 2025, Epax drew industry attention with the launch of EPAX® Evolve 05, the world’s first commercially available very-long-chain polyunsaturated fatty acid (VLC-PUFA) concentrate, marking a significant advancement in next-generation omega-3 nutrition solutions.
- In February 2025, Everwell Health, through its subsidiary Nutrition21, acquired all ingredient assets from Things of That Nature, Inc., including a novel plant-based cetylated fatty acid technology, esterified fatty acid compounds, and the Celadrin brand, strengthening its portfolio in joint comfort, mobility enhancement, and skincare solutions.
Companies Covered in Fatty Acid Supplements Market
- Olam International
- Kancor Ingredients Ltd.
- Mahashian Di Hatti Pvt., Ltd.
- Webb James Srl
- Visimex Joint Stock Company
- Vietnam Hanfimex Corporation
- The British Pepper & Spice Co. Ltd.
- Indian Valley Foods Pvt. Ltd
- Ajinomoto Co. Inc.
- McCormick & Company
Frequently Asked Questions
The global Fatty Acid Supplements market is expected to reach around US$ 5.6 billion in 2026.
Rising consumer focus on preventive health and heart wellness is a key demand driver in the Fatty Acid Supplements market.
North America leads the Fatty Acid Supplements market with about 42% share in 2025.
Innovation in delivery formats such as gummies and emulsions is the key opportunity in the market.
Key players include DSM-Firmenich, BASF SE, Croda International Plc, ADM, Evonik Industries AG, Corbion NV, and others


