


- Technology
- E&P Software Market
E&P Software Market Size, Share, and Growth Forecast, 2026 - 2033
E&P Software Market by Software Module (Seismic Processing & Imaging, Reservoir Characterization & Simulation, Drilling & Well Planning Software, Production Operations & Field Management Software, Resource Valuation & Economic Modeling Software, Risk Management & Compliance Tools, Portfolio Aggregation & Performance Tracking, Others), Deployment, Operation, End User, and Regional Analysis for 2026 - 2033
E&P Software Market Size and Trends Analysis
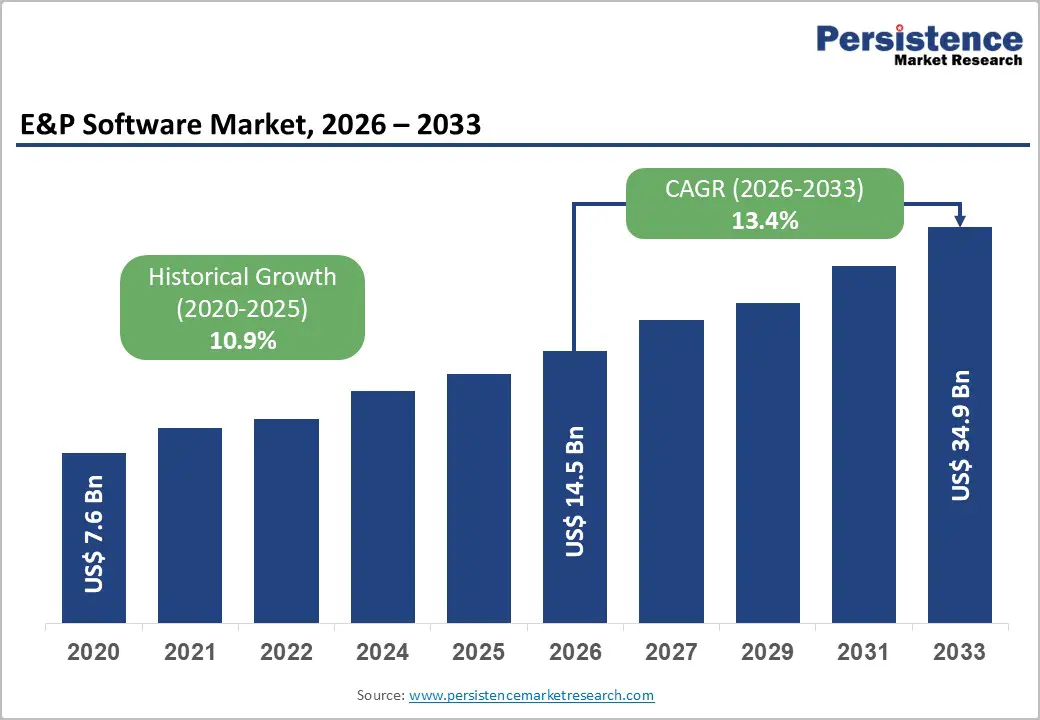
The global E&P software market size is projected to rise from US$14.5 billion in 2026 to US$34.9 billion by 2033. It is anticipated that the market will grow at a CAGR of 13.4% from 2026 to 2033, driven by the growing need for digital transformation in upstream oil and gas operations, where complex geological formations and unconventional resources demand advanced data analytics, real-time monitoring, and optimized production workflows.
Increasing investments in shale oil, tight gas, and offshore fields are pushing operators to adopt sophisticated software. Rising pressure to reduce operational costs, improve efficiency, and extend asset life further fuels software adoption.
Key Industry Highlights:
- Leading Software Module: Seismic processing & imaging dominates with over 22% market share in 2026, valued at more than US$ 3.2 Bn, driven by the need for accurate subsurface imaging, optimized exploration decisions, and reduced drilling risks. Risk Management & compliance tools are the fastest-growing, with a 17.1% CAGR, fueled by increasing regulatory scrutiny, environmental standards, and operational risk management needs.
- Leading Deployment: On-premises holds over 60% market share in 2026, valued at over US$ 8.7 Bn, and is preferred for data security, legacy system integration, and uninterrupted operations across remote/onshore, and offshore sites. Cloud-based deployment is growing fastest, with a 18.3% CAGR, driven by scalability, remote collaboration, IoT integration, and lower IT infrastructure costs.
- Leading Operation: Onshore operations command more than 62% share in 2026, valued at over US$ 9.0 Bn, due to extensive exploration, drilling, and production that require robust software support. Offshore operations are the fastest-growing, with a 16.9% CAGR, driven by deepwater project complexity, predictive maintenance, and regulatory compliance requirements.
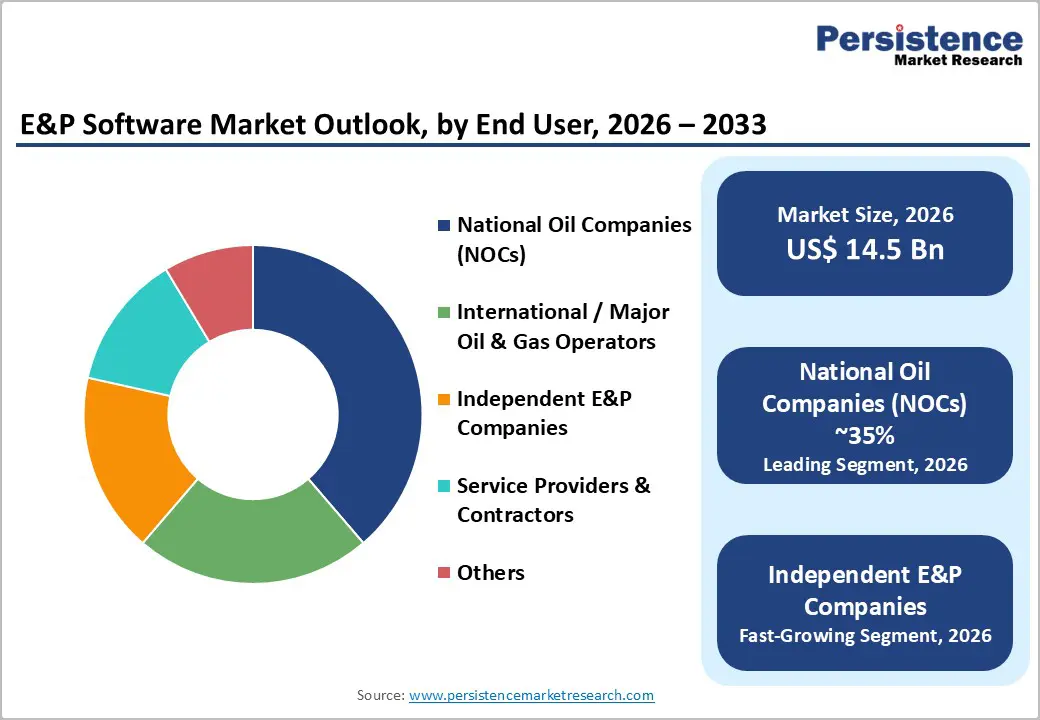
- Leading End-user: National oil companies (NOCs) hold the largest share at over 35% in 2026, valued at over US$ 5.1 Bn, driven by extensive upstream assets, regulatory compliance, and digital transformation initiatives. Independent E&P Companies grow fastest at 16.7% CAGR, seeking cost-efficient, scalable, and integrated software solutions for unconventional resource development.
- Leading Region: North America leads with over 36% share in 2026, valued at US$ 5.2 Bn, driven by the U.S. shale resource base, offshore Gulf of Mexico projects, and the adoption of mature E&P technologies. Asia Pacific grows fastest at 18.2% CAGR, fueled by China, Indonesia, Vietnam, and Thailand’s unconventional resource development and software modernization initiatives. Europe holds over 21% of the market share, driven by North Sea production, EU Green Deal compliance, and energy transition projects.
| Key Insights | Details |
|---|---|
|
E&P Software Market Size (2026E) |
US$14.5 Bn |
|
Market Value Forecast (2033F) |
US$34.9 Bn |
|
Projected Growth (CAGR 2026 to 2033) |
13.4% |
|
Historical Market Growth (CAGR 2020 to 2025) |
10.9% |
Market Dynamics
Driver - Unconventional Resource Extraction Imperative
The accelerating shift toward unconventional resources such as shale oil, tight gas, and deepwater fields is significantly driving demand for advanced E&P software. These complex reservoirs require sophisticated geophysical modeling, real-time field monitoring, and production analytics to manage geological uncertainty and high development costs. Operators increasingly rely on integrated software workflows that combine seismic interpretation, petrophysical analysis, and pressure-transient analysis. As unconventional exploration expands across North America and emerging regions such as Southeast Asia, purpose-built software has become critical for efficient asset development and risk reduction. For instance, U.S. crude oil production was forecast to average ~13.5 million barrels per day in 2025 & 2026, reflecting the continued dominance of unconventional (tight/shale) production.
Digital Transformation, Cost Efficiency, and Regulatory Compliance
E&P companies are accelerating digital transformation to optimize operations, reduce costs, and improve time-to-production amid commodity price volatility. Advanced software for seismic processing, reservoir simulation, and production management enables data integration across legacy systems, enhancing decision-making and asset productivity while lowering operating expenses. Increasingly stringent environmental, emissions, and reservoir integrity regulations are compelling operators to adopt compliance-ready software platforms. Regulatory initiatives such as the US Inflation Reduction Act and the EU Green Deal further drive demand for risk management, ESG reporting, and economic modeling solutions.
Restraint - High Capital Expenditure and Budget Constraints
The adoption of comprehensive E&P software suites requires significant upfront capital, including licensing, implementation, IT infrastructure upgrades, and ongoing training costs. Independent and small-to-mid-sized operators often face budget limitations, making it difficult to justify large software investments. Since E&P operations are capital-intensive, software spending competes directly with drilling, production, and reservoir development budgets. Periods of volatile or low oil prices further reduce discretionary IT spending, limiting adoption beyond mission-critical applications and fragmenting overall market demand.
Legacy System Integration and Operational Disruption Risks
The complexity of legacy system integration and migration is a major barrier, as E&P companies rely on deeply entrenched applications with extensive historical data. Fragmented data silos make integration with modern platforms technically challenging and risky. Concerns over operational disruption, particularly in production operations, create strong internal resistance to software upgrades. Prolonged implementation timelines, budget overruns, and delayed ROI further discourage adoption among mature operators.
Opportunity - Technological Advancements in Data Analytics and AI Integration
The integration of AI and advanced data analytics presents a major growth opportunity by transforming seismic interpretation, reservoir characterization, and production forecasting. AI-driven platforms enhance seismic image quality, detect subtle geological features, and improve forecasting accuracy by an estimated 20–30%, directly boosting asset valuation and reducing exploration risk. The growing adoption of AI-powered predictive maintenance, drilling optimization, and risk management tools is driving strong demand for analytics-intensive, hybrid-deployment E&P software solutions.
Cloud Migration and Edge Computing
Cloud migration and edge computing are driving significant growth by enabling scalable deployments, reducing capital expenditures, and supporting collaboration across geographically distributed teams. Hybrid cloud–edge architectures allow seismic and production data to be processed locally while using cloud platforms for advanced analytics, effectively addressing latency and bandwidth constraints in offshore and remote fields. The rising share of cloud deployments from roughly 40% to over 50% by 2033 is expected to drive incremental revenues through subscription-based licensing and managed services. The ability to eliminate capital-intensive high-performance computing infrastructure remains largely untapped among smaller operators, particularly in the Asia Pacific and other emerging regions, creating a sizable addressable market
Category-wise Analysis
Software Module Insights
Seismic processing & imaging dominate the global market, capturing more than 22% market share in 2026 with a value exceeding US$ 3.2 Bn, as accurate subsurface imaging is critical for identifying hydrocarbon reserves and reducing drilling risks. Operators increasingly rely on advanced seismic data analysis to optimize exploration decisions, improve reservoir modeling, and enhance production efficiency. The growing complexity of unconventional resources and deepwater projects further drives demand for high-resolution imaging and real-time processing solutions.
Risk management & compliance tools are experiencing the highest growth rate, with a 17.1% CAGR, driven by increased regulatory scrutiny, environmental standards, and safety requirements. Companies need real-time monitoring, automated reporting, and predictive risk analytics to avoid costly penalties and operational disruptions. As exploration moves into complex and high-risk environments, these tools help operators ensure compliance, manage financial and operational risks, and maintain stakeholder confidence, driving strong adoption across the sector.
Deployment Insights
On-premises hold over 60% market share in 2026, with a value exceeding US$ 8.7 Bn. Companies prioritize data security, control, and compliance due to the sensitive nature of exploration and production data. It allows real-time integration with existing IT infrastructure and legacy systems, which is critical for complex workflows. They reduce dependence on external networks in remote or offshore locations where connectivity can be limited, ensuring uninterrupted operations.
Cloud-based is expected to grow at the highest rate, with a CAGR of 18.3% as they offer flexible, scalable, and cost-efficient access to advanced analytics and real-time data across geographically dispersed assets. Operators increasingly need remote collaboration, seamless integration of IoT and sensor data, and faster decision-making capabilities, which cloud solutions provide. Cloud platforms reduce the burden of IT infrastructure management, enabling smaller and mid-sized companies to adopt sophisticated E&P software without heavy upfront investment. This aligns with the industry’s growing demand for agility, efficiency, and digital transformation in exploration and production operations.
Operation Insights
On-shore operations are expected to hold more than 62% in 2026 with a value exceeding US$ 9.0 Bn, as they involve extensive exploration, drilling, and production activities that require robust software support for efficiency and safety. Operators need advanced tools for reservoir characterization, seismic processing, and production monitoring to optimize yields and reduce costs. On-shore sites also demand real-time analytics and compliance management due to regulatory and environmental considerations. The higher volume of mature onshore fields ensures consistent software adoption for operational planning and performance tracking.
Offshore operations are expected to grow at a CAGR of 16.9%, due to the increasing complexity and cost of deepwater and ultra-deepwater projects. These operations demand advanced software for real-time monitoring, reservoir modeling, and production optimization to ensure safety, efficiency, and regulatory compliance. Remote locations require integrated digital solutions for predictive maintenance and risk management, driving higher adoption of specialized E&P software in offshore environments.
End-user Insights
National oil companies (NOCs) command the largest market share at over 35% in 2026, with a value exceeding US$ 5.1 Bn, since they operate extensive upstream assets that require robust software solutions. Their focus on improving operational efficiency, ensuring regulatory compliance, and maximizing recovery drives high demand for advanced tools. NOCs often pursue digital transformation initiatives to reduce costs and manage complex fields. Additionally, government support for NOC technology modernization initiatives drives software procurement budgets, particularly in emerging markets pursuing resource development.
Independent E&P Companies are expected to grow at a CAGR of 16.7% as they operate with leaner teams and limited resources, creating a strong need for cost-efficient, integrated software solutions. They increasingly rely on advanced analytics, real-time production monitoring, and digital field management tools to optimize exploration and production decisions. They seek flexible, scalable software that supports unconventional resource development and complex reservoir modeling, enabling faster and more informed decision-making compared to larger, vertically integrated operators.
Regional Insights
North America E&P Software Market Trends
North America holds over 36% share in 2026, reaching US$ 5.2 Bn value, led by the United States with its vast unconventional resource base and mature E&P technology infrastructure. Active shale development, especially in the Permian Basin which accounted for nearly half of U.S. crude production in 2024, and offshore projects in the Gulf of Mexico ~668 million barrels oil, 700 Bcf gas, drive demand for software-intensive drilling, production optimization, reservoir simulation, and production monitoring platforms. Stringent regulatory compliance for environmental, emissions, and safety reporting further boosts risk management software adoption. The region’s advanced technology ecosystem enables rapid uptake of AI-enhanced interpretation and cloud-based collaboration solutions.
Asia Pacific E&P Software Market Trends
Asia Pacific expected to grow at the highest rate with a CAGR of 18.2%, outpacing global growth due to accelerating E&P activities and software modernization. Key countries like China, Indonesia, Vietnam, and Thailand are driving digital transformation in upstream operations, with China investing in natural gas expansion and unconventional resource development, and India expanding exploration to meet energy security goals. Southeast Asia is increasing exploration and deepwater projects, demanding advanced seismic processing and reservoir characterization tools. Infrastructure upgrades are supporting cloud-based and next-generation software platforms, exemplified by Indonesia’s 2025 crude oil target of ~605,000 bpd and China’s Xijiang Oilfields offshore project expected to produce ~18,000 bpd by 2026, signaling rising upstream software demand.
Europe E&P Software Market Trends
Europe is expected to hold more than 21% share by 2026, driven by mature infrastructure in the North Sea, Mediterranean conventional production, and emerging alternative energy projects. EU Green Deal regulations are accelerating the adoption of software for emissions tracking, decarbonization planning, and renewable integration. Demand for production operations, enhanced oil recovery, and efficiency optimization software is rising as operators focus on field life extension and cost reduction. Advanced reservoir characterization and seismic processing tools support accurate forecasting and reserves estimation, while cloud-based solutions enable cross-border collaboration among multinational operators. Energy import security considerations further drive the deployment of software to optimize existing European assets.

Competitive Landscape
The E&P software market is moderately consolidated, dominated by a few global integrated oilfield service providers alongside specialized niche vendors. Vendors compete by offering end-to-end, integrated software suites that span seismic interpretation, reservoir modeling, drilling, and production optimization to increase customer lock-in. Continuous investment in advanced analytics, AI/ML, and cloud-based platforms is used to improve decision accuracy and reduce operators’ costs. Strategic partnerships with E&P companies, long-term licensing contracts, and bundling software with consulting and field services further strengthen competitive positioning.
Key Industry Developments:
- In May 2025, SLB launched Electris, a digitally enabled electric well completions portfolio that provides real-time production intelligence across the reservoir. The technology enables operators to optimize performance, improve reservoir management, and access reserves that conventional systems often miss, while reducing total asset costs.
- In April 2025, SLB announced a global partnership with Shell to deploy its Petrel subsurface E&P software across Shell’s worldwide assets to enhance digital capabilities and operational efficiency. The collaboration focuses on advanced seismic interpretation, AI-driven subsurface workflows, and supports both traditional exploration and energy transition initiatives.
Companies Covered in E&P Software Market
- Schlumberger Limited
- Halliburton
- Baker Hughes Company
- Emerson Electric Co.
- CGG S.A.
- ETL Solutions
- Paradigm B.V.
- ION Geophysical Corporation
- Ikon Science Limited
- KAPPA Engineering
- FEI Systems
- Others
Frequently Asked Questions
The global E&P software market is projected to be valued at US$14.5 Bn in 2026.
The need for enhanced exploration accuracy, optimized production, and efficient management of complex reservoirs to maximize recovery and reduce operational costs is a key driver of the market.
The market is expected to witness a CAGR of 13.4% from 2026 to 2033.
The adoption of advanced analytics and AI-driven solutions, and the growing demand for software supporting unconventional and deepwater resource development, is creating strong growth opportunities.
Schlumberger Limited, Halliburton, Baker Hughes Company, Emerson Electric Co., CGG S.A. are among the leading key players.


