Cloud Gaming Market

Market Study on Cloud Gaming: Industry Growth Led by North America, Followed by East Asia & Europe

Global Cloud Gaming Market Segmented By Smartphones, Tablets, Gaming Consoles, PCs & Laptops, Smart TVs, Head-Mounted Displays Type for Professional Gamers, Casual Gamers

- Table of Content -

1. Executive Summary

    1.1. Global Market Outlook

    1.2. Demand Side Trends

    1.3. Supply Side Trends

    1.4. Analysis and Recommendations

2. Market Overview

    2.1. Market Coverage / Taxonomy

    2.2. Market Definition / Scope / Limitations

3. Key Market Trends

    3.1. Key Trends Impacting the Market

    3.2. Product Innovation / Development Trends

4. Pricing Analysis

    4.1. Pricing Analysis By Cloud Gaming

    4.2. Global Average Pricing Analysis Benchmark

5. COVID-19 Impact Analysis

    5.1. Impact of COVID-19 on Cloud Gaming Growth

    5.2. Pre-COVID-19 Market Growth (2017-2019)

    5.3. Expected Recovery Scenario (Short Term/Mid Term/Long Term)

    5.4. Key Action Points for Cloud Gaming Vendors

6. Global Cloud Gaming Market Demand (in Value in US$ Mn) Analysis 2017-2021 and Forecast, 2022-2032

    6.1. Historical Market Value (US$ Mn) Analysis, 2017-2021

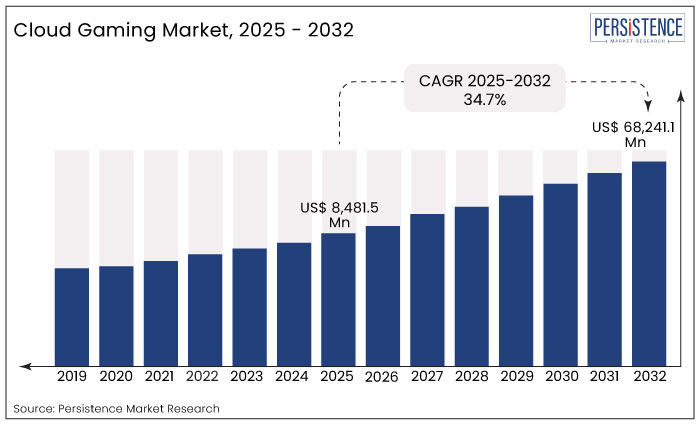
    6.2. Current and Future Market Value (US$ Mn) Projections, 2022-2032

        6.2.1. Y-o-Y Growth Trend Analysis

        6.2.2. Absolute $ Opportunity Analysis

7. Market Background

    7.1. Macro-Economic Factors

    7.2. Forecast Factors - Relevance & Impact

    7.3. Value Chain

    7.4. Market Dynamics

        7.4.1. Drivers

        7.4.2. Restraints

        7.4.3. Opportunities

8. Global Cloud Gaming Market Analysis 2017-2021 and Forecast 2022-2032, By Device Type

    8.1. Introduction / Key Findings

    8.2. Historical Market Size (US$ Mn) Analysis By Device Type, 2017 – 2021

    8.3. Current and Future Market Size (US$ Mn) Analysis and Forecast By Device Type, 2022 – 2032

        8.3.1. Smartphones

        8.3.2. Tablets

        8.3.3. Gaming Consoles

        8.3.4. PCs & Laptops

        8.3.5. Smart TVs

        8.3.6. Head Mounted Displays

    8.4. Market Attractiveness Analysis By Device Type

9. Global Cloud Gaming Market Analysis 2017-2021 and Forecast 2022-2032, by Gamer Type

    9.1. Introduction / Key Findings

    9.2. Historical Market Size (US$ Mn) Analysis By Gamer Type, 2017 - 2021

    9.3. Current and Future Market Size (US$ Mn) Analysis and Forecast By Gamer Type, 2022 - 2032

        9.3.1. Professional Gamer

        9.3.2. Casual Gamer

    9.4. Market Attractiveness Analysis By Gamer Type

10. Global Cloud Gaming Market Analysis 2017-2021 and Forecast 2022-2032, by Region

    10.1. Introduction / Key Findings

    10.2. Historical Market Size (US$ Mn) Analysis By Region, 2017 - 2021

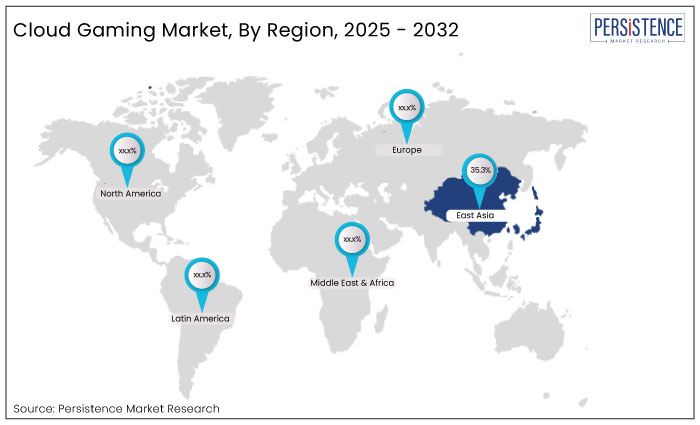
    10.3. Current and Future Market Size (US$ Mn) Analysis and Forecast By Region, 2022 - 2032

        10.3.1. North America

        10.3.2. Latin America

        10.3.3. Europe

        10.3.4. East Asia

        10.3.5. South Asia & Pacific

        10.3.6. Middle East & Africa

    10.4. Market Attractiveness Analysis By Region

11. North America Cloud Gaming Market Analysis 2017-2021 and Forecast 2022-2032

    11.1. Introduction

    11.2. Historical Market Size (US$ Mn) Trend Analysis By Market Taxonomy, 2017 - 2021

    11.3. Current and Future Market Size (US$ Mn) Forecast By Market Taxonomy, 2022 - 2032

        11.3.1. By Device Type

        11.3.2. By Gamer Type

        11.3.3. By Country

            11.3.3.1. U.S.

            11.3.3.2. Canada

    11.4. Market Attractiveness Analysis

        11.4.1. By Device Type

        11.4.2. By Gamer Type

        11.4.3. By Country

    11.5. Market Trends

    11.6. Key Market Participants - Intensity Mapping

12. Latin America Cloud Gaming Market Analysis 2017-2021 and Forecast 2022-2032

    12.1. Introduction

    12.2. Historical Market Size (US$ Mn) Trend Analysis By Market Taxonomy, 2017 - 2021

    12.3. Current and Future Market Size (US$ Mn) Forecast By Market Taxonomy, 2022 - 2032

        12.3.1. By Device Type

        12.3.2. By Gamer Type

        12.3.3. By Country

            12.3.3.1. Brazil

            12.3.3.2. Mexico

            12.3.3.3. Rest of Latin America

    12.4. Market Attractiveness Analysis

        12.4.1. By Device Type

        12.4.2. By Gamer Type

        12.4.3. By Country

    12.5. Market Trends

    12.6. Key Market Participants - Intensity Mapping

13. Europe Cloud Gaming Market Analysis 2017-2021 and Forecast 2022-2032

    13.1. Introduction

    13.2. Historical Market Size (US$ Mn) Trend Analysis By Market Taxonomy, 2017 - 2021

    13.3. Current and Future Market Size (US$ Mn) Forecast By Market Taxonomy, 2022 - 2032

        13.3.1. By Device Type

        13.3.2. By Gamer Type

        13.3.3. By Country

            13.3.3.1. Germany

            13.3.3.2. Italy

            13.3.3.3. France

            13.3.3.4. U.K.

            13.3.3.5. Spain

            13.3.3.6. BENELUX

            13.3.3.7. Russia

            13.3.3.8. Rest of Europe

    13.4. Market Attractiveness Analysis

        13.4.1. By Device Type

        13.4.2. By Gamer Type

        13.4.3. By Country

    13.5. Market Trends

    13.6. Key Market Participants - Intensity Mapping

14. South Asia & Pacific Cloud Gaming Market Analysis 2017-2021 and Forecast 2022-2032

    14.1. Introduction

    14.2. Historical Market Size (US$ Mn) Trend Analysis By Market Taxonomy, 2017 - 2021

    14.3. Current and Future Market Size (US$ Mn) Forecast By Market Taxonomy, 2022 - 2032

        14.3.1. By Device Type

        14.3.2. By Gamer Type

        14.3.3. By Country

            14.3.3.1. India

            14.3.3.2. Indonesia

            14.3.3.3. Malaysia

            14.3.3.4. Singapore

            14.3.3.5. Australia & New Zealand

            14.3.3.6. Rest of South Asia and Pacific

    14.4. Market Attractiveness Analysis

        14.4.1. By Device Type

        14.4.2. By Gamer Type

        14.4.3. By Country

    14.5. Market Trends

    14.6. Key Market Participants - Intensity Mapping

15. East Asia Cloud Gaming Market Analysis 2017-2021 and Forecast 2022-2032

    15.1. Introduction

    15.2. Historical Market Size (US$ Mn) Trend Analysis By Market Taxonomy, 2017 - 2021

    15.3. Current and Future Market Size (US$ Mn) Forecast By Market Taxonomy, 2022 - 2032

        15.3.1. By Device Type

        15.3.2. By Gamer Type

        15.3.3. By Country

            15.3.3.1. China

            15.3.3.2. Japan

            15.3.3.3. South Korea

    15.4. Market Attractiveness Analysis

        15.4.1. By Device Type

        15.4.2. By Gamer Type

        15.4.3. By Country

    15.5. Market Trends

    15.6. Key Market Participants - Intensity Mapping

16. Middle East and Africa Cloud Gaming Market Analysis 2017-2021 and Forecast 2022-2032

    16.1. Introduction

    16.2. Historical Market Size (US$ Mn) Trend Analysis By Market Taxonomy, 2017 - 2021

    16.3. Current and Future Market Size (US$ Mn) Forecast By Market Taxonomy, 2022 - 2032

        16.3.1. By Device Type

        16.3.2. By Gamer Type

        16.3.3. By Country

            16.3.3.1. GCC Countries

            16.3.3.2. Turkey

            16.3.3.3. South Africa

            16.3.3.4. Rest of Middle East and Africa

    16.4. Market Attractiveness Analysis

        16.4.1. By Device Type

        16.4.2. By Gamer Type

        16.4.3. By Country

    16.5. Market Trends

    16.6. Key Market Participants - Intensity Mapping

17. Key Countries Analysis- Cloud Gaming Market

    17.1. U.S. Cloud Gaming Market Analysis

        17.1.1. By Device Type

        17.1.2. By Gamer Type

    17.2. Canada Cloud Gaming Market Analysis

        17.2.1. By Device Type

        17.2.2. By Gamer Type

    17.3. Mexico Cloud Gaming Market Analysis

        17.3.1. By Device Type

        17.3.2. By Gamer Type

    17.4. Brazil Cloud Gaming Market Analysis

        17.4.1. By Device Type

        17.4.2. By Gamer Type

    17.5. Germany Cloud Gaming Market Analysis

        17.5.1. By Device Type

        17.5.2. By Gamer Type

    17.6. Italy Cloud Gaming Market Analysis

        17.6.1. By Device Type

        17.6.2. By Gamer Type

    17.7. France Cloud Gaming Market Analysis

        17.7.1. By Device Type

        17.7.2. By Gamer Type

    17.8. U.K. Cloud Gaming Market Analysis

        17.8.1. By Device Type

        17.8.2. By Gamer Type

    17.9. Spain Cloud Gaming Market Analysis

        17.9.1. By Device Type

        17.9.2. By Gamer Type

    17.10. BENELUX Cloud Gaming Market Analysis

        17.10.1. By Device Type

        17.10.2. By Gamer Type

    17.11. Russia Cloud Gaming Market Analysis

        17.11.1. By Device Type

        17.11.2. By Gamer Type

    17.12. Rest of Europe Cloud Gaming Market Analysis

        17.12.1. By Device Type

        17.12.2. By Gamer Type

    17.13. China Cloud Gaming Market Analysis

        17.13.1. By Device Type

        17.13.2. By Gamer Type

    17.14. Japan Cloud Gaming Market Analysis

        17.14.1. By Device Type

        17.14.2. By Gamer Type

    17.15. South Korea Cloud Gaming Market Analysis

        17.15.1. By Device Type

        17.15.2. By Gamer Type

    17.16. India Cloud Gaming Market Analysis

        17.16.1. By Device Type

        17.16.2. By Gamer Type

    17.17. Malaysia Cloud Gaming Market Analysis

        17.17.1. By Device Type

        17.17.2. By Gamer Type

    17.18. Indonesia Cloud Gaming Market Analysis

        17.18.1. By Device Type

        17.18.2. By Gamer Type

    17.19. Singapore Cloud Gaming Market Analysis

        17.19.1. By Device Type

        17.19.2. By Gamer Type

    17.20. Australia and New Zealand Cloud Gaming Market Analysis

        17.20.1. By Device Type

        17.20.2. By Gamer Type

    17.21. Rest of South Asia and Pacific Cloud Gaming Market Analysis

        17.21.1. By Device Type

        17.21.2. By Gamer Type

    17.22. GCC Countries Cloud Gaming Market Analysis

        17.22.1. By Device Type

        17.22.2. By Gamer Type

    17.23. Turkey Cloud Gaming Market Analysis

        17.23.1. By Device Type

        17.23.2. By Gamer Type

    17.24. South Africa Cloud Gaming Market Analysis

        17.24.1. By Device Type

        17.24.2. By Gamer Type

    17.25. Rest of Middle East and Africa Cloud Gaming Market Analysis

        17.25.1. By Device Type

        17.25.2. By Gamer Type

18. Market Structure Analysis

    18.1. Market Analysis by Tier of Companies

    18.2. Market Concentration

    18.3. Market Share Analysis of Top Players

    18.4. Market Presence Analysis

        18.4.1. Regional footprint by Players

        18.4.2. Product footprint by Players

        18.4.3. Channel footprint by Players

19. Competition Analysis

    19.1. Competition Dashboard

    19.2. Key Strategies, By Competitors

    19.3. Competition Deep Dive

        19.3.1. Microsoft

            19.3.1.1. Business Overview

            19.3.1.2. Product Portfolio

            19.3.1.3. Profitability by Market Segments (Business Segments/Region)

            19.3.1.4. Sales Footprint

            19.3.1.5. Strategy Overview

                19.3.1.5.1. Marketing Strategy

                19.3.1.5.2. Product Strategy

                19.3.1.5.3. Channel Strategy

        19.3.2. The Gaming Project

            19.3.2.1. Business Overview

            19.3.2.2. Product Portfolio

            19.3.2.3. Profitability by Market Segments (Business Segments/Region)

            19.3.2.4. Sales Footprint

            19.3.2.5. Strategy Overview

                19.3.2.5.1. Marketing Strategy

                19.3.2.5.2. Product Strategy

                19.3.2.5.3. Channel Strategy

        19.3.3. Google

            19.3.3.1. Business Overview

            19.3.3.2. Product Portfolio

            19.3.3.3. Profitability by Market Segments (Business Segments/Region)

            19.3.3.4. Sales Footprint

            19.3.3.5. Strategy Overview

                19.3.3.5.1. Marketing Strategy

                19.3.3.5.2. Product Strategy

                19.3.3.5.3. Channel Strategy

        19.3.4. Nvidia

            19.3.4.1. Business Overview

            19.3.4.2. Product Portfolio

            19.3.4.3. Profitability by Market Segments (Business Segments/Region)

            19.3.4.4. Sales Footprint

            19.3.4.5. Strategy Overview

                19.3.4.5.1. Marketing Strategy

                19.3.4.5.2. Product Strategy

                19.3.4.5.3. Channel Strategy

        19.3.5. Parasec

            19.3.5.1. Business Overview

            19.3.5.2. Product Portfolio

            19.3.5.3. Profitability by Market Segments (Business Segments/Region)

            19.3.5.4. Sales Footprint

            19.3.5.5. Strategy Overview

                19.3.5.5.1. Marketing Strategy

                19.3.5.5.2. Product Strategy

                19.3.5.5.3. Channel Strategy

        19.3.6. Shadow.tech

            19.3.6.1. Business Overview

            19.3.6.2. Product Portfolio

            19.3.6.3. Profitability by Market Segments (Business Segments/Region)

            19.3.6.4. Sales Footprint

            19.3.6.5. Strategy Overview

                19.3.6.5.1. Marketing Strategy

                19.3.6.5.2. Product Strategy

                19.3.6.5.3. Channel Strategy

        19.3.7. Polystream

            19.3.7.1. Business Overview

            19.3.7.2. Product Portfolio

            19.3.7.3. Profitability by Market Segments (Business Segments/Region)

            19.3.7.4. Sales Footprint

            19.3.7.5. Strategy Overview

                19.3.7.5.1. Marketing Strategy

                19.3.7.5.2. Product Strategy

                19.3.7.5.3. Channel Strategy

        19.3.8. Playgiga

            19.3.8.1. Business Overview

            19.3.8.2. Product Portfolio

            19.3.8.3. Profitability by Market Segments (Business Segments/Region)

            19.3.8.4. Sales Footprint

            19.3.8.5. Strategy Overview

                19.3.8.5.1. Marketing Strategy

                19.3.8.5.2. Product Strategy

                19.3.8.5.3. Channel Strategy

        19.3.9. Amazon

            19.3.9.1. Business Overview

            19.3.9.2. Product Portfolio

            19.3.9.3. Profitability by Market Segments (Business Segments/Region)

            19.3.9.4. Sales Footprint

            19.3.9.5. Strategy Overview

                19.3.9.5.1. Marketing Strategy

                19.3.9.5.2. Product Strategy

                19.3.9.5.3. Channel Strategy

        19.3.10. Playkey

            19.3.10.1. Business Overview

            19.3.10.2. Product Portfolio

            19.3.10.3. Profitability by Market Segments (Business Segments/Region)

            19.3.10.4. Sales Footprint

            19.3.10.5. Strategy Overview

                19.3.10.5.1. Marketing Strategy

                19.3.10.5.2. Product Strategy

                19.3.10.5.3. Channel Strategy

        19.3.11. Ubisoft

            19.3.11.1. Business Overview

            19.3.11.2. Product Portfolio

            19.3.11.3. Profitability by Market Segments (Business Segments/Region)

            19.3.11.4. Sales Footprint

            19.3.11.5. Strategy Overview

                19.3.11.5.1. Marketing Strategy

                19.3.11.5.2. Product Strategy

                19.3.11.5.3. Channel Strategy

        19.3.12. Nintendo

            19.3.12.1. Business Overview

            19.3.12.2. Product Portfolio

            19.3.12.3. Profitability by Market Segments (Business Segments/Region)

            19.3.12.4. Sales Footprint

            19.3.12.5. Strategy Overview

                19.3.12.5.1. Marketing Strategy

                19.3.12.5.2. Product Strategy

                19.3.12.5.3. Channel Strategy

        19.3.13. Others

            19.3.13.1. Business Overview

            19.3.13.2. Product Portfolio

            19.3.13.3. Profitability by Market Segments (Business Segments/Region)

            19.3.13.4. Sales Footprint

            19.3.13.5. Strategy Overview

                19.3.13.5.1. Marketing Strategy

                19.3.13.5.2. Product Strategy

                19.3.13.5.3. Channel Strategy

20. Assumptions and Acronyms Used

21. Research Methodology

Sample Report

FREE Report Sample is Available

In-depth report coverage is now just a few seconds away

Download PDF Get FREE Report Sample

- List Of Table -

Table 01: Global Cloud Gaming Market Value (US$ Mn) Analysis (2017 – 2021) By Device Type

Table 02: Global Cloud Gaming Market Value (US$ Mn) Forecast (2022 – 2032) By Device Type

Table 03: Global Cloud Gaming Market Value (US$ Mn) Analysis (2017 – 2021) By Gamer Type

Table 04: Global Cloud Gaming Market Value (US$ Mn) Forecast (2022 – 2032) By Gamer Type

Table 05: Global Cloud Gaming Market Value (US$ Mn) Analysis (2017 – 2021) by Region

Table 06: Global Cloud Gaming Market Value (US$ Mn) Forecast (2022 – 2032) by Region

Table 07: North America Cloud Gaming Market Value (US$ Mn) Analysis (2017 – 2021) By Device Type

Table 09: North America Cloud Gaming Market Value (US$ Mn) Forecast (2022 – 2032) By Device Type

Table 10: North America Cloud Gaming Market Value (US$ Mn) Analysis (2017 – 2021) By Gamer Type (1/2)

Table 11: North America Cloud Gaming Market Value (US$ Mn) Forecast (2022 – 2032) By Gamer Type (1/2)

Table 12: North America Cloud Gaming Market Value (US$ Mn) Analysis (2017 – 2021) by Country

Table 13: North America Cloud Gaming Market Value (US$ Mn) Forecast (2022 – 2032) by Country

Table 14: Latin America Cloud Gaming Market Value (US$ Mn) Analysis (2017 – 2021) By Device Type

Table 15: Latin America Cloud Gaming Market Value (US$ Mn) Forecast (2022 – 2032) By Device Type

Table 16: Latin America Cloud Gaming Market Value (US$ Mn) Analysis (2017 – 2021) By Gamer Type (1/2)

Table 17: Latin America Cloud Gaming Market Value (US$ Mn) Forecast (2022 – 2032) By Gamer Type (1/2)

Table 18: Latin America Cloud Gaming Market Value (US$ Mn) Analysis (2017 – 2021) by Country

Table 19: Latin America Cloud Gaming Market Value (US$ Mn) Forecast (2022 – 2032) by Country

Table 20: Europe Cloud Gaming Market Value (US$ Mn) Analysis (2017 – 2021) By Device Type

Table 21: Europe Cloud Gaming Market Value (US$ Mn) Forecast (2022 – 2032) By Device Type

Table 22: Europe Cloud Gaming Market Value (US$ Mn) Analysis (2017 – 2021) By Gamer Type

Table 23: Europe Cloud Gaming Market Value (US$ Mn) Forecast (2022 – 2032) By Gamer Type

Table 24: Europe Cloud Gaming Market Value (US$ Mn) Analysis (2017 – 2021) by Country

Table 25: Europe Cloud Gaming Market Value (US$ Mn) Forecast (2022 – 2032) by Country

Table 26: South Asia & Pacific Cloud Gaming Market Value (US$ Mn) Analysis (2017 – 2021) By Device Type

Table 27: South Asia & Pacific Cloud Gaming Market Value (US$ Mn) Forecast (2022 – 2032) By Device Type

Table 28: South Asia & Pacific Cloud Gaming Market Value (US$ Mn) Analysis (2017 – 2021) By Gamer Type

Table 29: South Asia & Pacific Cloud Gaming Market Value (US$ Mn) Forecast (2022 – 2032) By Gamer Type

Table 30: South Asia & Pacific Cloud Gaming Market Value (US$ Mn) Analysis (2017 – 2021) by Country

Table 31: South Asia & Pacific Cloud Gaming Market Value (US$ Mn) Forecast (2022 – 2032) by Country

Table 32: East Asia Cloud Gaming Market Value (US$ Mn) Analysis (2017 – 2021) By Device Type

Table 33: East Asia Cloud Gaming Market Value (US$ Mn) Forecast (2022 – 2032) By Device Type

Table 34: East Asia Cloud Gaming Market Value (US$ Mn) Analysis (2017 – 2021) By Gamer Type

Table 35: East Asia Cloud Gaming Market Value (US$ Mn) Forecast (2022 – 2032) By Gamer Type

Table 36: East Asia Cloud Gaming Market Value (US$ Mn) Analysis (2017 – 2021) by Country

Table 37: East Asia Cloud Gaming Market Value (US$ Mn) Forecast (2022 – 2032) by Country

Table 38: Middle East and Africa Cloud Gaming Market Value (US$ Mn) Analysis (2017 – 2021) By Device Type

Table 39: Middle East and Africa Cloud Gaming Market Value (US$ Mn) Forecast (2022 – 2032) By Device Type

Table 40: Middle East and Africa Cloud Gaming Market Value (US$ Mn) Analysis (2017 – 2021) By Gamer Type

Table 41: Middle East and Africa Cloud Gaming Market Value (US$ Mn) Forecast (2022 – 2032) By Gamer Type

Table 42: Middle East and Africa Cloud Gaming Market Value (US$ Mn) Analysis (2017 – 2021) by Country

Table 43: Middle East and Africa Cloud Gaming Market Value (US$ Mn) Forecast (2022 – 2032) by Country

Custom Report Cover

Make This Report Your Own

Take Advantage of Intelligence Tailored to your Business Objective

> Get a Customized Version

- List Of Chart -

Figure 01: Global Cloud Gaming Market Size (US$ Mn) and Y-o-Y Growth Rate from 2022-2032

Figure 02: Global Cloud Gaming Market Size and Y-o-Y Growth Rate from 2022-2032

Figure 03: Global Cloud Gaming Market Value (US$ Mn), 2017-2021

Figure 04: Global Cloud Gaming Market Value (US$ Mn), 2022-2032

Figure 05: Global Cloud Gaming Market Value Share Analysis (2022 – 2032) By Device Type

Figure 06: Global Cloud Gaming Market Value Y-o-Y Growth Trend Analysis (2019 – 2032) By Device Type

Figure 07: Global Cloud Gaming Market Attractiveness By Device Type

Figure 08: Global Cloud Gaming Market Value Share Analysis (2022 – 2032) By Gamer Type

Figure 09: Global Cloud Gaming Market Value Y-o-Y Growth Trend Analysis (2019 – 2032) By Gamer Type

Figure 10: Global Cloud Gaming Market Attractiveness By Gamer Type

Figure 11: Global Cloud Gaming Market Value Share Analysis (2022 – 2032) by Region

Figure 12: Global Cloud Gaming Market Value Y-o-Y Growth Trend Analysis (2019 – 2032) by Region

Figure 13: Global Cloud Gaming Market Attractiveness by Region

Figure 14: North America Cloud Gaming Market Absolute $ Opportunity (US$ Mn), 2017 – 2032

Figure 15: Latin America Cloud Gaming Market Absolute $ Opportunity (US$ Mn), 2017 – 2032

Figure 16: Europe Cloud Gaming Market Absolute $ Opportunity (US$ Mn), 2017 – 2032

Figure 17: East Asia Cloud Gaming Market Absolute $ Opportunity (US$ Mn), 2017 – 2032

Figure 18: South Asia & Pacific Cloud Gaming Market Absolute $ Opportunity (US$ Mn), 2017 – 2032

Figure 19: Middle East & Africa Cloud Gaming Market Absolute $ Opportunity (US$ Mn), 2017 – 2032

Figure 20: North America Cloud Gaming Market Value (US$ Mn), 2017-2021

Figure 21: North America Cloud Gaming Market Value (US$ Mn), 2022-2032

Figure 22: North America Cloud Gaming Market Value Share Analysis (2022 – 2032) By Device Type

Figure 23: North America Cloud Gaming Market Value Y-o-Y Growth Trend Analysis (2019 – 2032) By Device Type

Figure 24: North America Cloud Gaming Market Attractiveness By Device Type

Figure 25: North America Cloud Gaming Market Value Share Analysis (2022 – 2032) By Gamer Type

Figure 26: North America Cloud Gaming Market Value Y-o-Y Growth Trend Analysis (2019 – 2032) By Gamer Type

Figure 27: North America Cloud Gaming Market Attractiveness By Gamer Type

Figure 28: North America Cloud Gaming Market Value Share Analysis (2022 – 2032) by Country

Figure 29: North America Cloud Gaming Market Value Y-o-Y Growth Trend Analysis (2019 – 2032) by Country

Figure 30: North America Cloud Gaming Market Attractiveness by Country

Figure 31: U.S. Cloud Gaming Market Absolute $ Opportunity (US$ Mn), 2017 – 2032

Figure 32: Canada Cloud Gaming Market Absolute $ Opportunity (US$ Mn), 2017 – 2032

Figure 33: Latin America Cloud Gaming Market Value (US$ Mn), 2017-2021

Figure 34: Latin America Cloud Gaming Market Value (US$ Mn), 2022-2032

Figure 35: Latin America Cloud Gaming Market Value Share Analysis (2022 – 2032) By Device Type

Figure 36: Latin America Cloud Gaming Market Value Y-o-Y Growth Trend Analysis (2019 – 2032) By Device Type

Figure 37: Latin America Cloud Gaming Market Attractiveness By Device Type

Figure 38: Latin America Cloud Gaming Market Value Share Analysis (2022 – 2032) By Gamer Type

Figure 39: Latin America Cloud Gaming Market Value Y-o-Y Growth Trend Analysis (2019 – 2032) By Gamer Type

Figure 40: Latin America Cloud Gaming Market Attractiveness By Gamer Type

Figure 41: Latin America Cloud Gaming Market Value Share Analysis (2022 – 2032) by Country

Figure 42: Latin America Cloud Gaming Market Value Y-o-Y Growth Trend Analysis (2019 – 2032) by Country

Figure 43: Latin America Cloud Gaming Market Attractiveness by Country

Figure 44: Brazil Cloud Gaming Market Absolute $ Opportunity (US$ Mn), 2017 – 2032

Figure 45: Mexico Cloud Gaming Market Absolute $ Opportunity (US$ Mn), 2017 – 2032

Figure 46: Rest of Latin America Cloud Gaming Market Absolute $ Opportunity (US$ Mn), 2017 – 2032

Figure 47: Europe Cloud Gaming Market Value (US$ Mn), 2017-2021

Figure 48: Europe Cloud Gaming Market Value (US$ Mn), 2022-2032

Figure 49: Europe Cloud Gaming Market Value Share Analysis (2022 – 2032) By Device Type

Figure 50: Europe Cloud Gaming Market Value Y-o-Y Growth Trend Analysis (2019 – 2032) By Device Type

Figure 51: Europe Cloud Gaming Market Attractiveness By Device Type

Figure 52: Europe Cloud Gaming Market Value Share Analysis (2022 – 2032) By Gamer Type

Figure 53: Europe Cloud Gaming Market Value Y-o-Y Growth Trend Analysis (2019 – 2032) By Gamer Type

Figure 54: Europe Cloud Gaming Market Attractiveness By Gamer Type

Figure 55: Europe Cloud Gaming Market Value Share Analysis (2022 – 2032) by Country

Figure 56: Europe Cloud Gaming Market Value Y-o-Y Growth Trend Analysis (2019 – 2032) by Country

Figure 57: Europe Cloud Gaming Market Attractiveness by Country

Figure 58: Germany Cloud Gaming Market Absolute $ Opportunity (US$ Mn), 2017 – 2032

Figure 59: Italy Cloud Gaming Market Absolute $ Opportunity (US$ Mn), 2017 – 2032

Figure 60: France Cloud Gaming Market Absolute $ Opportunity (US$ Mn), 2017 – 2032

Figure 61: U.K. Cloud Gaming Market Absolute $ Opportunity (US$ Mn), 2017 – 2032

Figure 62: Spain Cloud Gaming Market Absolute $ Opportunity (US$ Mn), 2017 – 2032

Figure 63: BENELUX Cloud Gaming Market Absolute $ Opportunity (US$ Mn), 2017 – 2032

Figure 64: Russia Cloud Gaming Market Absolute $ Opportunity (US$ Mn), 2017 – 2032

Figure 65: Rest of Europe Cloud Gaming Market Absolute $ Opportunity (US$ Mn), 2017 – 2032

Figure 66: South Asia & Pacific Cloud Gaming Market Value (US$ Mn), 2017-2021

Figure 67: South Asia & Pacific Cloud Gaming Market Value (US$ Mn), 2022-2032

Figure 68: South Asia & Pacific Cloud Gaming Market Value Share Analysis (2022 – 2032) By Device Type

Figure 69: South Asia & Pacific Cloud Gaming Market Value Y-o-Y Growth Trend Analysis (2019 – 2032) By Device Type

Figure 70: South Asia & Pacific Cloud Gaming Market Attractiveness By Device Type

Figure 71: South Asia & Pacific Cloud Gaming Market Value Share Analysis (2022 – 2032) By Gamer Type

Figure 72: South Asia & Pacific Cloud Gaming Market Value Y-o-Y Growth Trend Analysis (2019 – 2032) By Gamer Type

Figure 73: South Asia & Pacific Cloud Gaming Market Attractiveness By Gamer Type

Figure 74: South Asia & Pacific Cloud Gaming Market Value Share Analysis (2022 – 2032) by Country

Figure 75: South Asia & Pacific Cloud Gaming Market Value Y-o-Y Growth Trend Analysis (2019 – 2032) by Country

Figure 76: South Asia & Pacific Cloud Gaming Market Attractiveness by Country

Figure 77: India Cloud Gaming Market Absolute $ Opportunity (US$ Mn), 2017 – 2032

Figure 78: Indonesia Cloud Gaming Market Absolute $ Opportunity (US$ Mn), 2017 – 2032

Figure 79: Malaysia Cloud Gaming Market Absolute $ Opportunity (US$ Mn), 2017 – 2032

Figure 80: Singapore Cloud Gaming Market Absolute $ Opportunity (US$ Mn), 2017 – 2032

Figure 81: Australia& New Zealand Cloud Gaming Market Absolute $ Opportunity (US$ Mn), 2017 – 2032

Figure 82: Rest of South Asia & Pacific Cloud Gaming Market Absolute $ Opportunity (US$ Mn), 2017 – 2032

Figure 83: East Asia Cloud Gaming Market Value (US$ Mn), 2017-2021

Figure 84: East Asia Cloud Gaming Market Value (US$ Mn), 2022-2032

Figure 85: East Asia Cloud Gaming Market Value Share Analysis (2022 – 2032) By Device Type

Figure 86: East Asia Cloud Gaming Market Value Y-o-Y Growth Trend Analysis (2019 – 2032) By Device Type

Figure 87: East Asia Cloud Gaming Market Attractiveness By Device Type

Figure 88: East Asia Cloud Gaming Market Value Share Analysis (2022 – 2032) By Gamer Type

Figure 89: East Asia Cloud Gaming Market Value Y-o-Y Growth Trend Analysis (2019 – 2032) By Gamer Type

Figure 90: East Asia Cloud Gaming Market Attractiveness By Gamer Type

Figure 91: East Asia Cloud Gaming Market Value Share Analysis (2022 – 2032) by Country

Figure 92: East Asia Cloud Gaming Market Value Y-o-Y Growth Trend Analysis (2019 – 2032) by Country

Figure 93: East Asia Cloud Gaming Market Attractiveness by Country

Figure 94: China Cloud Gaming Market Absolute $ Opportunity (US$ Mn), 2017 – 2032

Figure 95: Japan Cloud Gaming Market Absolute $ Opportunity (US$ Mn), 2017 – 2032

Figure 96: South Korea Cloud Gaming Market Absolute $ Opportunity (US$ Mn), 2017 – 2032

Figure 97: Middle East and Africa Cloud Gaming Market Value (US$ Mn), 2017-2021

Figure 98: Middle East and Africa Cloud Gaming Market Value (US$ Mn), 2022-2032

Figure 99: Middle East and Africa Cloud Gaming Market Value Share Analysis (2022 – 2032) By Device Type

Figure 100: Middle East and Africa Cloud Gaming Market Value Y-o-Y Growth Trend Analysis (2019 – 2032) By Device Type

Figure 101: Middle East and Africa Cloud Gaming Market Attractiveness By Device Type

Figure 102: Middle East and Africa Cloud Gaming Market Value Share Analysis (2022 – 2032) By Gamer Type

Figure 103: Middle East and Africa Cloud Gaming Market Value Y-o-Y Growth Trend Analysis (2019 – 2032) By Gamer Type

Figure 104: Middle East and Africa Cloud Gaming Market Attractiveness By Gamer Type

Figure 105: Middle East and Africa Cloud Gaming Market Value Share Analysis (2022 – 2032) by Country

Figure 106: Middle East and Africa Cloud Gaming Market Value Y-o-Y Growth Trend Analysis (2019 – 2032) by Country

Figure 107: Middle East and Africa Cloud Gaming Market Attractiveness by Country

Figure 108: GCC Countries Cloud Gaming Market Absolute $ Opportunity (US$ Mn), 2017 – 2032

Figure 109: Turkey Cloud Gaming Market Absolute $ Opportunity (US$ Mn), 2017 – 2032

Figure 110: South Africa Cloud Gaming Market Absolute $ Opportunity (US$ Mn), 2017 – 2032

Figure 111: Rest of Middle East and Africa Cloud Gaming Market Absolute $ Opportunity (US$ Mn), 2017 – 2032

This site uses cookies, including third-party cookies, that help us to provide and improve our services. Privacy Policy
Google translate