

- Executive Summary
- Global Candied & Semi-candied Fruits Market Snapshot, 2025 and 2032
- Market Opportunity Assessment, 2025 - 2032, US$ Mn
- Key Market Trends
- Future Market Projections
- Premium Market Insights
- Industry Developments and Key Market Events
- PMR Analysis and Recommendations
- Market Overview
- Market Scope and Definition
- Market Dynamics
- Drivers
- Restraints
- Opportunity
- Challenges
- Key Trends
- Macro-Economic Factors
- Global Sectorial Outlook
- Global GDP Growth Outlook
- COVID-19 Impact Analysis
- Forecast Factors - Relevance and Impact
- Value Added Insights
- Product Adoption Analysis
- Regulatory Landscape
- Value Chain Analysis
- Consumer Behavior Analysis
- Key Deals and Mergers
- PESTLE Analysis
- Porter’s Five Force Analysis
- Price Trend Analysis, 2019 - 2032
- Key Highlights
- Key Factors Impacting Product Prices
- Pricing Analysis, By Form
- Regional Prices and Product Preferences
- Global Candied & Semi-candied Fruits Market Outlook:
- Key Highlights
- Market Volume (Tons) Projections
- Market Size (US$ Mn) and Y-o-Y Growth
- Absolute $ Opportunity
- Market Size (US$ Mn) Analysis and Forecast
- Historical Market Size (US$ Mn) Analysis, 2019-2024
- Market Size (US$ Mn) Analysis and Forecast, 2025-2032
- Global Candied & Semi-candied Fruits Market Outlook: Form
- Introduction / Key Findings
- Historical Market Size (US$ Mn) and Volume (Tons) Analysis, By Form, 2019-2024
- Market Size (US$ Mn) and Volume (Tons) Analysis and Forecast, By Form, 2025-2032
- Whole/Intact
- Chopped/Diced
- Fruit Peels
- Market Attractiveness Analysis: Form
- Global Candied & Semi-candied Fruits Market Outlook: Application
- Introduction / Key Findings
- Historical Market Size (US$ Mn) Analysis, By Application, 2019-2024
- Market Size (US$ Mn) Analysis and Forecast, By Application, 2025-2032
- Bakery
- Pastries
- Ice Cream
- Yogurt
- Market Attractiveness Analysis: Application
- Global Candied & Semi-candied Fruits Market Outlook: Distribution Channel
- Introduction / Key Findings
- Historical Market Size (US$ Mn) Analysis, By Distribution Channel, 2019-2024
- Market Size (US$ Mn) Analysis and Forecast, By Distribution Channel, 2025-2032
- Traditional Trade
- Modern Trade
- Industrial
- Foodservice
- Market Attractiveness Analysis: Distribution Channel
- Key Highlights
- Global Candied & Semi-candied Fruits Market Outlook: Region
- Key Highlights
- Historical Market Size (US$ Mn) and Volume (Tons) Analysis, By Region, 2019-2024
- Market Size (US$ Mn) and Volume (Tons) Analysis and Forecast, By Region, 2025-2032
- North America
- Europe
- East Asia
- South Asia and Oceania
- Latin America
- Middle East & Africa
- Market Attractiveness Analysis: Region
- North America Candied & Semi-candied Fruits Market Outlook:
- Key Highlights
- Historical Market Size (US$ Mn) and Volume (Tons) Analysis, By Market, 2019-2024
- By Country
- By Form
- By Application
- By Distribution Channel
- Market Size (US$ Mn) Analysis and Forecast, By Country, 2025-2032
- U.S.
- Canada
- Market Size (US$ Mn) and Volume (Tons) Analysis and Forecast, By Form, 2025-2032
- Whole/Intact
- Chopped/Diced
- Fruit Peels
- Market Size (US$ Mn) Analysis and Forecast, By Application, 2025-2032
- Bakery
- Pastries
- Ice Cream
- Yogurt
- Market Size (US$ Mn) Analysis and Forecast, By Distribution Channel, 2025-2032
- Traditional Trade
- Modern Trade
- Industrial
- Foodservice
- Market Attractiveness Analysis
- Europe Candied & Semi-candied Fruits Market Outlook:
- Key Highlights
- Historical Market Size (US$ Mn) and Volume (Tons) Analysis, By Market, 2019-2024
- By Country
- By Form
- By Application
- By Distribution Channel
- Market Size (US$ Mn) Analysis and Forecast, By Country, 2025-2032
- Germany
- France
- U.K.
- Italy
- Spain
- Russia
- Rest of Europe
- Market Size (US$ Mn) and Volume (Tons) Analysis and Forecast, By Form, 2025-2032
- Whole/Intact
- Chopped/Diced
- Fruit Peels
- Market Size (US$ Mn) Analysis and Forecast, By Application, 2025-2032
- Bakery
- Pastries
- Ice Cream
- Yogurt
- Market Size (US$ Mn) Analysis and Forecast, By Distribution Channel, 2025-2032
- Traditional Trade
- Modern Trade
- Industrial
- Foodservice
- Market Attractiveness Analysis
- East Asia Candied & Semi-candied Fruits Market Outlook:
- Key Highlights
- Historical Market Size (US$ Mn) and Volume (Tons) Analysis, By Market, 2019-2024
- By Country
- By Form
- By Application
- By Distribution Channel
- Market Size (US$ Mn) Analysis and Forecast, By Country, 2025-2032
- China
- Japan
- South Korea
- Market Size (US$ Mn) and Volume (Tons) Analysis and Forecast, By Form, 2025-2032
- Whole/Intact
- Chopped/Diced
- Fruit Peels
- Market Size (US$ Mn) Analysis and Forecast, By Application, 2025-2032
- Bakery
- Pastries
- Ice Cream
- Yogurt
- Market Size (US$ Mn) Analysis and Forecast, By Distribution Channel, 2025-2032
- Traditional Trade
- Modern Trade
- Industrial
- Foodservice
- Market Attractiveness Analysis
- South Asia & Oceania Candied & Semi-candied Fruits Market Outlook:
- Key Highlights
- Historical Market Size (US$ Mn) and Volume (Tons) Analysis, By Market, 2019-2024
- By Country
- By Form
- By Application
- By Distribution Channel
- Market Size (US$ Mn) Analysis and Forecast, By Country, 2025-2032
- India
- Southeast Asia
- ANZ
- Rest of South Asia & Oceania
- Market Size (US$ Mn) and Volume (Tons) Analysis and Forecast, By Form, 2025-2032
- Whole/Intact
- Chopped/Diced
- Fruit Peels
- Market Size (US$ Mn) Analysis and Forecast, By Application, 2025-2032
- Bakery
- Pastries
- Ice Cream
- Yogurt
- Market Size (US$ Mn) Analysis and Forecast, By Distribution Channel, 2025-2032
- Traditional Trade
- Modern Trade
- Industrial
- Foodservice
- Market Attractiveness Analysis
- Latin America Candied & Semi-candied Fruits Market Outlook:
- Key Highlights
- Historical Market Size (US$ Mn) and Volume (Tons) Analysis, By Market, 2019-2024
- By Country
- By Form
- By Application
- By Distribution Channel
- Market Size (US$ Mn) Analysis and Forecast, By Country, 2025-2032
- Brazil
- Mexico
- Rest of Latin America
- Market Size (US$ Mn) and Volume (Tons) Analysis and Forecast, By Form, 2025-2032
- Whole/Intact
- Chopped/Diced
- Fruit Peels
- Market Size (US$ Mn) Analysis and Forecast, By Application, 2025-2032
- Bakery
- Pastries
- Ice Cream
- Yogurt
- Market Size (US$ Mn) Analysis and Forecast, By Distribution Channel, 2025-2032
- Traditional Trade
- Modern Trade
- Industrial
- Foodservice
- Market Attractiveness Analysis
- Middle East & Africa Candied & Semi-candied Fruits Market Outlook:
- Key Highlights
- Historical Market Size (US$ Mn) and Volume (Tons) Analysis, By Market, 2019-2024
- By Country
- By Form
- By Application
- By Distribution Channel
- Market Size (US$ Mn) Analysis and Forecast, By Country, 2025-2032
- GCC Countries
- Egypt
- South Africa
- Northern Africa
- Rest of Middle East & Africa
- Market Size (US$ Mn) and Volume (Tons) Analysis and Forecast, By Form, 2025-2032
- Whole/Intact
- Chopped/Diced
- Fruit Peels
- Market Size (US$ Mn) Analysis and Forecast, By Application, 2025-2032
- Bakery
- Pastries
- Ice Cream
- Yogurt
- Market Size (US$ Mn) Analysis and Forecast, By Distribution Channel, 2025-2032
- Traditional Trade
- Modern Trade
- Industrial
- Foodservice
- Market Attractiveness Analysis
- Competition Landscape
- Market Share Analysis, 2024
- Market Structure
- Competition Intensity Mapping By Market
- Competition Dashboard
- Company Profiles (Details - Overview, Financials, Strategy, Recent Developments)
- Andros Chef
- Overview
- Segments and Product Types
- Key Financials
- Market Developments
- Market Strategy
- AZIENDA AGRIMONTANA S.P.A.
- Cesarin S.p.A.
- Cruzilles
- F.Moreno Candied Fruits S.L.
- FRUITS ROUGES & Co.
- Gelpass group
- Giuso Guido Spa
- Italcanditi S.p.A
- ITALPROD SRL
- José María Lázaro S.A.
- Kandy
- Lazaya
- Leelanau Fruit Company
- Markidis & Co.
- SALGAR S.r.l.
- SAS SICA SICODIS
- Others
- Andros Chef
- Appendix
- Research Methodology
- Research Assumptions
- Acronyms and Abbreviations


- Processed Food
- Candied & Semi-candied Fruits Market
Candied & Semi-candied Fruits Market Size, Share, Growth, and Regional Forecast, 2025 to 2032
Candied & Semi-candied Fruits Market By Product (Whole/Intact, Chopped/Diced, Fruit Peels), Application (Bakery, Pastries, Ice Cream, Yogurt), Distribution Channel (Traditional Trade, Modern Trade, Industrial, Foodservice), and Regional Analysis for 2025 - 2032
Candied & Semi-candied Fruits Market Size and Trends Analysis
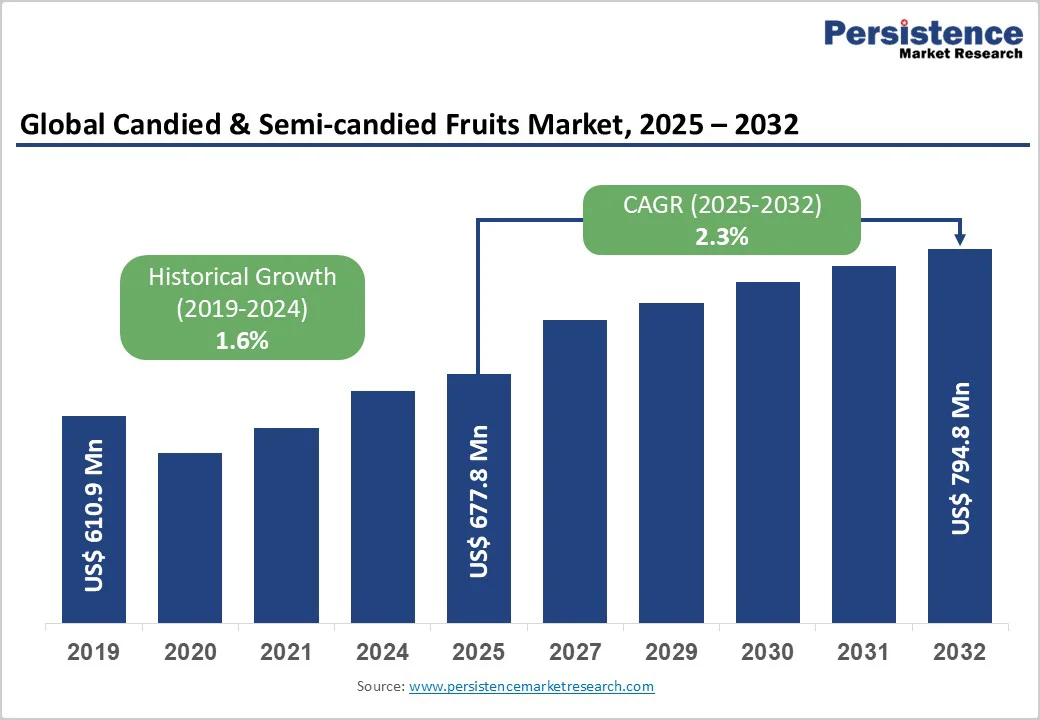
The global candied & semi-candied fruits market size is likely to be valued at US$677.8 Million in 2025 and is expected to reach US$794.8 Million by 2032, growing at a CAGR of 2.3% during the forecast period from 2025 to 2032, driven by increasing demand from the bakery and confectionery sectors, festive consumption, and preference for natural, artisanal ingredients.
Asia Pacific leads the market due to expanding bakery industries, while Europe and North America focus on premium, organic, and reduced-sugar candied fruit offerings.
Key Industry Highlights
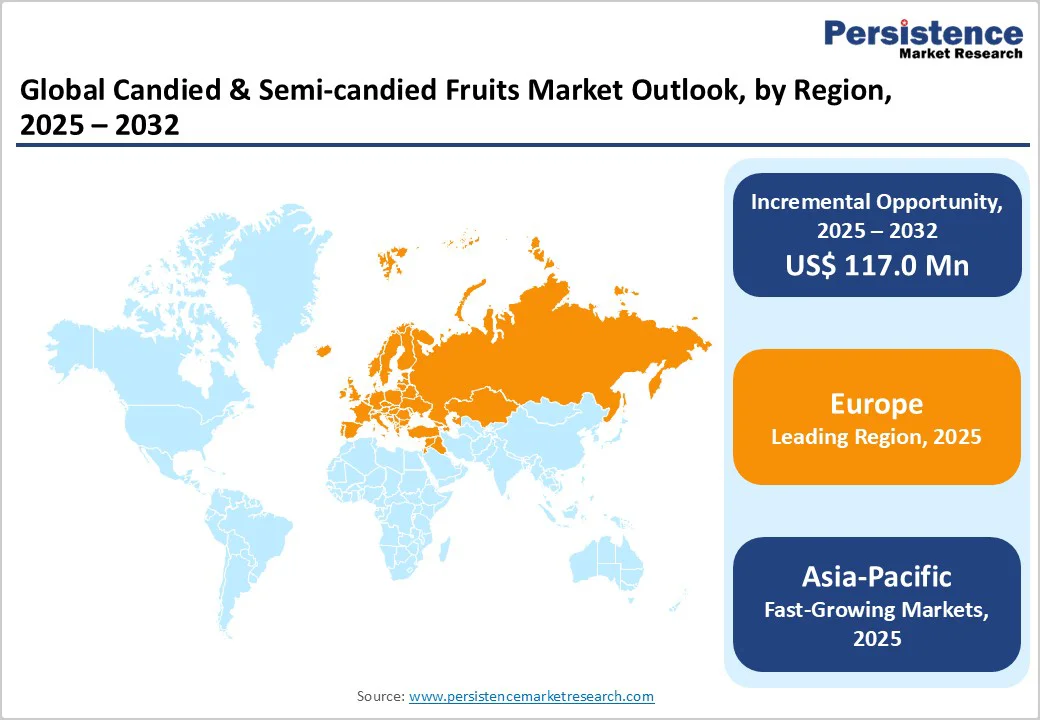
- Leading Region: Europe, holding nearly 35.6% market share in 2025, driven by established bakery and confectionery industries, traditional festive consumption, and strong demand for premium candied and semi-candied fruits.
- Fastest-Growing Region: Asia Pacific, fueled by expanding bakery production in China and India, westernized dessert trends, rising disposable incomes, and growing use of fruit-based decorative ingredients.
- Investment Plans: North America is focusing on sustainable fruit sourcing, reduced-sugar processing, and clean-label formulations supported by consumer shift toward natural and artisanal ingredients.
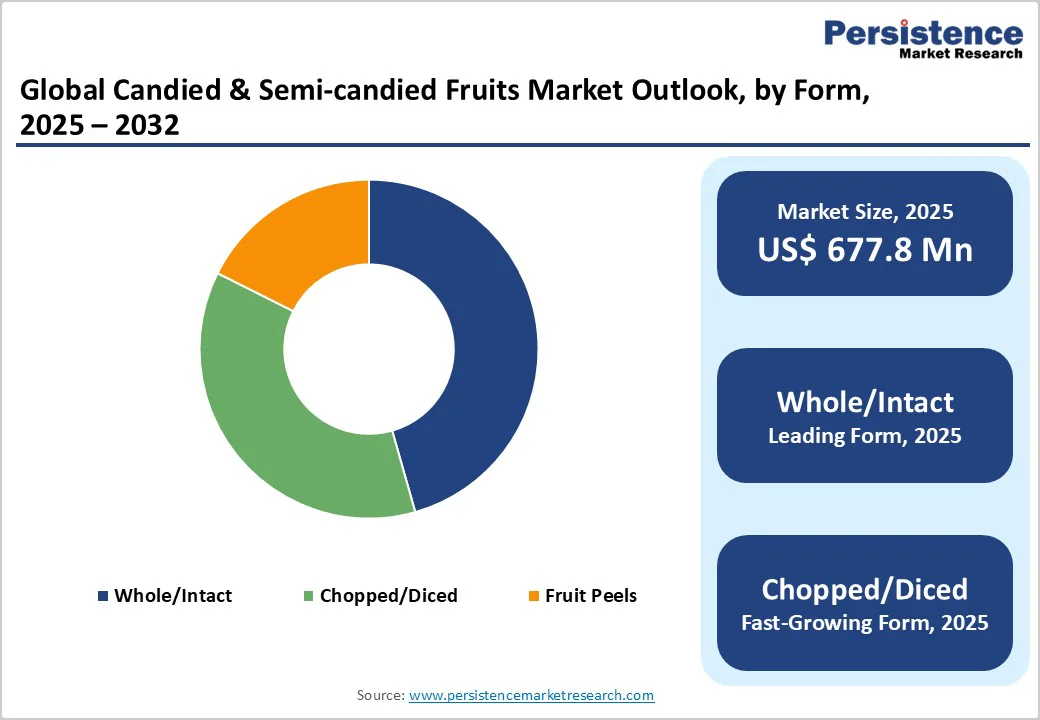
- Dominant Form: Whole/Intact fruits, capturing nearly 45.6% market share, owing to high usage in premium cakes, pastries, and festive desserts, with cherries and pineapple leading global demand.
| Key Insights | Details |
|---|---|
| Candied & Semi-candied Fruits Market Size (2025E) | US$677.8 Mn |
| Market Value Forecast (2032F) | US$794.8 Mn |
| Projected Growth (CAGR 2025 to 2032) | 2.3% |
| Historical Market Growth (CAGR 2019 to 2024) | 1.6% |
Market Factors - Growth, Barriers, and Opportunity Analysis
Rising Demand for Candied & Semi-candied Fruits in the Foodservice Sector
The growing popularity of premium desserts, bakery items, and festive menus in the global foodservice sector is driving the demand for candied and semi-candied fruits. According to the U.S. Department of Agriculture (USDA), spending on “food away from home” surpassed home-prepared food for the first time in recent years, reflecting a cultural shift toward dining out and convenience.
In India, the National Restaurant Association of India (NRAI) highlights an expansion of cafés, patisseries, and quick-service outlets across urban centers, increasing the use of decorative and natural fruit-based ingredients.
The European Commission’s reports on foodservice consumption indicate that hotels and restaurants are emphasizing locally sourced and natural components in desserts and confectionery. This trend boosts the use of whole and chopped candied fruits as versatile, shelf-stable, and visually appealing ingredients that enhance flavor, color, and presentation in bakery, pastry, and frozen dessert applications.
High Sugar Content and Health Concerns
High sugar content in the candied & semi-candied fruits sector poses a significant restraint in today’s market environment. According to the World Health Organization (WHO), free sugars should make up less than 10% of total energy intake, with a further reduction to below 5% (~25 g or ~6 teaspoons per day) offering additional health benefits.
Roughly 43% of adults globally were overweight in 2022, with 16% living with obesity, reflecting growing public health concerns over sugar-rich foods. For producers of candied and semi-candied fruits, typically high in added sugar, this means increasing consumer resistance, stricter regulatory scrutiny, and pressure to reformulate. The rising emphasis on reduced-sugar, clean-label, and functional snacking represents a headwind for traditional high-sugar variants in this market.
Product Innovation with Reduced Sugar and Functional Benefits
The push for product innovation with reduced sugar and functional benefits presents a strong opportunity for the candied & semi-candied fruits market. Government dietary guidance is clear: the World Health Organization recommends that free sugars be less than 10% of total energy intake, and ideally below 5% (~25 g) per day for adults and children.
The U.S. data show a mean added sugar intake of around 17 teaspoons (~68 g) per day for adults, with only about 42 % of Americans meeting the recommendation. Against this backdrop, manufacturers of candied and semi-candied fruits can innovate by offering low-sugar or no-added-sugar options, incorporating natural sweeteners, and adding functional components such as fiber or antioxidants.
These reformulated products cater to health-aware consumers, align with regulatory guidelines, and help differentiate in a market increasingly shaped by clean-label, wellness-oriented trends.
Category-wise Analysis
Form Insights
Whole/Intact form dominates the market with a 45.6% share in 2025, due to its premium visual appeal and industrial application. Whole fruits such as cherries or apricots maintain size, color, and shape after processing, making them ideal for festive cakes (panettone) and artisan bakery items. Exhibitions show that whole fruit decorations in bakery products can represent over 30-40% of ingredient visuals in premium European baked goods.
Whole fruits’ ease of handling, minimal blending, and high perceived value drive usage in food-service and gifting segments. Consumers associate intact fruit items with “whole fruit” health cues, which support premium positioning. Whole/intact forms continue to command a substantial share in the market.
Application Insights
The dominance of the bakery application in the candied & semi-candied fruits market is largely owing to the scale and consistency of baked goods consumption. For example, in the European Bread & Bakery Federation data-set, the EU-27 consumed approximately 39 million tonnes of bread, viennoiserie, and patisserie products in 2020.
Fresh bread and bakery products alone accounted for 82% of total volume in the EU’s bakery segment in 2024. Bakery applications require large volumes of ingredients that offer stability, versatility, and visual appeal, exactly the properties offered by whole, intact candied fruits or chopped inclusions. The continuous demand from industrial bakeries, patisseries, and food-service channels, therefore, drives usage of candied fruits within bakery formulations more than other applications.
Regional Insights
Europe Candied & Semi-candied Fruits Market Trends
Europe region dominates the global market with a 35.6% share in 2025; its bakery and confectionery sectors are deeply rooted in culture and consumption volumes. For instance, consumer data show that the EU region consumes about 26 million tons of bread and bakery products in 2024 alone, with Germany (≈4.5 M tons), Italy (≈3.7 M tons), and France (≈3.4 M tons) accounting for nearly 44% of that total.
The high level of baked goods demand means inputs such as candied and semi-candied fruits, particularly for cakes, pastries, and festive desserts, are more widely used. Per capita bread and bakery product consumption in countries such as the Netherlands (≈116 kg/person) and Belgium (≈74 kg/person) highlights the region’s strong ingredient demand.
Asia Pacific Candied & Semi-candied Fruits Market Trends
Asia Pacific is the fastest-growing region in the candied & semi-candied fruits market due to rising urbanization, growing middle-class incomes, and an increasing appetite for bakery and confectionery products. According to the Food and Agriculture Organization (FAO), Asia accounts for over 60% of global fruit production, ensuring abundant raw material availability for candied fruit processing.
In India, the bakery sector produces around 6.8 million metric tons of products annually, reflecting expanding consumption of cakes and pastries that use candied fruits. Rapid growth of modern retail chains, cafés, and foodservice outlets in China, Japan, and Indonesia further accelerates product use in desserts and festive foods. This combination of supply strength and evolving consumer tastes makes Asia-Pacific the region’s strongest growth hub.
North America Candied & Semi-candied Fruits Market Trends
North America is an important growing region in the candied & semi-candied fruits market due to its strong bakery, confectionery, and foodservice industries. According to the USDA, per capita spending on “food away from home” in the U.S. reached about US$4,306 in 2024, reflecting a high demand for desserts and sweet bakery items that often use candied fruits.
In Canada, the bakery and tortilla manufacturing industry employs over 23,000 people, highlighting the region’s well-established processing and ingredient use network. Rising consumer interest in premium, artisanal baked goods and festive confectionery products supports the inclusion of candied fruits in recipes. The trend toward indulgent yet clean-label desserts continues to make North America a key contributor to global market expansion.
Competitive Landscape
The global candied & semi-candied fruits market is expanding as producers adopt sustainable sourcing, advanced processing, and eco-friendly packaging. Leading brands focus on quality, traceability, and clean-label ingredients, while emerging players emphasize organic and low-sugar variants. Rising demand from the bakery, confectionery, and foodservice sectors, along with evolving consumer preference for natural ingredients, drives steady global growth.
Key Industry Developments:
- In October 2024, Italcanditi and CSM Ingredients announced their merger under a new brand name, Vitalfood, marking a strategic move to strengthen their presence in the global food ingredients sector. The collaboration combined Italcanditi’s expertise in candied and semi-candied fruits with CSM’s innovation in bakery and confectionery solutions.
- In October 2024, CSM Ingredients and Italcanditi announced a joint venture focused on developing and marketing innovative fruit-based products. The partnership aimed to combine CSM’s extensive experience in bakery and confectionery solutions with Italcanditi’s expertise in candied and semi-candied fruits. Together, the companies sought to create high-quality, sustainable, and clean-label fruit ingredients catering to growing global demand in the bakery, pastry, and dairy sectors.
Companies Covered in Candied & Semi-candied Fruits Market
- Andros Chef
- AZIENDA AGRIMONTANA S.P.A.
- Cesarin S.p.A.
- Cruzilles
- F.Moreno Candied Fruits S.L.
- FRUITS ROUGES & Co.
- Gelpass group
- Giuso Guido Spa
- Italcanditi S.p.A
- ITALPROD SRL
- José María Lázaro S.A.
- Kandy
- Lazaya
- Leelanau Fruit Company
- Markidis & Co.
- SALGAR S.r.l.
- SAS SICA SICODIS
Frequently Asked Questions
The candied & semi-candied fruits market is projected to be valued at US$677.8 Million in 2025.
Rising bakery and confectionery demand, festive consumption, natural ingredient preference, and expanding foodservice sectors drive the global market.
The candied & semi-candied fruits market is poised to witness a CAGR of 2.3% between 2025 and 2032.
The growing demand for clean-label, low-sugar variants, export potential, and product innovation in bakery and confectionery applications create opportunities.
Andros Chef, AZIENDA AGRIMONTANA S.P.A., Cesarin S.p.A., Cruzilles, F. Moreno Candied Fruits S.L., and FRUITS ROUGES & Co.


