


- Biotechnology
- Buffer Preparation Market
Buffer Preparation Market Size, Share, and Growth Forecast, 2026 – 2033
Buffer Preparation Market by System Type (Automated, Single Use, Manual & Semi Automated, Continuous), Formulation Type (Liquid Buffers, Powder (Dry) Buffers, Concentrated Buffers, Pre prepared Buffers), End-User (Biopharmaceutical & Biotechnology Companies, CDMOs, Academic & Research Institutions, Clinical Laboratories & Diagnostic Centers, Hospitals & Healthcare Providers), and Regional Analysis for 2026-2033
Buffer Preparation Market Share and Trends Analysis
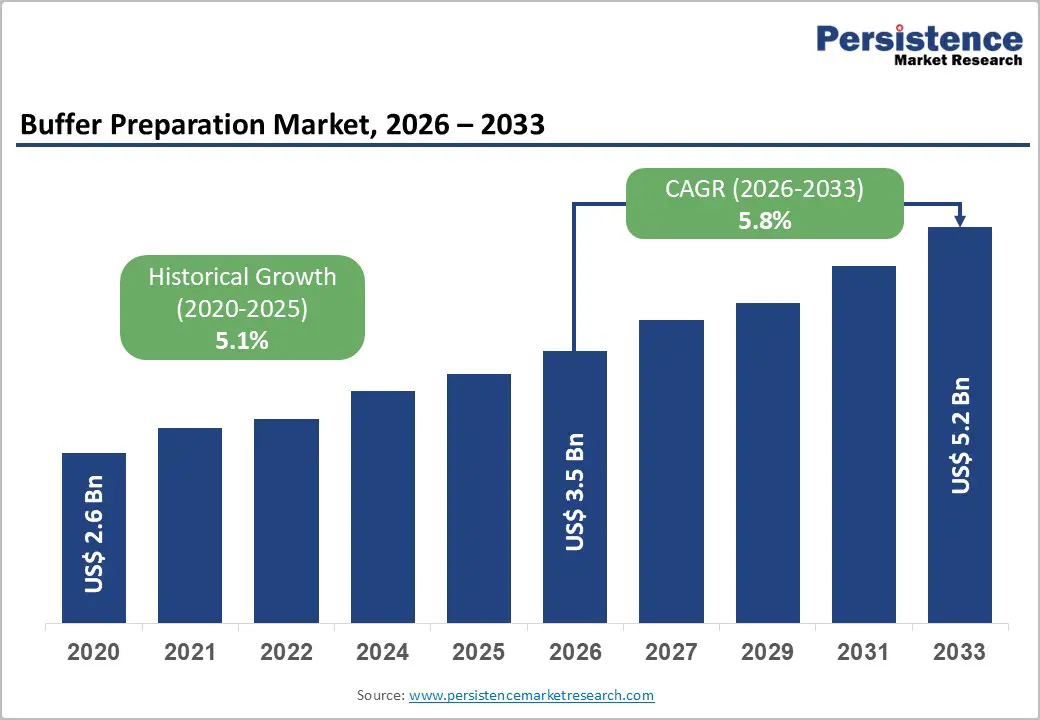
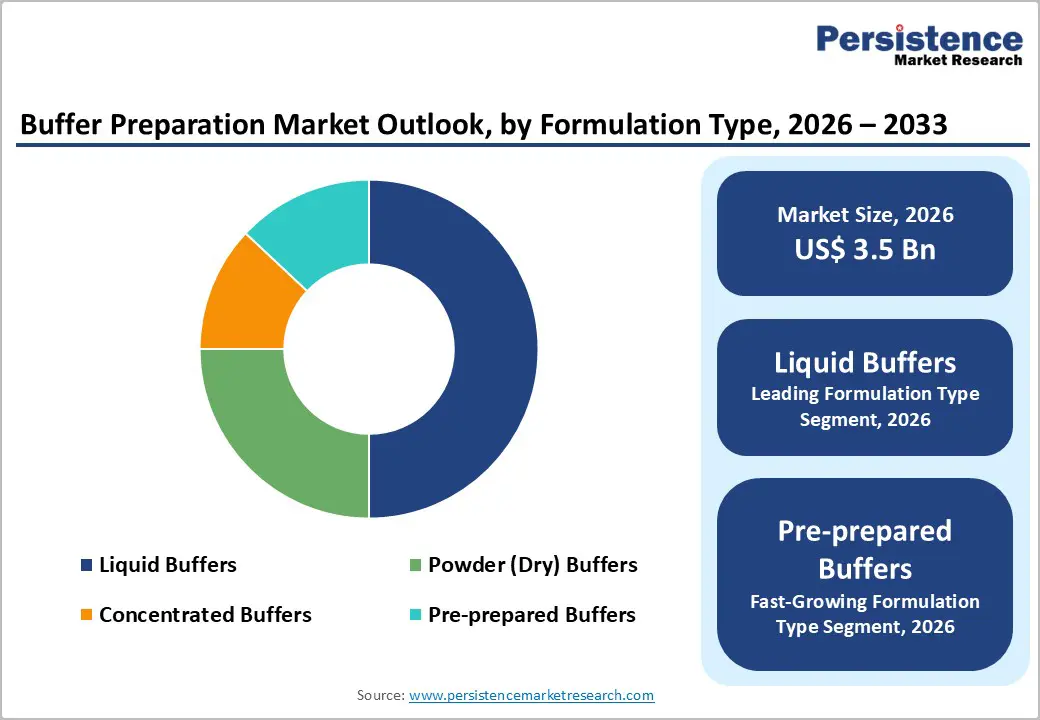
The global buffer preparation market size is likely to be valued at US$ 3.5 billion in 2026, and is projected to reach US$ 5.2 billion by 2033, growing at a CAGR of 5.8% during the forecast period 2026−2033. The market is undergoing steady expansion due to structural growth in biopharmaceutical manufacturing, clinical diagnostics, and regulated laboratory operations.
Increasing prevalence of chronic and infectious diseases has elevated demand for biologics, vaccines, and cell-based therapies, which depend on high-precision buffer solutions across upstream and downstream workflows. Rising clinical awareness among healthcare professionals and regulators has strengthened adoption of standardized buffer preparation practices to ensure reproducibility, safety, and regulatory compliance. Treatment adoption across monoclonal antibodies, gene therapies, and biosimilars has accelerated integration of automated and single-use buffer systems to support scalability and contamination control.
Key Industry Highlights
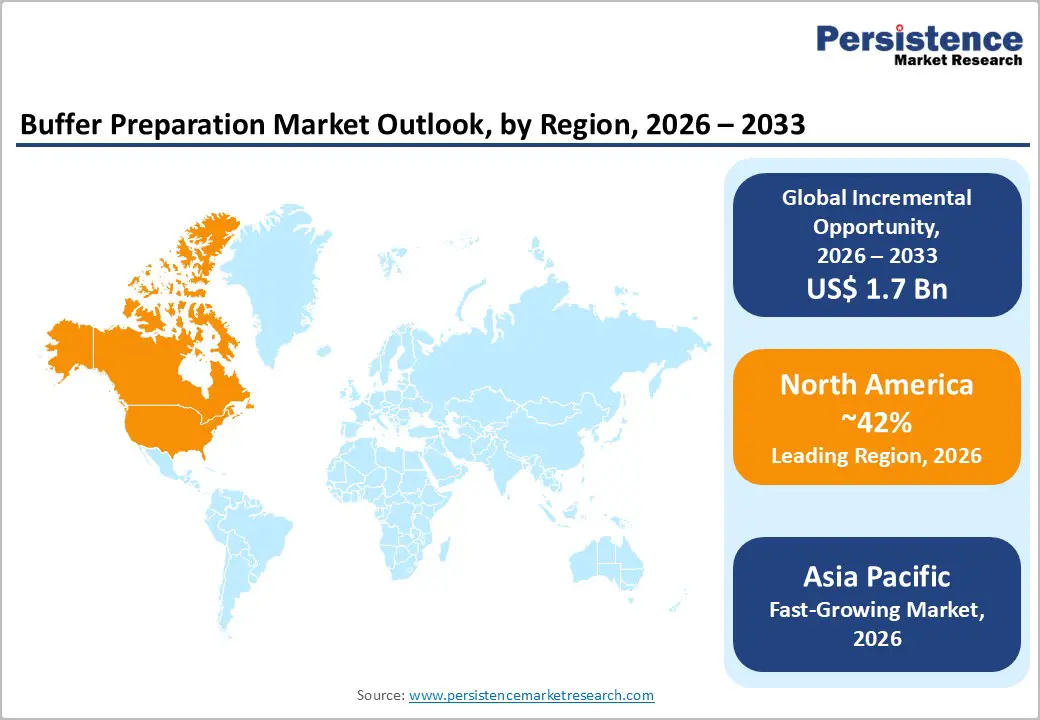
- Dominant Region: North America is projected to hold around 42% share in 2026, driven by integrated biologics manufacturing and stringent regulatory oversight.
- Fastest-growing Market: Asia Pacific is projected to be the fastest-growing market through 2033, supported by rapid biologics capacity expansion and rising vaccine and biosimilar output.
- Leading Formulation Type: Liquid buffers are expected to lead with over 50% share in 2026, owing to their immediate usability, consistent formulation, and reduced preparation time.
- Fastest-growing Formulation Type: Pre-prepared buffers are projected to be the fastest-growing from 2026 to 2033, backed by high demand for ready-to-use accuracy, compliance readiness, and rapid deployment.
| Key Insights | Details |
|---|---|
| Buffer Preparation Market Size (2026E) | US$ 3.5 Bn |
| Market Value Forecast (2033F) | US$ 5.2 Bn |
| Projected Growth (CAGR 2026 to 2033) | 5.8% |
| Historical Market Growth (CAGR 2020 to 2025) | 5.1% |
Market Factors – Growth, Barriers, and Opportunity Analysis
Expansion of Biopharmaceutical Manufacturing Capacity
Rising scale and complexity of biologics production directly elevate reliance on controlled chemical environments throughout manufacturing workflows. Buffer systems play a foundational role in maintaining defined pH levels, ionic balance, and molecular stability during cell culture, purification, and formulation activities. These conditions are central to achieving batch consistency and regulatory alignment under Current Good Manufacturing Practice (CGMP) frameworks enforced by authorities such as the U.S. Food and Drug Administration (FDA). As facilities transition toward high-volume monoclonal antibodies, recombinant proteins, vaccines, and advanced therapies, process sensitivity increases, placing greater emphasis on precise buffer preparation to safeguard product integrity and yield. Large-scale operations integrate buffers as standardized process inputs rather than auxiliary materials, embedding them into validated protocols that support reproducibility and audit readiness.
Capacity expansion across global manufacturing networks further reinforces buffer demand through operational intensity and throughput optimization. High-capacity plants operate extended production cycles, parallel processing lines, and multi-product suites, all of which require continuous availability of quality-assured buffer solutions to avoid process interruptions. Investments in single-use technologies, automated systems, and modular facility designs standardize buffer usage across sites, strengthening consumption patterns tied to installed capacity. Regulatory expectations for lifecycle management and process control increase dependence on consistent buffer quality across development and commercial stages.
Advancements in Automation Technology Propel Efficiency Gains
Automation technology fundamentally restructures laboratory operations by eliminating repetitive manual tasks and standardizing workflows with high-precision machines, robotics and digital control systems. Integrated systems reduce variability in procedures such as dispensing, measuring and data logging, which are traditionally time-consuming and error-prone when done manually, enabling labs to process higher volumes of work with consistent quality and shorter turnaround times. Government-led initiatives and research emphasize that automation in labs enhances operational performance by streamlining pre-analytical, analytical and post-analytical phases, reducing human intervention and improving workflow quality in diagnostic and research settings.
A key indicator of this trend is investment in advanced automated laboratory infrastructure aimed at improving scientific discovery and experimental efficiency. For example, in 2025 the U.S. National Science Foundation announced funding for a network of AI-programmable cloud laboratories to advance automated experimentation capabilities, signifying government recognition of automation’s potential to speed scientific progress and improve the efficiency of experimental workflows. Such investments illustrate a broader policy focus on enhancing research productivity through automation.
High Cost of High-Purity Buffers and Equipment
The elevated pricing of high purity buffers and the equipment required for their preparation reflects the complexity of achieving consistent chemical accuracy, sterility, and regulatory compliance. Manufacturing processes rely on advanced purification methods, validated raw material sourcing, and extensive quality documentation aligned with government standards for pharmaceutical and life science use. Equipment such as automated mixing units, sterile filtration systems, and precision pH control instruments involves high capital investment, specialized installation, and skilled operation. In 2025, the National Institutes of Health reported that approximately US$ 9.0 billion of total federal biomedical research spending was allocated to facilities and administrative costs, reflecting the financial burden associated with compliant infrastructure and specialized laboratory equipment.
High expenditure levels create structural limitations for organizations operating under fixed budgets and competitive funding environments. Academic laboratories, early stage biotechnology firms, and contract service providers face constrained purchasing flexibility when large upfront investments are required for compliant buffer preparation capabilities. Procurement decisions often prioritize cost containment over technology upgrades, slowing adoption of automation and limiting process scalability. Financial pressure can also influence sourcing strategies, with organizations seeking lower cost alternatives that may increase operational complexity or quality risk. Over time, sustained capital intensity affects expansion planning, delays capacity enhancement, and raises barriers for new participants.
Skilled Workforce Requirements
A primary constraint arises from the mismatch between evolving job requirements and the available skilled workforce’s capabilities. Operational roles in buffer preparation and associated scientific processes demand specialized competencies in areas such as process chemistry, regulatory compliance, quality control protocols and advanced instrumentation. When firms cannot source staff with these competencies, lead times for establishing or scaling critical operations extend significantly, training costs escalate and project timelines slip. Workforce readiness also dictates how quickly new technologies, such as automation or digital quality systems, can be integrated with minimal disruption. Across industries, shifting skill requirements are becoming a dominant business challenge, with a major global labor survey reporting 63% of employers identifying skills gaps as the primary barrier to organizational transformation through 2030.
The consequence of this mismatch is a direct drag on operational efficiency and compliance assurance. Organizations facing a scarcity of qualified personnel must allocate disproportionate resources to training or outsourcing, diluting focus from growth-oriented activities. In regulated environments, insufficiently trained staff increase the risk of deviations, non-conformance or inspection findings, which can trigger costly delays or sanctions. The competitive landscape compounds these pressures as industries compete for a limited pool of talent with advanced technical, analytical and quality management skills, amplifying hiring costs and turnover.
Adoption of Single-Use and Modular Buffer Preparation Platforms
Pharmaceutical manufacturing regulators are actively shaping policy to support advanced, flexible manufacturing technologies that improve product quality and supply chain resilience. The U.S. FDA’s Framework for Regulatory Advanced Manufacturing Evaluation (FRAME) initiative aims to enable adoption of technologies that enhance robustness and reliability in drug production by clarifying risk-based regulatory expectations for innovative approaches. This signal from a major government regulator indicates that platform technologies which simplify process control and improve consistency are aligned with future compliance philosophies. In early 2025, the FDA also released draft guidance on process controls and uniformity that explicitly ties quality strategies to modern manufacturing approaches, underscoring the regulatory trend toward automated, integrated systems in regulated environments.
Manufacturers face operational realities where traditional buffer preparation is labor-intensive, manual, and a bottleneck in bioproduction workflows, especially as product diversity and small batch requirements increase. Modular systems with single-use fluid pathways and plug-and-play preparation modules address these challenges by reducing cleaning and validation burdens, shrinking facility footprint, and enabling rapid changeovers between products. These platforms also support on-demand preparation close to the point of use, which aligns with quality-by-design principles and improves traceability and documentation.
Expansion of Contract Manufacturing and Outsourced Research Services
The expansion of contract manufacturing and outsourced research services reflects structural shifts in biopharmaceutical development and production models. Advanced biologics, cell-based therapies, and complex formulations require highly controlled environments, validated processes, and specialized technical expertise. Internal capacity expansion demands substantial capital commitment, extended timelines, and continuous regulatory alignment. External service providers deliver immediate access to compliant infrastructure, skilled technical teams, and scalable operations aligned with fluctuating production needs. This model supports efficient capital deployment, faster development cycles, and improved operational agility across research, clinical, and commercial stages.
Regulatory oversight and scientific complexity further reinforce reliance on external partners. Government regulatory frameworks emphasize rigorous documentation, traceability, and quality control across biologic workflows, increasing operational intensity for in-house teams. Outsourced research and manufacturing organizations maintain established compliance systems, advanced automation, and validated production environments aligned with regulatory expectations. This alignment reduces execution risk, supports faster technology transfer, and enhances readiness for inspections and approvals.
Category-wise Analysis
System Type Insights
Single-use buffer systems is anticipated to secure around 35% of the buffer preparation market revenue share in 2026, reflecting widespread integration in bioprocessing due to reduced contamination risks. Broad deployment across upstream and downstream workflows supports closed processing environments, limiting exposure to external contaminants and supporting sterility assurance. Operational models benefit from simplified setup and removal, enabling faster production readiness across multiple batches. Clinical adoption strengthens through compatibility with decentralized and modular facilities, supporting variable production scales without infrastructure expansion. Consistent buffer performance supports stable process conditions, contributing to reliable therapeutic output across sites. Advancements in polymer chemistry and film strength improve chemical compatibility and durability, reducing failure risk during operation.
Automated buffer preparation systems is expected to be the fastest-growing segment during the 2026-2033 forecast period, propelled by efficiency gains in large-scale operations. Automation supports precise control of formulation parameters, ensuring repeatable outcomes across extended production runs. Digital connectivity enables seamless alignment with manufacturing execution systems, supporting traceability and data integrity across regulated environments. Clinical confidence increases through consistent buffer specifications that support stable biologic performance. Production facilities benefit from streamlined workflows that reduce operator intervention and variability. High-throughput settings gain improved accessibility through predictable cycle times and optimized resource allocation.
Formulation Type Insights
Liquid buffers are poised to dominate with a forecasted market share of over 50% in 2026, powered by immediate usability, consistency, and reduced preparation time. Ready availability supports continuous operations within regulated laboratory and manufacturing environments where time efficiency and reproducibility remain critical. Pre-formulated compositions ensure stable pH and ionic strength, supporting dependable assay performance and downstream process integrity. Standardized packaging formats simplify handling, storage, and inventory control across high-volume facilities. Reduced reliance on manual preparation lowers procedural complexity and minimizes operator-induced variation. Strong confidence among laboratory professionals stems from predictable performance across applications such as cell culture, chromatography, and diagnostics.
Pre-prepared buffers are estimated to be the fastest-growing segment from 2026 to 2033, fueled by demand for convenience, accuracy, and compliance readiness. Ready-to-use formats support rapid deployment across laboratories with limited technical resources or fluctuating workloads. Elimination of weighing, mixing, and verification steps strengthens accuracy and reduces process deviations. Expansion of preventive healthcare initiatives increases routine testing volumes, elevating demand for reliable consumables. Digital commerce platforms extend reach to remote and emerging research hubs, improving procurement efficiency. Decentralized laboratories benefit from consistent performance without infrastructure investment.
Regional Insights
North America Buffer Preparation Market Trends
North America is expected to command an estimated 42% of the buffer preparation market share in 2026, fueled by deep integration of biologics manufacturing, advanced regulatory enforcement, and high adoption of automated and single-use processing platforms. Concentration of large-scale biopharmaceutical producers and contract development and manufacturing organizations sustains continuous demand for standardized, high-volume buffer solutions across clinical and commercial operations. Manufacturing pipelines emphasize monoclonal antibodies, vaccines, and cell and gene therapies, all requiring stringent control of pH, ionic strength, and batch reproducibility. Capital-intensive facilities support early deployment of automation and digital control systems, strengthening operational consistency and reducing deviation exposure. Regulatory frameworks prioritize data integrity, traceability, and contamination prevention, encouraging reliance on validated, ready-to-use buffer formats.
Market leadership is further reinforced by advanced digital infrastructure and quality management integration across production environments. Manufacturing execution systems, electronic batch records, and real-time analytics require buffer preparation solutions compatible with automated workflows and continuous monitoring. High availability of skilled technical talent supports rapid technology adoption and process optimization during scale-up and technology transfer. Strong investment flows enable ongoing facility expansion and modernization, sustaining procurement momentum. Proximity to reagent suppliers and technology developers shortens lead times and improves responsiveness to formulation changes.
Europe Buffer Preparation Market Trends
Europe demonstrates steady growth potential in the buffer preparation market, driven by harmonized regulatory frameworks, strong biologics and biosimilar production activity, and increasing focus on quality-standardized manufacturing practices. Cross-border regulatory alignment supports consistent adoption of validated buffer preparation workflows across pharmaceutical and biotechnology facilities. Production pipelines emphasize monoclonal antibodies, vaccines, and advanced therapies, all requiring precise pH control and batch reproducibility. Environmental compliance priorities influence procurement toward efficient preparation systems that reduce resource consumption and waste. High inspection rigor reinforces reliance on standardized, traceable buffer formats across clinical and commercial manufacturing environments.
Growth momentum is further supported by sustained public funding, innovation-led partnerships, and advanced manufacturing infrastructure. Public–private initiatives promote translational research and advanced therapy development, strengthening demand across academic and industrial laboratories. Expansion of contract development and manufacturing services enables flexible capacity scaling while maintaining regulatory alignment. Digital manufacturing adoption improves integration of automated preparation platforms, electronic documentation, and real-time quality oversight. Skilled technical workforce availability supports complex bioprocess operations and technology transfer.
Asia Pacific Buffer Preparation Market Trends
Asia Pacific is anticipated to be the fastest-growing market for buffer preparation through 2033, supported by accelerated biologics manufacturing expansion, increasing vaccine and biosimilar production, and rising integration into global pharmaceutical supply chains. Large-scale capacity additions across monoclonal antibodies, recombinant proteins, and cell-based therapies drive sustained demand for high-volume, standardized buffer solutions. Manufacturing facilities increasingly deploy modular and flexible plant configurations, favoring single-use and pre-prepared buffer systems that shorten validation timelines and improve production readiness. Cost-efficient operating structures combined with growing domestic healthcare demand reinforce continuous throughput growth across upstream and downstream bioprocessing stages.
Growth momentum is further strengthened by policy-led biotechnology development, regulatory framework upgrades, and rapid digital manufacturing adoption. Government-backed life sciences clusters and infrastructure investments encourage domestic production and reduce reliance on imports. Regulatory alignment with international quality standards increases adoption of validated, automation-compatible buffer preparation platforms. Expansion of contract development and manufacturing services attracts multinational biopharmaceutical programs, increasing recurring production volumes. Workforce upskilling initiatives support rapid technology transfer and operational scaling.
Competitive Landscape
The global buffer preparation market exhibits a moderately consolidated structure, with leading multinational suppliers accounting for a significant share. Competitive strength is shaped by breadth of product portfolios, depth of process know-how, and ability to support regulated bioprocessing environments at scale. Global suppliers invest heavily in automation-compatible systems, single-use technologies, and validated ready-to-use formats that align with stringent quality and data integrity requirements. Strong regulatory credibility and long-standing relationships with biopharmaceutical manufacturers create high entry barriers. Integrated service models covering formulation support, process optimization, and technical training further reinforce market positioning.
Key players such as Thermo Fisher Scientific Inc., Merck KGaA, Sartorius AG, Cytiva, Avantor, Inc., Repligen Corporation, and Corning Incorporated shape competitive dynamics through continuous innovation and global reach. These organizations focus on expanding automation, digital integration, and single-use offerings to align with evolving manufacturing models. Investment in regional production hubs and application support teams strengthens proximity to customers and improves responsiveness. Smaller and regional participants remain relevant by offering tailored formulations, localized service, and cost-efficient solutions suited to niche applications or emerging manufacturing centers. Customization flexibility, shorter lead times, and pricing agility enable these players to compete effectively within specific segments.
Key Industry Developments
- In February 2026, Nucleus Biologics introduced the Krakatoa K500, a pod-based, on-demand media and buffer manufacturing system designed to streamline and decentralize bioproduction workflows. The platform enables flexible, just-in-time formulation of cell culture media and buffers, aiming to reduce supply chain risk and improve scalability in biologics manufacturing.
- In October 2025, Rentschler Biopharma constructed a 3,400 m² buffer and media production facility at its Laupheim, Germany headquarters, representing its largest single site investment to date and strengthening capacity for upstream and downstream bioprocessing. The automated, digitally integrated station will enhance supply reliability and scalability for biologics manufacturing clients.
- In October 2025, Advancion Sciences expanded its U.S. manufacturing footprint with the launch of commercial media, operating platform solutions, and buffer production capabilities to support biologics and cell therapy supply chains. The enhanced facility is aimed at improving domestic production capacity, reducing dependency on imports, and accelerating delivery timelines for clinical and commercial bioprocessing materials.
Companies Covered in Buffer Preparation Market
- Thermo Fisher Scientific Inc.
- Merck KGaA
- Sartorius AG
- Cytiva
- Avantor, Inc.
- Repligen Corporation. Corning Incorporated
- Asahi Kasei Bioprocess America, Inc.
- Eppendorf SE
- Lonza
Frequently Asked Questions
The global buffer preparation market is projected to reach US$ 3.5 billion in 2026.
Rising biologics and vaccine production, increasing adoption of single-use and automated bioprocessing systems, and stringent regulatory requirements for process consistency and contamination control are driving the market.
The market is poised to witness a CAGR of 5.8% from 2026 to 2033.
Expansion of contract manufacturing services, growing adoption of automated and ready-to-use solutions, and increasing biologics production across emerging manufacturing hubs are creating key market opportunities.
Some of the key market players include Thermo Fisher Scientific Inc., Merck KGaA, Sartorius AG, Cytiva, Avantor, Inc., Repligen Corporation, and Corning Incorporated.


