


- Executive Summary
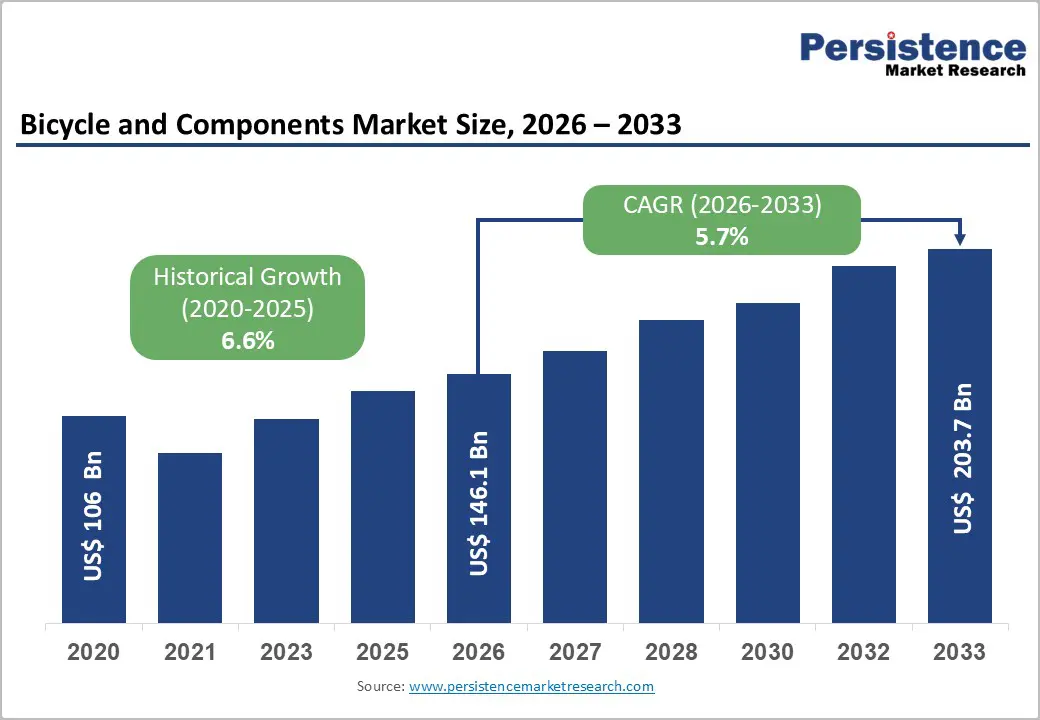
- Global Bicycle and Components Market Snapshot 2026 and 2033
- Market Opportunity Assessment, 2026 - 2033, US$ Bn
- Key Market Trends
- Industry Developments and Key Market Events
- Demand Side and Supply Side Analysis
- PMR Analysis and Recommendations
- Market Overview
- Market Scope and Definitions
- Value Chain Analysis
- Macro-Economic Factors
- Global GDP Outlook
- Global Sporting Goods & Outdoor Recreation Industry
- Global Fitness & Wellness Industry
- Global E-Mobility & Micro-Mobility Industry
- Forecast Factors - Relevance and Impact
- COVID-19 Impact Assessment
- PESTLE Analysis
- Porter's Five Forces Analysis
- Geopolitical Tensions: Market Impact
- Regulatory and Technology Landscape
- Market Dynamics
- Drivers
- Restraints
- Opportunities
- Trends
- Price Trend Analysis, 2020 - 2033
- Region-wise Price Analysis
- Price by Segments
- Price Impact Factors
- Global Bicycle and Components Market Outlook: Historical (2020 - 2025) and Forecast (2026 - 2033)
- Key Highlights
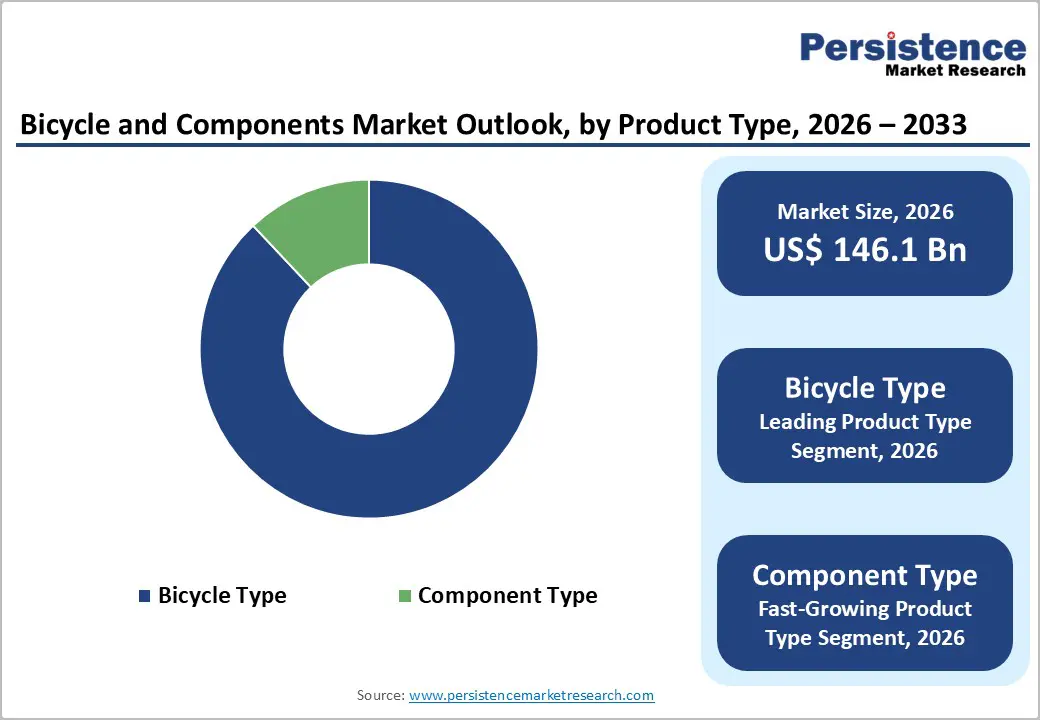
- Global Bicycle and Components Market Outlook: Product Type
- Introduction/Key Findings
- Historical Market Size (US$ Bn) and Volume (Units) Analysis by Product Type, 2020-2025
- Current Market Size (US$ Bn) and Volume (Units) Forecast, by Product Type, 2026-2033
- Component Type
- Drivetrain Systems
- Electronic & Smart Components
- Braking Systems
- Motor
- Wheelsets & Tires
- Suspension & Forks
- Frames & Handlebars
- Pedals, Saddles & Seatposts
- Misc.
- Bicycle Type
- Commuting/Leisure (City/Urban)
- Performance/Race
- Mountain Bike (MTB)/Trekking
- Gravel & Touring
- Others (Cargo bikes, etc.)
- Component Type
- Market Attractiveness Analysis: Product Type
- Global Bicycle and Components Market Outlook: Sales Channel
- Introduction/Key Findings
- Historical Market Size (US$ Bn) and Volume (Units) Analysis by Sales Channel, 2020-2025
- Current Market Size (US$ Bn) and Volume (Units) Forecast, by Sales Channel, 2026-2033
- Online
- Offline
- Market Attractiveness Analysis: Sales Channel
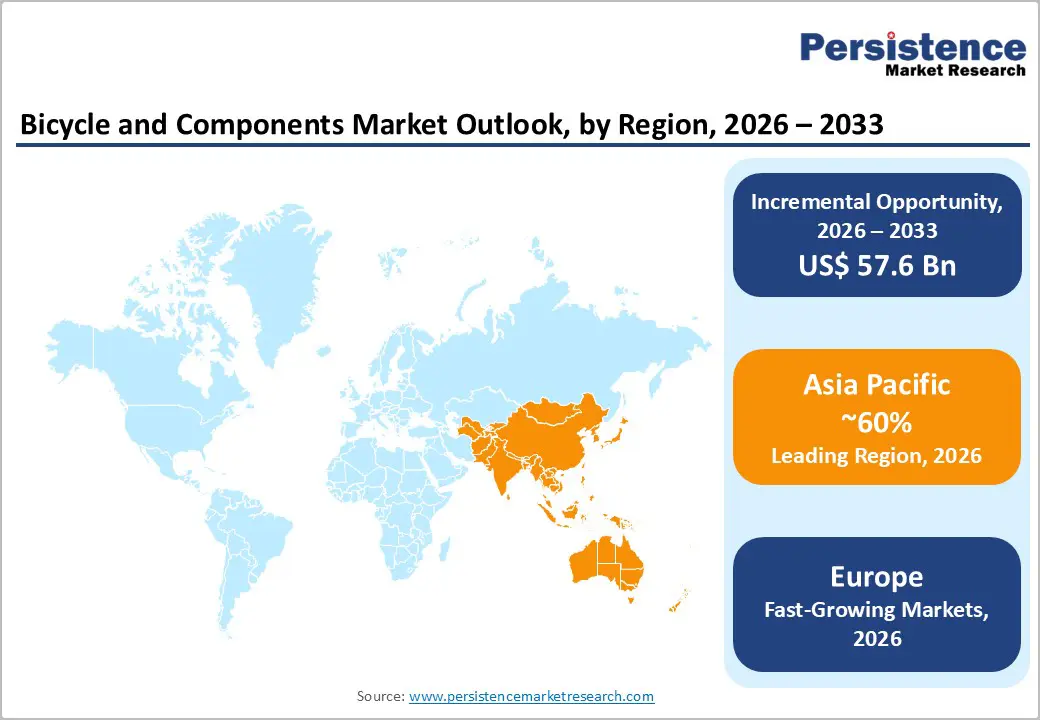
- Global Bicycle and Components Market Outlook: Region
- Key Highlights
- Historical Market Size (US$ Bn) and Volume (Units) Analysis by Region, 2020-2025
- Current Market Size (US$ Bn) and Volume (Units) Forecast, by Region, 2026-2033
- North America
- Europe
- East Asia
- South Asia & Oceania
- Latin America
- Middle East & Africa
- Market Attractiveness Analysis: Region
- North America Bicycle and Components Market Outlook: Historical (2020 - 2025) and Forecast (2026 - 2033)
- Key Highlights
- Pricing Analysis
- North America Market Size (US$ Bn) and Volume (Units) Forecast, by Country, 2026-2033
- U.S.
- Canada
- North America Market Size (US$ Bn) and Volume (Units) Forecast, by Product Type, 2026-2033
- Component Type
- Drivetrain Systems
- Electronic & Smart Components
- Braking Systems
- Motor
- Wheelsets & Tires
- Suspension & Forks
- Frames & Handlebars
- Pedals, Saddles & Seatposts
- Misc
- Bicycle Type
- Commuting/Leisure (City/Urban)
- Performance/Race
- Mountain Bike (MTB)/Trekking
- Gravel & Touring
- Others (Cargo bikes, etc.)
- Component Type
- North America Market Size (US$ Bn) and Volume (Units) Forecast, by Sales Channel, 2026-2033
- Online
- Offline
- Europe Bicycle and Components Market Outlook: Historical (2020 - 2025) and Forecast (2026 - 2033)
- Key Highlights
- Pricing Analysis
- Europe Market Size (US$ Bn) and Volume (Units) Forecast, by Country, 2026-2033
- Germany
- Italy
- France
- U.K.
- Spain
- Russia
- Rest of Europe
- Europe Market Size (US$ Bn) and Volume (Units) Forecast, by Product Type, 2026-2033
- Component Type
- Drivetrain Systems
- Electronic & Smart Components
- Braking Systems
- Motor
- Wheelsets & Tires
- Suspension & Forks
- Frames & Handlebars
- Pedals, Saddles & Seatposts
- Misc.
- Bicycle Type
- Commuting/Leisure (City/Urban)
- Performance/Race
- Mountain Bike (MTB)/Trekking
- Gravel & Touring
- Others (Cargo bikes, etc.)
- Component Type
- Europe Market Size (US$ Bn) and Volume (Units) Forecast, by Sales Channel, 2026-2033
- Online
- Offline
- East Asia Bicycle and Components Market Outlook: Historical (2020 - 2025) and Forecast (2026 - 2033)
- Key Highlights
- Pricing Analysis
- East Asia Market Size (US$ Bn) and Volume (Units) Forecast, by Country, 2026-2033
- China
- Japan
- South Korea
- East Asia Market Size (US$ Bn) and Volume (Units) Forecast, by Product Type, 2026-2033
- Component Type
- Drivetrain Systems
- Electronic & Smart Components
- Braking Systems
- Motor
- Wheelsets & Tires
- Suspension & Forks
- Frames & Handlebars
- Pedals, Saddles & Seatposts
- Misc
- Bicycle Type
- Commuting/Leisure (City/Urban)
- Performance/Race
- Mountain Bike (MTB)/Trekking
- Gravel & Touring
- Others (Cargo bikes, etc.)
- Component Type
- East Asia Market Size (US$ Bn) and Volume (Units) Forecast, by Sales Channel, 2026-2033
- Online
- Offline
- East Asia Market Size (US$ Bn) and Volume (Units) Forecast, by , 2026-2033
- South Asia & Oceania Bicycle and Components Market Outlook: Historical (2020 - 2025) and Forecast (2026 - 2033)
- Key Highlights
- Pricing Analysis
- South Asia & Oceania Market Size (US$ Bn) and Volume (Units) Forecast, by Country, 2026-2033
- India
- Southeast Asia
- ANZ
- Rest of SAO
- South Asia & Oceania Market Size (US$ Bn) and Volume (Units) Forecast, by Product Type, 2026-2033
- Component Type
- Drivetrain Systems
- Electronic & Smart Components
- Braking Systems
- Motor
- Wheelsets & Tires
- Suspension & Forks
- Frames & Handlebars
- Pedals, Saddles & Seatposts
- Misc
- Bicycle Type
- Commuting/Leisure (City/Urban)
- Performance/Race
- Mountain Bike (MTB)/Trekking
- Gravel & Touring
- Others (Cargo bikes, etc.)
- Component Type
- South Asia & Oceania Market Size (US$ Bn) and Volume (Units) Forecast, by Sales Channel, 2026-2033
- Online
- Offline
- Latin America Bicycle and Components Market Outlook: Historical (2020 - 2025) and Forecast (2026 - 2033)
- Key Highlights
- Pricing Analysis
- Latin America Market Size (US$ Bn) and Volume (Units) Forecast, by Country, 2026-2033
- Brazil
- Mexico
- Rest of LATAM
- Latin America Market Size (US$ Bn) and Volume (Units) Forecast, by Product Type, 2026-2033
- Component Type
- Drivetrain Systems
- Electronic & Smart Components
- Braking Systems
- Motor
- Wheelsets & Tires
- Suspension & Forks
- Frames & Handlebars
- Pedals, Saddles & Seatposts
- Misc
- Bicycle Type
- Commuting/Leisure (City/Urban)
- Performance/Race
- Mountain Bike (MTB)/Trekking
- Gravel & Touring
- Others (Cargo bikes, etc.)
- Component Type
- Latin America Market Size (US$ Bn) and Volume (Units) Forecast, by Sales Channel, 2026-2033
- Online
- Offline
- Middle East & Africa Bicycle and Components Market Outlook: Historical (2020 - 2025) and Forecast (2026 - 2033)
- Key Highlights
- Pricing Analysis
- Middle East & Africa Market Size (US$ Bn) and Volume (Units) Forecast, by Country, 2026-2033
- GCC Countries
- South Africa
- Northern Africa
- Rest of MEA
- Middle East & Africa Market Size (US$ Bn) and Volume (Units) Forecast, by Product Type, 2026-2033
- Component Type
- Drivetrain Systems
- Electronic & Smart Components
- Braking Systems
- Motor
- Wheelsets & Tires
- Suspension & Forks
- Frames & Handlebars
- Pedals, Saddles & Seatposts
- Misc
- Bicycle Type
- Commuting/Leisure (City/Urban)
- Performance/Race
- Mountain Bike (MTB)/Trekking
- Gravel & Touring
- Others (Cargo bikes, etc.)
- Component Type
- Middle East & Africa Market Size (US$ Bn) and Volume (Units) Forecast, by Sales Channel, 2026-2033
- Online
- Offline
- Competition Landscape
- Market Share Analysis, 2025
- Market Structure
- Competition Intensity Mapping
- Competition Dashboard
- Company Profiles
- Shimano Inc.
- Company Overview
- Product Portfolio/Offerings
- Key Financials
- SWOT Analysis
- Company Strategy and Key Developments
- Pon Holding B.V.
- Giant Manufacturing Co. Ltd
- Trek Bicycle Corporation
- Merida Industry Co., Ltd.
- Scott Sports SA
- Canyon Bicycles GmbH
- Specialized Bicycle Components, Inc.
- F.I.V.E. Bianchi S.p.A.
- Cicli Pinarello S.p.A.
- Colnago Ernesto & C. S.r.l.
- Factor Bikes
- BMC Switzerland AG
- Hero Cycles Limited
- Giant Bicycles Inc.
- Atlas Cycles Ltd.
- Derby Cycle Holding GmbH
- SRAM Corporation
- Rad Power Bikes
- Cannondale
- Cervelo Bicycles
- Decathlon
- Polygon Bikes
- Shimano Inc.
- Appendix
- Research Methodology
- Research Assumptions
- Acronyms and Abbreviations

Loading page data
Please wait a moment


