


- Executive Summary
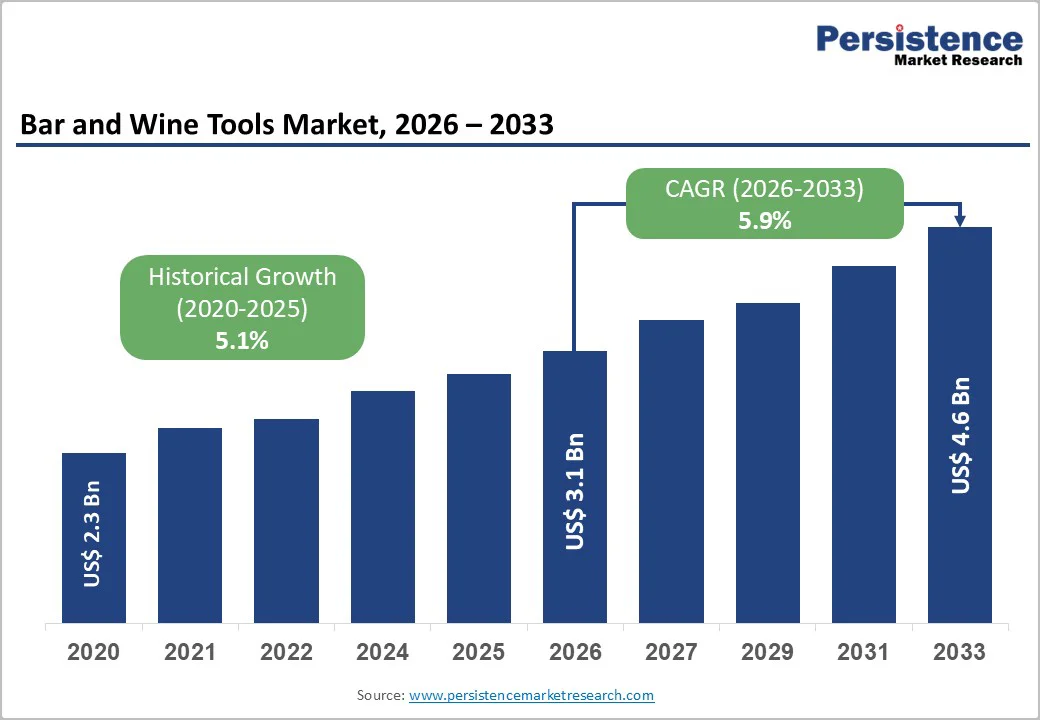
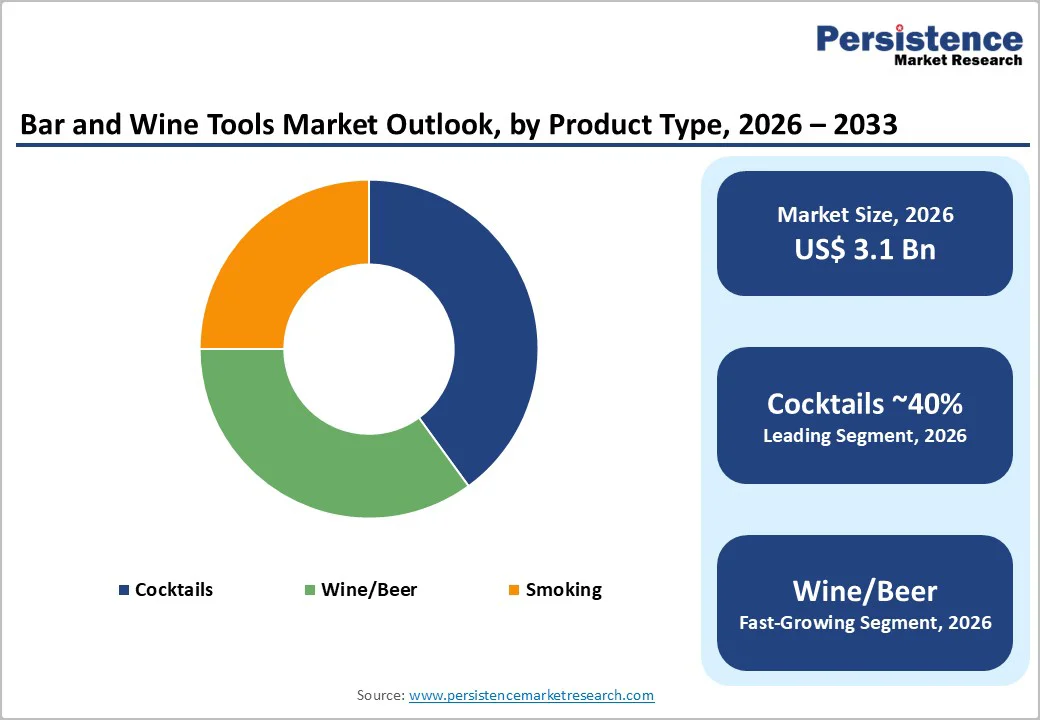
- Global Bar and Wine Tools Market Snapshot 2026 and 2033
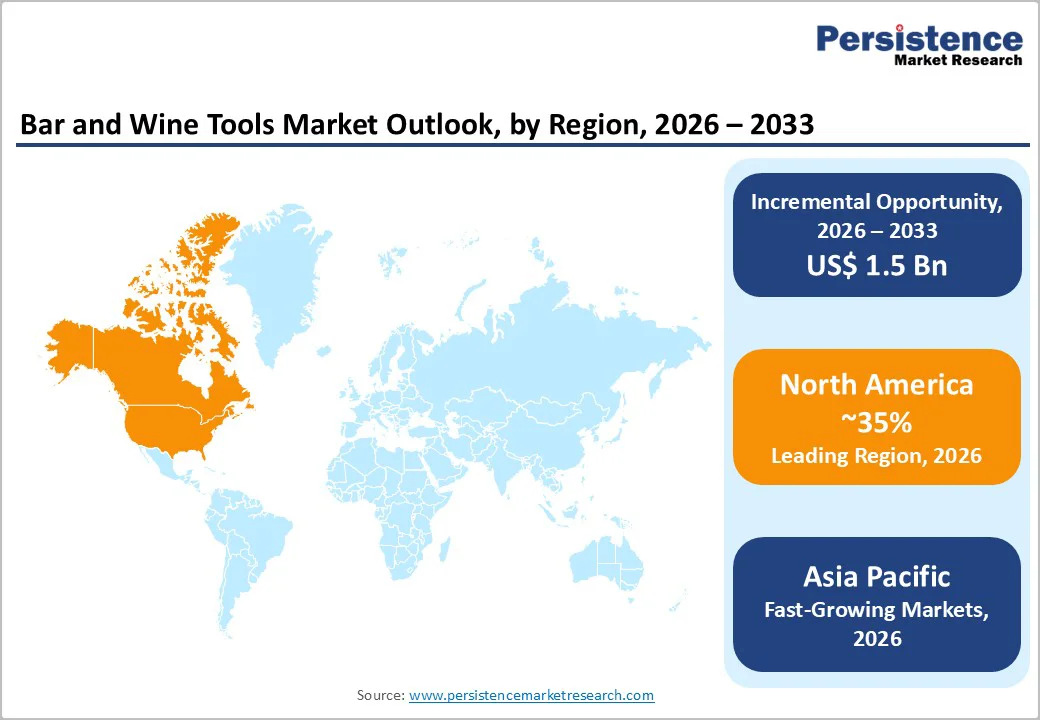
- Market Opportunity Assessment, 2026 - 2033, US$ Bn
- Key Market Trends
- Industry Developments and Key Market Events
- Demand Side and Supply Side Analysis
- PMR Analysis and Recommendations
- Market Overview
- Market Scope and Definitions
- Value Chain Analysis
- Macro-Economic Factors
- Global GDP Outlook
- Global Consumer Goods Industry Overview
- Forecast Factors - Relevance and Impact
- COVID-19 Impact Assessment
- PESTLE Analysis
- Porter's Five Forces Analysis
- Geopolitical Tensions: Market Impact
- Regulatory and Technology Landscape
- Market Dynamics
- Drivers
- Restraints
- Opportunities
- Trends
- Price Trend Analysis, 2020 - 2033
- Region-wise Price Analysis
- Price by Segments
- Price Impact Factors
- Global Bar and Wine Tools Market Outlook: Historical (2020 - 2025) and Forecast (2026 - 2033)
- Key Highlights
- Global Bar and Wine Tools Market Outlook: By Product Type
- Introduction/Key Findings
- Historical Market Size (US$ Bn) and Volume (Units) Analysis by By Product Type, 2020-2025
- Current Market Size (US$ Bn) and Volume (Units) Forecast, by By Product Type, 2026-2033
- Cocktails
- Flasks
- Stirrers
- Shakers
- Jiggers
- Others
- Wine
- Corkscrews
- Bottle Openers
- Bottle Stoppers
- Drip Catchers
- Preservers
- Pourers
- Smoking
- Cigar Humidors
- Smoking Accessories
- Cocktails
- Market Attractiveness Analysis: By Product Type
- Global Bar and Wine Tools Market Outlook: By Distribution Channel
- Introduction/Key Findings
- Historical Market Size (US$ Bn) and Volume (Units) Analysis by By Distribution Channel, 2020-2025
- Current Market Size (US$ Bn) and Volume (Units) Forecast, by By Distribution Channel, 2026-2033
- Online Channels
- Offline Channels
- Market Attractiveness Analysis: By Distribution Channel
- Global Bar and Wine Tools Market Outlook: By Application
- Introduction/Key Findings
- Historical Market Size (US$ Bn) and Volume (Units) Analysis by By Application, 2020-2025
- Current Market Size (US$ Bn) and Volume (Units) Forecast, by By Application, 2026-2033
- Households
- Bar and Wine Shops
- Restaurants
- Shops
- Others
- Market Attractiveness Analysis: By Application
- Global Bar and Wine Tools Market Outlook: Region
- Key Highlights
- Historical Market Size (US$ Bn) and Volume (Units) Analysis by Region, 2020-2025
- Current Market Size (US$ Bn) and Volume (Units) Forecast, by Region, 2026-2033
- North America
- Europe
- East Asia
- South Asia & Oceania
- Latin America
- Middle East & Africa
- Market Attractiveness Analysis: Region
- North America Bar and Wine Tools Market Outlook: Historical (2020 - 2025) and Forecast (2026 - 2033)
- Key Highlights
- Pricing Analysis
- North America Market Size (US$ Bn) and Volume (Units) Forecast, by Country, 2026-2033
- U.S.
- Canada
- North America Market Size (US$ Bn) and Volume (Units) Forecast, by By Product Type, 2026-2033
- Cocktails
- Flasks
- Stirrers
- Shakers
- Jiggers
- Others
- Wine
- Corkscrews
- Bottle Openers
- Bottle Stoppers
- Drip Catchers
- Preservers
- Pourers
- Smoking
- Cigar Humidors
- Smoking Accessories
- Cocktails
- North America Market Size (US$ Bn) and Volume (Units) Forecast, by By Distribution Channel, 2026-2033
- Online Channels
- Offline Channels
- North America Market Size (US$ Bn) and Volume (Units) Forecast, by By Application, 2026-2033
- Households
- Bar and Wine Shops
- Restaurants
- Shops
- Others
- Europe Bar and Wine Tools Market Outlook: Historical (2020 - 2025) and Forecast (2026 - 2033)
- Key Highlights
- Pricing Analysis
- Europe Market Size (US$ Bn) and Volume (Units) Forecast, by Country, 2026-2033
- Germany
- Italy
- France
- U.K.
- Spain
- Russia
- Rest of Europe
- Europe Market Size (US$ Bn) and Volume (Units) Forecast, by By Product Type, 2026-2033
- Cocktails
- Flasks
- Stirrers
- Shakers
- Jiggers
- Others
- Wine
- Corkscrews
- Bottle Openers
- Bottle Stoppers
- Drip Catchers
- Preservers
- Pourers
- Smoking
- Cigar Humidors
- Smoking Accessories
- Cocktails
- Europe Market Size (US$ Bn) and Volume (Units) Forecast, by By Distribution Channel, 2026-2033
- Online Channels
- Offline Channels
- Europe Market Size (US$ Bn) and Volume (Units) Forecast, by By Application, 2026-2033
- Households
- Bar and Wine Shops
- Restaurants
- Shops
- Others
- East Asia Bar and Wine Tools Market Outlook: Historical (2020 - 2025) and Forecast (2026 - 2033)
- Key Highlights
- Pricing Analysis
- East Asia Market Size (US$ Bn) and Volume (Units) Forecast, by Country, 2026-2033
- China
- Japan
- South Korea
- East Asia Market Size (US$ Bn) and Volume (Units) Forecast, by By Product Type, 2026-2033
- Cocktails
- Flasks
- Stirrers
- Shakers
- Jiggers
- Others
- Wine
- Corkscrews
- Bottle Openers
- Bottle Stoppers
- Drip Catchers
- Preservers
- Pourers
- Smoking
- Cigar Humidors
- Smoking Accessories
- Cocktails
- East Asia Market Size (US$ Bn) and Volume (Units) Forecast, by By Distribution Channel, 2026-2033
- Online Channels
- Offline Channels
- East Asia Market Size (US$ Bn) and Volume (Units) Forecast, by By Application, 2026-2033
- Households
- Bar and Wine Shops
- Restaurants
- Shops
- Others
- South Asia & Oceania Bar and Wine Tools Market Outlook: Historical (2020 - 2025) and Forecast (2026 - 2033)
- Key Highlights
- Pricing Analysis
- South Asia & Oceania Market Size (US$ Bn) and Volume (Units) Forecast, by Country, 2026-2033
- India
- Southeast Asia
- ANZ
- Rest of SAO
- South Asia & Oceania Market Size (US$ Bn) and Volume (Units) Forecast, by By Product Type, 2026-2033
- Cocktails
- Flasks
- Stirrers
- Shakers
- Jiggers
- Others
- Wine
- Corkscrews
- Bottle Openers
- Bottle Stoppers
- Drip Catchers
- Preservers
- Pourers
- Smoking
- Cigar Humidors
- Smoking Accessories
- Cocktails
- South Asia & Oceania Market Size (US$ Bn) and Volume (Units) Forecast, by By Distribution Channel, 2026-2033
- Online Channels
- Offline Channels
- South Asia & Oceania Market Size (US$ Bn) and Volume (Units) Forecast, by By Application, 2026-2033
- Households
- Bar and Wine Shops
- Restaurants
- Shops
- Others
- Latin America Bar and Wine Tools Market Outlook: Historical (2020 - 2025) and Forecast (2026 - 2033)
- Key Highlights
- Pricing Analysis
- Latin America Market Size (US$ Bn) and Volume (Units) Forecast, by Country, 2026-2033
- Brazil
- Mexico
- Rest of LATAM
- Latin America Market Size (US$ Bn) and Volume (Units) Forecast, by By Product Type, 2026-2033
- Cocktails
- Flasks
- Stirrers
- Shakers
- Jiggers
- Others
- Wine
- Corkscrews
- Bottle Openers
- Bottle Stoppers
- Drip Catchers
- Preservers
- Pourers
- Smoking
- Cigar Humidors
- Smoking Accessories
- Cocktails
- Latin America Market Size (US$ Bn) and Volume (Units) Forecast, by By Distribution Channel, 2026-2033
- Online Channels
- Offline Channels
- Latin America Market Size (US$ Bn) and Volume (Units) Forecast, by By Application, 2026-2033
- Households
- Bar and Wine Shops
- Restaurants
- Shops
- Others
- Middle East & Africa Bar and Wine Tools Market Outlook: Historical (2020 - 2025) and Forecast (2026 - 2033)
- Key Highlights
- Pricing Analysis
- Middle East & Africa Market Size (US$ Bn) and Volume (Units) Forecast, by Country, 2026-2033
- GCC Countries
- South Africa
- Northern Africa
- Rest of MEA
- Middle East & Africa Market Size (US$ Bn) and Volume (Units) Forecast, by By Product Type, 2026-2033
- Cocktails
- Flasks
- Stirrers
- Shakers
- Jiggers
- Others
- Wine
- Corkscrews
- Bottle Openers
- Bottle Stoppers
- Drip Catchers
- Preservers
- Pourers
- Smoking
- Cigar Humidors
- Smoking Accessories
- Cocktails
- Middle East & Africa Market Size (US$ Bn) and Volume (Units) Forecast, by By Distribution Channel, 2026-2033
- Online Channels
- Offline Channels
- Middle East & Africa Market Size (US$ Bn) and Volume (Units) Forecast, by By Application, 2026-2033
- Households
- Bar and Wine Shops
- Restaurants
- Shops
- Others
- Competition Landscape
- Market Share Analysis, 2025
- Market Structure
- Competition Intensity Mapping
- Competition Dashboard
- Company Profiles
- John Lewis & Partners
- Company Overview
- Product Portfolio/Offerings
- Key Financials
- SWOT Analysis
- Company Strategy and Key Developments
- Morris & Co.
- Alessi
- Vinturi
- Metrokane (Taylor Precision)
- Vintorio
- Zazzol
- Soireehome
- Aervana
- Tribellawin
- Vita Saggia
- Shenzhen Sinowin Wine Accessories
- Zhuhai Kelitong Electronic
- Trudeau Corporation
- Coravin
- John Lewis & Partners
- Appendix
- Research Methodology
- Research Assumptions
- Acronyms and Abbreviations

Loading page data
Please wait a moment


