


- Automotive Components & Materials
- TPMS Battery Market
TPMS Battery Market Size, Share, and Growth Forecast 2026 – 2033
TPMS Battery Market by Battery Type (Lithium Manganese Dioxide Battery, Lithium-ion Battery, Nickel Metal Hydride (NiMH) Battery), TPMS Type (Direct TPMS, Indirect TPMS), Vehicle Type (Passenger Vehicles, Commercial Vehicles), Sales Channel (OEM/OES, Aftermarket), and Regional Analysis for 2026–2033
TPMS Battery Market Size and Trend Analysis
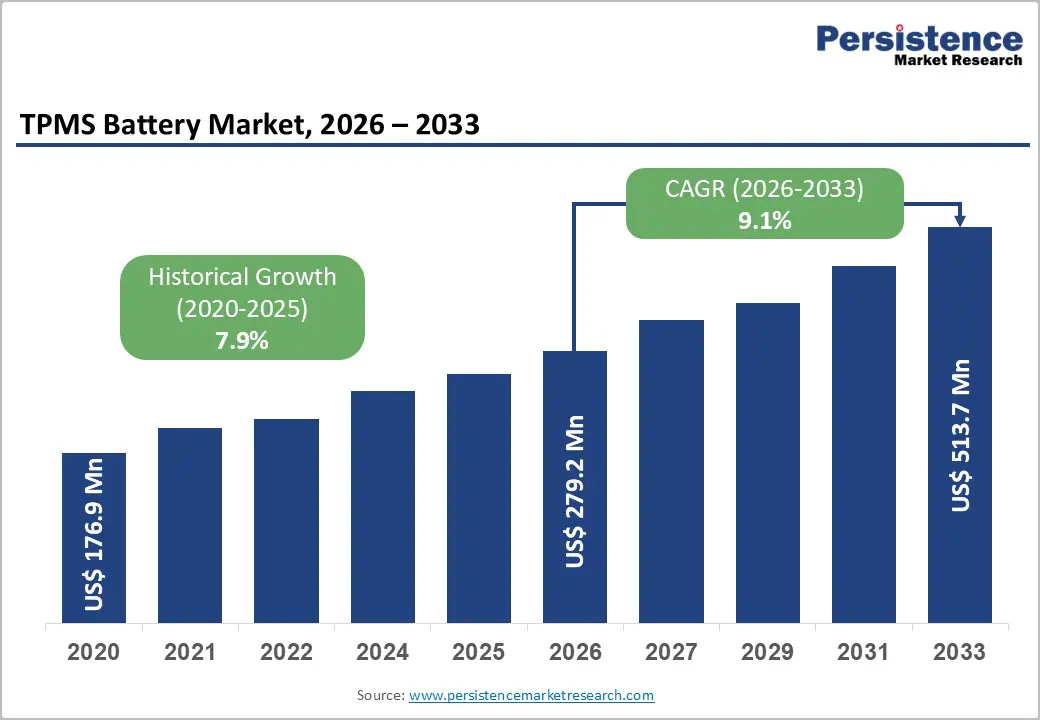
The global TPMS Battery market size is valued at US$ 279.2 Mn in 2026 and is projected to reach US$ 513.7 Mn, growing at a CAGR of 9.1% between 2026 and 2033.
It is driven by the global mandating of tire pressure monitoring systems across all new passenger and commercial vehicles, compounding demand for reliable, long-lasting power sources. Regulatory frameworks such as the U.S. TREAD Act, European Regulation (EC) No 661/2009, and similar mandates across China, South Korea, and India have collectively placed TPMS as a baseline safety feature, generating sustained battery replacement and OEM demand. Simultaneously, the accelerating global electric vehicle (EV) adoption has reinforced the requirement for advanced, lightweight battery chemistries within TPMS sensors, further fueling market expansion.
Key Industry Highlights:
- EV Integration Growth: Rapid electric vehicle adoption is accelerating demand for advanced lithium-based TPMS batteries, as EV platforms require lightweight, thermally stable, and high-performance sensor battery systems compatible with connected vehicle architectures.
- Lithium Chemistry Leadership: Lithium manganese dioxide batteries dominate with approximately 47% share in 2026, driven by superior temperature resistance, low self-discharge rates, cost efficiency, and strong automotive-grade reliability performance.
- Li-ion Segment Acceleration: Lithium-ion batteries represent the fastest-growing battery segment, projected to expand at an 11.4% CAGR supported by smart TPMS sensors, EV integration, and advanced wireless communication requirements.
- Direct TPMS Dominance: Direct TPMS systems account for approximately 72% share in 2026, benefiting from mandatory regulations, superior pressure accuracy, ADAS compatibility, and extensive deployment across passenger and electric vehicle platforms.
- Commercial Vehicle Momentum: Commercial vehicles are projected to grow at a 10.8% CAGR, fueled by expanding fleet electrification, tire safety regulations, and increasing TPMS adoption across heavy-duty transportation and logistics sectors globally.
- OEM Channel Leadership: OEM/OES sales channels dominate with approximately 62% revenue share in 2025, supported by long-term automotive supply agreements, regulatory compliance requirements, and large-scale factory-installed TPMS integration globally.
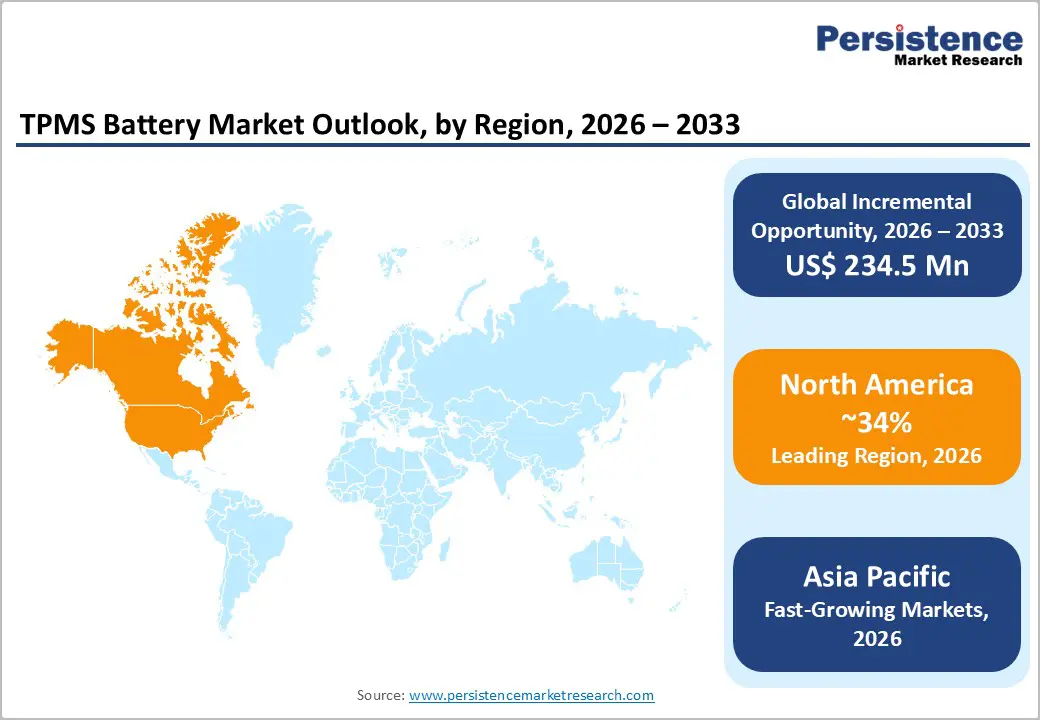
- North America Leadership: North America leads the global TPMS battery market with approximately 34% market share in 2026, supported by mature TPMS regulations, strong aftermarket replacement demand, and high electric vehicle penetration.
- India Growth Opportunity: India is projected to register the highest country-level CAGR of 12.1% driven by AIS 156 TPMS mandates, expanding vehicle production, and rapidly developing automotive aftermarket infrastructure.
Market Dynamics
Drivers - Mandatory TPMS Regulations Driving Systemic Battery Demand
Government-mandated installation of Tire Pressure Monitoring Systems (TPMS) across all new passenger and light commercial vehicles is the most significant and sustained driver for the TPMS battery market. In the United States, the Transportation Recall Enhancement, Accountability, and Documentation (TREAD) Act mandated TPMS on all new vehicles from 2008 onward. In the European Union, Regulation (EC) No 661/2009 made direct TPMS compulsory for all new type-approved vehicles from 2014.
Expanding mandates in China (GB 26149-2017), South Korea, Japan, and India are progressively enlarging the vehicle base requiring TPMS sensors. Each sensor unit typically requires a coin-cell or dedicated battery with a lifespan of 5–10 years, creating durable replacement cycles. With global new vehicle production exceeding 85 million units annually (per the International Organization of Motor Vehicle Manufacturers, OICA), the structural demand for TPMS batteries remains robust.
Rapid EV Adoption Intensifying Advanced Battery Chemistry Requirements
The rapid proliferation of Battery Electric Vehicles (BEVs) and Hybrid Electric Vehicles (HEVs) is significantly reshaping the TPMS battery technology landscape through Electric Vehicle Integration. EV manufacturers prioritize lightweight and thermally stable sensor batteries that can withstand the unique operating environments of EV platforms, including higher torque vibrations and wider temperature cycles.
According to the International Energy Agency (IEA)'s Global EV Outlook 2024, global electric car sales surpassed 14 million units in 2023, representing over 18% of all new car sales. This has directly accelerated demand for high-energy-density Lithium Battery Systems within TPMS sensors. Additionally, next-generation direct TPMS sensors in EVs are increasingly incorporating Bluetooth Low Energy (BLE) and UWB communication protocols, requiring more sophisticated and capable battery solutions compared to conventional vehicles, pushing the average unit value upward and stimulating market revenue growth.
Restraints - Limited Battery Lifespan and High Replacement Costs
The finite lifespan of sensor batteries, typically ranging from 5 to 10 years or approximately 100,000 miles, and once depleted, the battery is often sealed within the sensor unit, inviting a full sensor replacement rather than battery-only substitution. This increases total cost of ownership for vehicle owners, with sensor replacement costs ranging from US$ 50 to US$ 250 per sensor depending on vehicle make and model. This elevated replacement cost can lead some consumers, particularly in price-sensitive emerging markets, to defer or neglect TPMS sensor maintenance, thereby constraining consistent aftermarket demand growth for TPMS batteries.
Technical Limitations of Indirect TPMS Constraining Battery-Embedded Sensor Demand
Indirect TPMS systems, which rely on Anti-lock Braking System (ABS) wheel-speed sensors to estimate tire pressure without pressure-specific sensors, do not require dedicated TPMS batteries. In regions or vehicle segments where indirect systems remain permissible or preferred due to lower upfront costs, this limits the addressable market for battery-containing direct TPMS components. In several emerging economies, indirect TPMS is still widely deployed, as it represents a cost-effective compliance path. The European Tyre and Rubber Manufacturers' Association (ETRMA) has noted that cost considerations continue to influence OEM system selection, particularly in the entry-level vehicle segment, exerting downward pressure on direct TPMS battery volumes.
Opportunities - Expansion in Emerging Markets Driven by New TPMS Mandates
Emerging economies across South Asia, Southeast Asia, and Latin America represent a high-growth opportunity for the TPMS battery market as regulatory frameworks continue to evolve. India is advancing its Automotive Industry Standard (AIS) 156, progressively mandating TPMS across new vehicle categories. Brazil's CONTRAN Resolution No. 891/2021 has been laying groundwork for widespread TPMS implementation.
Combined, these markets represent hundreds of millions of vehicles that will progressively require TPMS-equipped sensors with dedicated battery systems. Automotive TPMS Solutions providers establishing early distribution and supply chain partnerships in these geographies are well-positioned to capture first-mover advantages. Additionally, the commercial vehicle segment across emerging markets including buses, trucks, and construction equipment represents a largely underpenetrated opportunity for premium-grade TPMS battery solutions.
Smart and Connected TPMS Sensors Enabling Next-Generation Wireless Monitoring Technology
The convergence of wireless monitoring technology with automotive safety systems is creating compelling opportunities for advanced TPMS battery manufacturers. Next-generation TPMS solutions are being engineered to communicate via Bluetooth Low Energy (BLE), Ultra-Wideband (UWB), and integrated Vehicle-to-Infrastructure (V2I) protocols, all of which require more energy-dense and longer-lasting battery solutions. Continental AG and Sensata Technologies have been actively developing smart TPMS sensor platforms with enhanced communication capabilities, per their published technical and investor communications.
The integration of TPMS sensors with broader connected vehicle architectures and fleet telematics systems further elevates battery performance requirements. Battery manufacturers developing ultra-long-life lithium solutions optimized for continuous low-power data transmission are expected to command significant premium pricing and brand differentiation within the evolving Automotive TPMS Solutions ecosystem.
Category-wise Analysis
Battery Type Insights
Lithium Manganese Dioxide (Li-MnO) batteries represent the dominant segment within the TPMS battery market, accounting for approximately 47% of total market share in 2025. This dominance is rooted in the distinctive physicochemical properties of lithium manganese dioxide chemistry, which delivers a nominal voltage of 3V compatible with the low-power sensor electronics typical of TPMS applications alongside an exceptionally wide operating temperature range of -40°C to +85°C.
These batteries exhibit low self-discharge rates, making them ideal for TPMS sensors that may remain dormant for extended periods during vehicle storage. Energizer Holdings and Panasonic Corporation are among the principal suppliers of Li-MnO coin cells for TPMS applications, per their publicly available product documentation. The combination of high reliability, low cost of manufacturing, and regulatory compliance for automotive-grade applications solidifies the segment's leadership within Lithium Battery Systems for TPMS.
Lithium-ion (Li-ion) batteries represent the fastest-growing segment within Battery Type, projected to grow at a CAGR of approximately 11.4% during 2026–2033, outpacing the overall market forecast CAGR. This is being driven by their adoption in next-generation smart TPMS sensors in EVs and premium vehicles, where higher energy density and rechargeable capability are valued, enabling longer sensor operational lifespans and integration with advanced wireless protocols.
TPMS Type Insights
Direct TPMS is the dominant segment within the TPMS Type category, commanding approximately 72% market share in 2025. Direct TPMS systems utilize battery-powered pressure sensors mounted inside each tire or on wheel rims, transmitting real-time pressure and temperature data to the vehicle's onboard computer. This architecture inherently requires a dedicated battery in each sensor typically four per vehicle making the direct TPMS segment the primary volume driver for the overall TPMS battery market.
Regulatory mandates in the U.S., European Union, China, and South Korea specifically require direct TPMS on new vehicles, reinforcing segment leadership. Furthermore, direct TPMS systems are preferred for premium and EV applications due to their superior accuracy, ability to identify individual tire pressure deviations, and compatibility with advanced driver assistance systems (ADAS). The integration of Tire Pressure Sensors in commercial fleets further bolsters direct TPMS battery demand.
Indirect TPMS is the fastest-growing segment in relative terms, projected at a CAGR of approximately 10.2% supported by its cost advantage in price-sensitive markets and ongoing adoption in entry-level vehicles across emerging economies in Asia Pacific and Latin America, even as direct systems maintain volume dominance.
Vehicle Type Insights
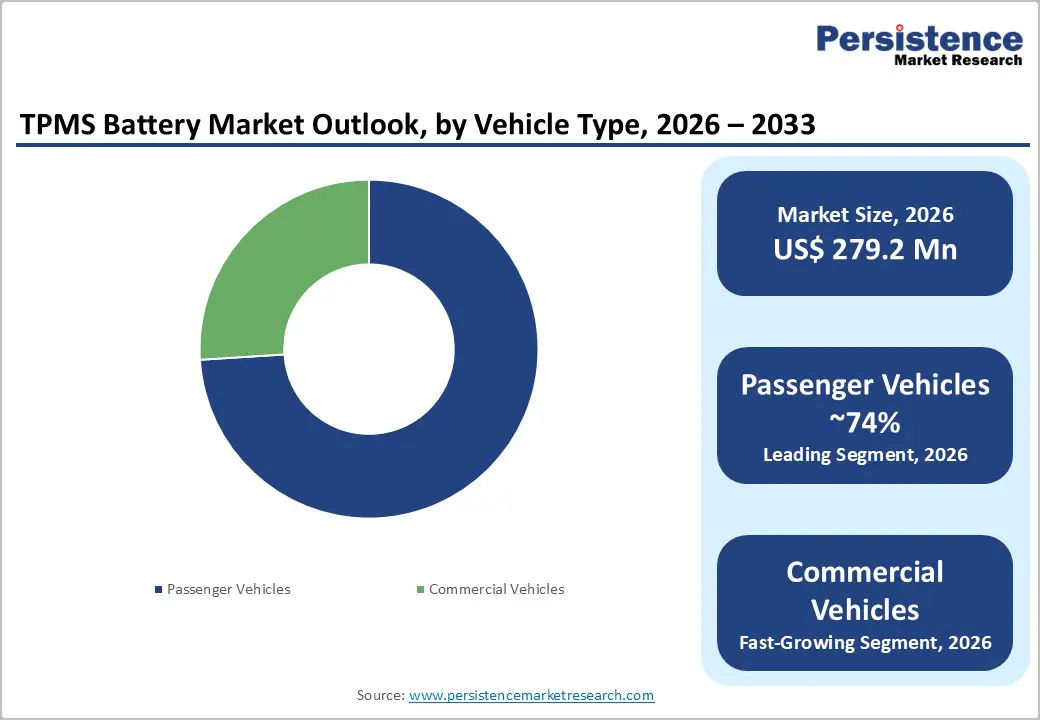
Passenger vehicles constitute the dominant segment in the vehicle type category, holding approximately 74% of total TPMS battery market share in 2026. This leadership position is attributable to the significantly larger global passenger vehicle fleet compared to commercial vehicles, combined with comprehensive regulatory mandates that universally apply to passenger cars. Global passenger car production, which OICA estimates at over 60 million units annually, translates to over 240 million TPMS battery units per year from OEM supply alone for new vehicles.
Additionally, the extensive installed base of vehicles manufactured post-2008 (in the U.S.) and post-2014 (in the EU) creates a substantial aftermarket replacement cycle. The growing adoption of premium features and advanced sensor technologies in passenger vehicles, including integration with Wireless Monitoring Technology platforms, further reinforces the passenger vehicle segment's dominant position.
Commercial vehicles represent the fastest-growing vehicle type segment, projected to expand at a CAGR of approximately 10.8% between 2026 and 2033. Increasing regulatory mandates for TPMS in heavy commercial vehicles across North America, Europe, and Asia Pacific driven by safety concerns around tire blowouts alongside robust fleet electrification trends, are key growth catalysts for this segment.
Sales Channel Insights
The OEM/OES (Original Equipment Manufacturer/Original Equipment Supplier) channel dominates the TPMS battery market, representing approximately 62% of total market revenue in 2025. OEM integration is driven by regulatory requirements that mandate TPMS as a factory-fitted feature in all new vehicles across major automotive markets. Tier-1 automotive suppliers including Continental AG, Sensata Technologies, and Pacific Industrial Co., Ltd. supply complete TPMS sensor assemblies including batteries directly to vehicle manufacturers.
The OEM channel benefits from high volume, long-term supply agreements, and quality standardization requirements that favor established battery manufacturers with automotive-grade certifications such as IATF 16949. The predictability of OEM demand, tied to global vehicle production schedules, provides stable revenue visibility for battery suppliers operating in this channel.
The aftermarket channel is the fastest-growing sales channel, projected at a CAGR of approximately 11.7% for 2026–2033. As the fleet of TPMS-equipped vehicles ages, battery replacements and full sensor replacements drive robust aftermarket activity, particularly across North America and Europe where TPMS-equipped vehicle penetration is now nearly universal.
Regional Insights
North America TPMS Battery Trends
North America leads the global TPMS battery market, accounting for approximately 34% of total market revenue in 2025, underpinned by the region's pioneering regulatory framework. The TREAD Act (2000) was among the world's earliest TPMS mandates, resulting in a mature, high-penetration vehicle fleet with over 280 million registered vehicles (per the U.S. Federal Highway Administration), all of which are TPMS-equipped for model year 2008 onward. This creates a consistently strong aftermarket battery replacement cycle as sensor batteries age out across tens of millions of vehicles annually.
Canada and Mexico are increasingly aligning vehicle safety standards with U.S. requirements, broadening the regional TPMS-equipped vehicle base. The commercial vehicle segment is growing rapidly in North America, with the Federal Motor Carrier Safety Administration (FMCSA) increasingly scrutinizing tire safety compliance in the trucking sector. Additionally, the region's strong EV adoption trajectory, led by Tesla, GM, and Ford EV platforms, is advancing demand for next-generation Automotive TPMS Solutions with advanced lithium battery chemistries.
U.S.: Pioneer TPMS Regulation Sustaining Deep Aftermarket Battery Penetration
The United States is the single largest country market within North America, representing approximately 85% of the regional TPMS battery revenue and growing at an estimated CAGR of 8.6% for 2026–2033. The U.S. stands apart due to its two-decade-long regulatory implementation history virtually all light vehicles on U.S. roads manufactured after 2008 contain factory-installed TPMS sensor batteries entering active replacement cycles.
The U.S. aftermarket automotive parts sector, valued at over US$ 350 billion (per the Auto Care Association), provides a well-established distribution infrastructure for TPMS battery and sensor replacements. EV penetration rates among the highest in the world and a high concentration of premium vehicle ownership also drive demand for advanced lithium-based sensor battery technologies in the country.
Europe TPMS Battery Trends
Europe represents the second-largest regional market for TPMS batteries, holding approximately 28% of global market revenue in 2025, supported by comprehensive EU-wide direct TPMS mandates that took full effect in 2014 under EU Regulation 661/2009. The strong presence of premium automotive OEMs including Volkswagen Group, BMW Group, Stellantis, and Mercedes-Benz drives consistent OEM-channel TPMS battery demand at high per-unit average selling prices.
Europe's ambitious vehicle electrification targets, underpinned by the European Green Deal and the EU's 2035 ban on new ICE vehicle sales, are accelerating the shift to EV platforms that require enhanced TPMS battery chemistries. Regulatory harmonization efforts by the United Nations Economic Commission for Europe (UNECE) further support uniform TPMS standards across the continent, maintaining stable demand.
Germany TPMS Battery Market Size Analysis
Germany accounts for approximately 22% of the European TPMS battery market, growing at a CAGR of 8.9% through 2033, reflecting its status as the manufacturing heartland of Europe's premium automotive sector. The headquarters of BMW, Mercedes-Benz, Volkswagen, and Audi ensure sustained high-volume OEM demand for premium TPMS batteries.
Germany's advanced EV rollout, including significant investments by Volkswagen Group's EV platform (MEB), is a key catalyst for advanced lithium-ion TPMS battery solutions. Germany's robust automotive aftermarket, supported by a dense network of independent workshops and parts distributors, also provides strong secondary demand.
UK TPMS Battery Market Size Analysis
United Kingdom holds approximately 14% of the European TPMS battery market, with a projected CAGR of 9.2%. Post-Brexit, the U.K. has maintained TPMS regulatory standards broadly aligned with EU frameworks via the UK Road Vehicles (Approval) Regulations 2020. The U.K.'s ambitious EV adoption agenda targeting 100% zero-emission new car sales by 2035 is steadily increasing the proportion of EVs requiring advanced TPMS battery solutions. High vehicle parc density and strong consumer awareness of tire safety further support robust aftermarket TPMS battery sales.
France TPMS Battery Market Size Analysis
France represents approximately 13% of Europe's TPMS battery market, projected at a CAGR of 9.0% for 2026–2033. French government incentives for EV adoption under the Bonus Écologique scheme and fleet electrification mandates are driving growth in EV-compatible advanced TPMS batteries. Stellantis and Renault Group both headquartered in France are scaling EV production on domestic platforms, increasing OEM demand for sophisticated sensor battery systems.
Italy TPMS Battery Market Size Analysis
Italy holds approximately 10% of the European regional market, with a CAGR of 8.5% projected for 2026–2033. Italy's large registered vehicle fleet approximately 39 million vehicles per ANFIA (Associazione Nazionale Filiera Industria Automobilistica) with a significant proportion of TPMS-equipped vehicles entering mid-lifecycle battery replacement windows, underpins strong aftermarket TPMS battery demand. The presence of Pirelli and other Italian tire safety stakeholders further elevates awareness around TPMS maintenance.
Asia Pacific TPMS Battery Market Trends
Asia Pacific is the fastest-growing regional market for TPMS batteries, representing approximately 24% of global market revenue in 2025 and anticipated to accelerate through 2033. China's GB 26149-2017 standard mandates TPMS on all new passenger vehicles produced or imported since 2019, making it one of Asia's most comprehensive frameworks, while Japan and South Korea enforce TPMS through their respective domestic vehicle safety regulations.
Manufacturing cost advantages across China, South Korea, and Japan position Asia Pacific as both a major production and consumption hub for TPMS batteries. The region's EV market is the world's largest and fastest-growing with China alone selling over 8 million EVs in 2023 (per China Association of Automobile Manufacturers, CAAM) driving significant demand for EV-optimized Electric Vehicle Integration compatible TPMS battery solutions across the region.
China: Largest EV Market Fueling Mass-Scale TPMS Battery Manufacturing and Consumption
China dominates the Asia Pacific TPMS battery market with approximately 52% regional share, growing at a CAGR of 10.3% through 2033, making it one of the fastest-expanding country markets globally. China's New Energy Vehicle (NEV) mandate and its world-leading EV production ecosystem including manufacturers such as BYD, SAIC, and NIO are driving unprecedented demand for advanced TPMS battery chemistries suited to EV operating conditions. Domestic battery manufacturers including CATL and EVE Energy are increasingly active in the TPMS battery component supply chain, leveraging vertically integrated lithium cell production capabilities.
India: Emerging TPMS Mandate Landscape Creating Untapped High-Growth Battery Opportunity
India accounts for approximately 12% of the Asia Pacific TPMS battery market in 2025, projected to grow at a CAGR of 12.1% the highest among major country markets globally as it transitions from voluntary to mandatory TPMS requirements under AIS 156 Phase 2. India's vehicle production is scaling rapidly, with the Society of Indian Automobile Manufacturers (SIAM) projecting sustained double-digit growth in new vehicle registrations. The large population of new vehicles entering the market with TPMS compliance requirements, combined with expanding aftermarket infrastructure, positions India as one of the most attractive emerging country-level opportunities for TPMS battery market participants.
South Korea: Advanced Sensor R&D Hub Pioneering Next-Gen TPMS Battery Integration
South Korea holds approximately 14% of the Asia Pacific TPMS battery market, growing at a CAGR of 9.8% through 2033. The country's advanced automotive manufacturing ecosystem, anchored by Hyundai Motor Group and Kia Corporation, drives consistent OEM-channel TPMS battery demand. South Korea's strong battery manufacturing capabilities home to Samsung SDI, LG Energy Solution, and SK Innovation provide distinct advantages in developing and supplying next-generation lithium-ion TPMS batteries optimized for EV and connected vehicle platforms, reinforcing the country's strategic role in the global TPMS battery supply chain.
Competitive Landscape
The TPMS battery market exhibits a moderately consolidated structure at the battery chemistry level, with a handful of established electrochemical manufacturers notably Energizer Holdings, Panasonic Corporation, and Varta AG commanding significant share in the lithium cell supply sub-segment. At the integrated TPMS sensor system level, the market is led by Tier-1 automotive suppliers including Continental AG, Sensata Technologies, and Pacific Industrial Co., Ltd.
Key competitive strategies include investing in proprietary lithium chemistries tailored for automotive-grade temperature and vibration tolerance, building long-term OEM supply agreements, and pursuing product certifications such as AEC-Q200 and IATF 16949. Emerging competition from Asian battery manufacturers is intensifying price competition in mid-tier and aftermarket segments.
Key Developments:
- January 2025: Sensata Technologies announced the launch of its next-generation TPMS sensor platform featuring enhanced Bluetooth Low Energy connectivity and extended battery life, targeting both OEM and aftermarket segments in EV applications.
- March 2024: Continental AG unveiled its advanced direct TPMS sensor with integrated UWB communication capability, designed for luxury EVs, incorporating a new-generation lithium cell optimized for broader temperature performance.
- September 2023: Varta AG expanded its automotive-grade lithium coin cell production capacity in Germany to meet growing OEM demand for high-performance TPMS battery components from European vehicle manufacturers.
Companies Covered in TPMS Battery Market
- Continental AG
- Sensata Technologies
- Panasonic Corporation
- Energizer Holdings
- Varta AG
- Pacific Industrial Co., Ltd.
- Hella GmbH & Co. KGaA
- Denso Corporation
Frequently Asked Questions
The global TPMS Battery market is estimated to be valued at US$ 279.2 Mn in 2026 and is projected to reach US$ 513.7 Mn by 2033, registering a CAGR of 9.1% between 2026 and 2033, up from US$ 176.9 Mn in 2020.
The primary growth drivers include mandatory government regulations requiring TPMS on all new vehicles across the U.S. (TREAD Act), EU (Regulation 661/2009), China (GB 26149-2017), and emerging markets, alongside the rapid global adoption of electric vehicles that demand advanced, lightweight lithium battery chemistries for sensor applications.
The Lithium Manganese Dioxide (Li-MnO₂) Battery segment dominates, holding approximately 47% of total market share in 2025. This leadership is attributed to its 3V output, wide operating temperature range (-40°C to +85°C), low self-discharge, and long operational lifespan matching TPMS sensor requirements.
North America is the leading region, accounting for approximately 34% of global market revenue in 2026. This is driven by comprehensive TPMS mandates under the TREAD Act since 2008, a large mature vehicle fleet generating consistent battery replacement demand, and the region's high EV adoption rates accelerating advanced battery chemistry requirements.
The most significant opportunity lies in the development of advanced lithium battery solutions for next-generation smart and connected TPMS sensors that utilize BLE, UWB, and V2I communication protocols. As EVs and connected vehicles proliferate globally, demand for high-energy-density, long-life batteries capable of supporting continuous wireless data transmission will command premium pricing.
Leading companies operating in the TPMS Battery market include Continental AG, Sensata Technologies (Schrader), Panasonic Corporation, Energizer Holdings, Varta AG, Pacific Industrial Co., Ltd., Hella GmbH & Co. KGaA, and Denso Corporation, among others.


