

- Executive Summary
- U.S. Dishwasher Market Snapshot 2025 and 2032
- Market Opportunity Assessment, 2025 - 2032, US$ Mn
- Key Market Trends
- Industry Developments and Key Market Events
- Demand Side and Supply Side Analysis
- PMR Analysis and Recommendations
- Market Overview
- Market Scope and Definitions
- Value Chain Analysis
- Macro-Economic Factors
- GDP Outlook
- U.S. Consumer Electronics Market
- U.S. Per Capita Spending on Electronics
- Other Macro-Economic Factors
- Forecast Factors - Relevance and Impact
- COVID-19 Impact Assessment
- PESTLE Analysis
- Porter's Five Forces Analysis
- Geopolitical Tensions: Market Impact
- Regulatory and Technology Landscape
- Market Dynamics
- Drivers
- Restraints
- Opportunities
- Trends
- Price Trend Analysis, 2019 - 2032
- Region-wise Price Analysis
- Price by Segments
- Price Impact Factors
- U.S. Dishwasher Market Outlook:
- Key Highlights
- U.S. Dishwasher Market Outlook: Product Type
- Introduction/Key Findings
- Historical Market Size (US$ Mn) and Volume (Units) Analysis by Product Type, 2019-2024
- Current Market Size (US$ Mn) and Volume (Units) Analysis and Forecast, by Product Type, 2025-2032
- Freestanding
- Built-in
- Market Attractiveness Analysis: Product Type
- U.S. Dishwasher Market Outlook: Price Range
- Introduction/Key Findings
- Historical Market Size (US$ Mn) and Volume (Units) Analysis by Price Range, 2019-2024
- Current Market Size (US$ Mn) and Volume (Units) Analysis and Forecast, by Price Range, 2025-2032
- Below US$ 500
- US$ 500 - 1,000
- US$ 1,000 - 2,500
- US$ 2,500 and Above
- Market Attractiveness Analysis: Price Range
- U.S. Dishwasher Market Outlook: Application
- Introduction/Key Findings
- Historical Market Size (US$ Mn) and Volume (Units) Analysis by Application, 2019-2024
- Current Market Size (US$ Mn) and Volume (Units) Analysis and Forecast, by Application, 2025-2032
- Residential
- Commercial
- Market Attractiveness Analysis: Application
- U.S. Dishwasher Market Outlook: Sales Channel
- Introduction/Key Findings
- Historical Market Size (US$ Mn) and Volume (Units) Analysis by Sales Channel, 2019-2024
- Current Market Size (US$ Mn) and Volume (Units) Analysis and Forecast, by Sales Channel, 2025-2032
- Online
- Offline
- Market Attractiveness Analysis: Sales Channel
- U.S. Dishwasher Market Outlook: Region
- Introduction/Key Findings
- Historical Market Size (US$ Mn) and Volume (Units) Analysis by Region, 2019-2024
- Current Market Size (US$ Mn) and Volume (Units) Analysis and Forecast, by Region 2025-2032
- Northeast
- Southeast
- Midwest
- Southwest
- West
- Market Attractiveness Analysis: Region
- Competition Landscape
- Market Share Analysis, 2024
- Market Structure
- Competition Intensity Mapping
- Competition Dashboard
- Company Profiles
- BSH Home Appliances Corporation
- Company Overview
- Product Portfolio/Offerings
- Key Financials
- SWOT Analysis
- Company Strategy and Key Developments
- Maytag Corporation
- KitchenAid
- Kenmore
- Frigidaire Appliance Company
- Amana Corporation
- Electrolux AB
- Samsung Electronics Co., Ltd
- LG appliance
- Sunpentown International Inc.
- Danby Products Inc
- Whirlpool Corporation
- Haier America Company LLC
- GE Appliances (Haier)
- BPL Ltd.
- BSH Home Appliances Corporation
- Appendix
- Research Methodology
- Research Assumptions
- Acronyms and Abbreviations


- Home Appliances
- U.S. Dishwasher Market
U.S. Dishwasher Market Size, Trends, Share, and Growth Forecast 2025 - 2032
U.S. Dishwasher Market by Product Type (Freestanding and Built-in), Price Range (Below US$ 500, US$ 500 - 1,000, US$ 1,000 - 2,500, and US$ 2,500 and Above), Application (Residential and Commercial), Sales Channel (Sales Channel and Offline), and Analysis for 2025 - 2032
Key Market Highlights:
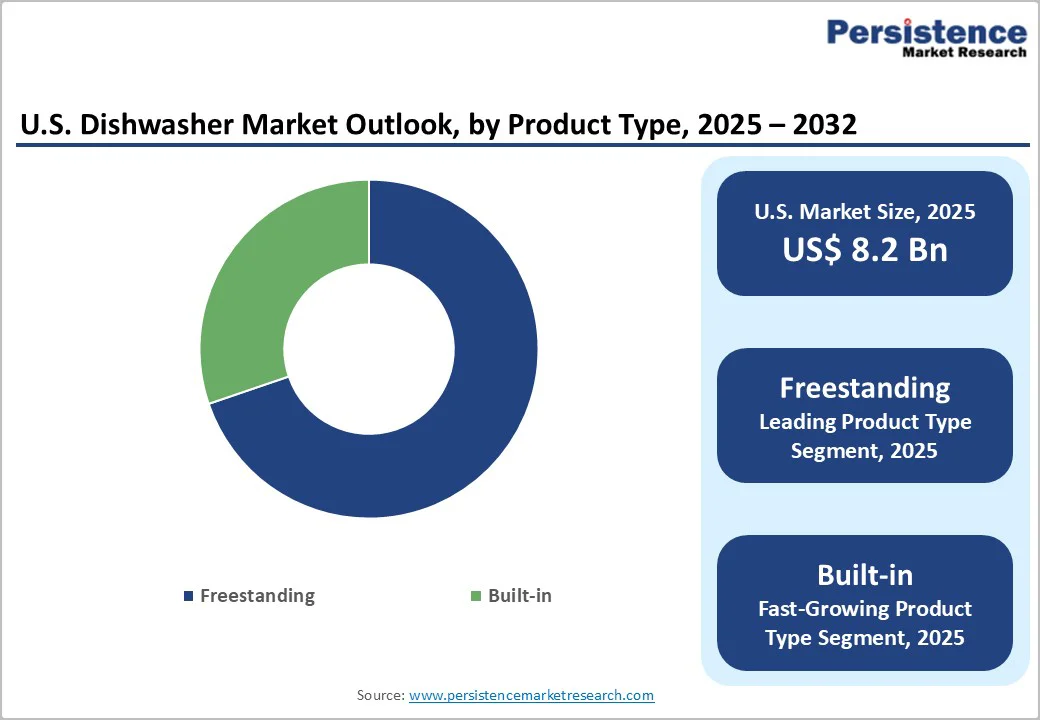
- Dominant Product Type: Freestanding Dishwashers command the largest product type at approximately 56% market share, driven by affordability, flexibility, and ease of installation, supporting mainstream consumer adoption and market accessibility.
- Fastest Growing Product Type: Built-In Dishwashers represent the fastest-growing product category at 7.9% CAGR through 2030, driven by home renovation trends, integrated kitchen design preferences, and new residential construction supporting premium market expansion.
- Dominant Application: Residential category to dominate the application category with 88% market share amid widespread adoption of dishwashers in dual-income households.
- Fastest Growing Application: Commercial application to witness the highest growth rate of 7.2% amid strong demand from the hospitality and restaurant industries across the U.S.
- Key Market Opportunity: Smart dishwasher technology integration with IoT and voice control capabilities, enabling premium pricing realization and consumer willingness to pay 15-20% premiums for advanced connected features supporting margin expansion.
| Key Insights | Details |
|---|---|
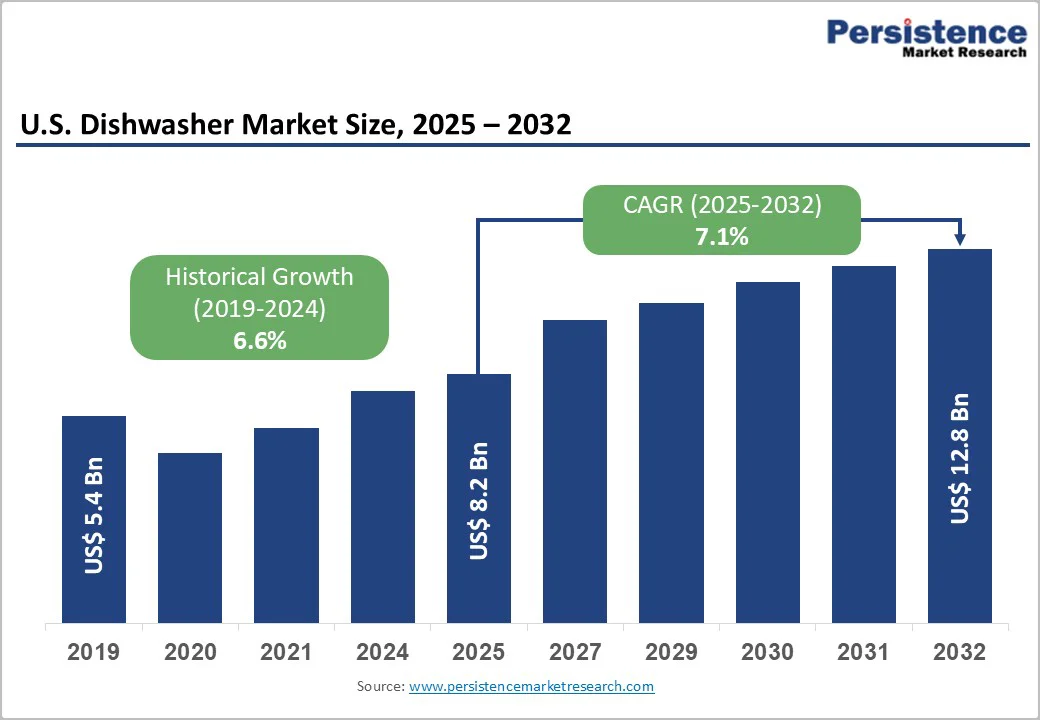
| Dishwasher Market Size (2025E) | US$ 8.2 Bn |
| Market Value Forecast (2032F) | US$ 12.8 Bn |
| Projected Growth CAGR (2025 - 2032) | 7.1% |
| Historical Market Growth (2019 - 2024) | 6.6% |
Market Dynamics
Drivers - Rising Adoption of Smart & Connected Home Appliances
Growing consumer preference for convenience-focused appliances creates exceptional market opportunity for dishwasher adoption, supporting modern American households. Dual-income families now representing approximately 50% of U.S. households, requiring time-saving home solutions addressing busy lifestyle demands.
Urban living and hectic work schedules making dishwashers essential rather than luxury appliances. Consumer surveys indicating 68% of U.S. households view dishwashers as essential kitchen appliances, reflecting significant shift from prior perception as luxury items.
Post-pandemic household preferences favor convenience and hygiene solutions, with dishwasher sales growing over 12% in 2021 compared to pre-pandemic levels. Dishwasher penetration expanding across residential and commercial segments, supporting market broadening.
Advanced wash cycles and features, including express wash, automatic detergent dispensing, and specialized cleaning modes enabling handling of diverse dishware requirements. Market expansion reflects fundamental lifestyle shift toward convenience-driven consumer behavior, supporting sustained industry growth.
Smart Home Technology Integration and Energy Efficiency Focus
Smart home ecosystem expansion and environmental consciousness drive market growth through technology integration and sustainable product adoption. 43% of U.S. households owning at least one smart home device, creating an ecosystem where dishwashers with voice control and IoT compatibility gain mainstream adoption.
Consumers are willing to pay a 15-20% premium for smart-enabled dishwashers with remote monitoring and Wi-Fi connectivity, demonstrating strong market pull for advanced features. ENERGY STAR-certified models represented nearly 70% of dishwasher sales in 2023, reflecting strong consumer demand for sustainable products.
EPA regulations and government incentives supporting energy-efficient and water-conserving appliances are driving adoption. Technological innovations including soil sensors, noise reduction technology below 40 decibels, and water-recycling capabilities enhancing product appeal.
Smart dishwashers compatible with Alexa and Google Home voice assistants supporting seamless smart home integration. Technology advancement supports competitive differentiation and premium pricing realization.
Restraints - High Purchase Price and Installation Costs Limiting Market Penetration
Premium dishwashers equipped with smart features and energy-efficient technologies costing upwards of US$ 1,000 restricting affordability for many consumer segments. Built-in dishwasher installation requiring professional plumbing and cabinetry modifications adding significant additional expenses beyond purchase price.
Repair and maintenance costs including specialized parts and servicing deterring adoption particularly among lower-income households. Nearly 43% of U.S. households still perceiving dishwashers as luxury items rather than necessities limiting market expansion. Rental housing market constraints with limited tenant modifications restricting addressable market.
Saturation in Premium Markets and Competition from Alternative Solutions
Market saturation in affluent households with dishwashers already widely adopted limiting incremental growth potential. Increased competition from new manufacturers including Asian entrants driving price pressure and margin compression.
Portable and compact dishwashers facing affordability advantages over traditional models capturing niche market segments. Manual washing preference persistence particularly in rural and low-income areas limiting addressable market.
Opportunities - Expanding Residential Construction and Kitchen Remodeling Activity
The rebound in U.S. residential construction, coupled with increased kitchen remodeling activity, offers significant growth potential for dishwasher manufacturers. New single-family and multifamily housing projects almost always include dishwashers as standard installations, ensuring steady OEM demand.
Rising home equity and post-pandemic lifestyle changes have encouraged homeowners to invest heavily in kitchen upgrades, particularly modern built-in appliances. Remodeling-driven purchases often favor premium, aesthetically appealing, and integrated dishwasher models that blend seamlessly with cabinetry.
The growing popularity of open kitchen layouts also increases consumer preference for low-noise, high-performance dishwashers. Builders and contractors tend to partner with appliance brands for bulk deals, creating opportunities for long-term supply contracts.
As households continue prioritizing comfort, convenience, and contemporary designs, the market for energy-efficient and visually appealing dishwashers will expand further. This construction and renovation wave will remain a key driver of new and replacement dishwasher installations across the United States.
Category-wise Analysis
Product Type Insights
Freestanding Dishwashers dominate the U.S. market, commanding approximately 56% market share driven by flexibility, affordability, and ease of installation. Freestanding models offering plug-and-play convenience requiring no permanent modifications supporting adoption particularly among renters and budget-conscious consumers.
Lower purchase price compared to built-in alternatives enabling broader market accessibility. Modern freestanding designs incorporating advanced features including smart connectivity, third-racks, and auto-release doors narrowing feature gap with premium alternatives. Portability and adaptability to diverse kitchen layouts supporting ongoing consumer preference.
Built-in dishwashers capturing 44% market share with fastest growth trajectory. Built-in models preferred for aesthetic integration with cabinetry and space optimization. Market leadership reflects affordability and installation flexibility advantages supporting mainstream adoption.
Price Range Insights
The US$ 500-1,000 price range has emerged as the largest price range category in the U.S. dishwasher market, accounting for around 42% of total demand. This category offers the ideal balance between affordability and advanced features, making it highly attractive to middle-income and upper-middle-income households, the core demographic driving appliance purchases.
Models in this range typically provide key value-added features such as stainless-steel tubs, low-noise operation, energy-efficient wash cycles, adjustable racks, and improved soil-sensing technologies that consumers increasingly consider essential.
As households prioritize reliable performance, durability, and modern functionality without premium costs, the US$ 500-1,000 segment continues to dominate overall market demand and replacement purchases in the U.S. dishwasher industry.
Application Insights
Residential Applications dominate market demand, accounting for approximately 88% of total dishwasher consumption through widespread household adoption. Residential segment growth driven by increasing disposable income and lifestyle preferences favoring convenience solutions.
Urban households preferring compact models while suburban homes adopting larger capacity units supporting market segmentation. Modular kitchen trends supporting built-in dishwasher integration in residential properties.
Commercial Applications capturing 12% market share through restaurant, hotel, and catering operations. Commercial segment growth supported by labor shortages and hygiene requirements driving equipment investment. Application diversification reflects market maturation supporting sustained growth.
Sales Channel Insights
Offline channel maintains dominant market share at approximately 62% through established retailer relationships and consumer preference for physical product evaluation. Big-box retailers and appliance specialty stores supporting mainstream dishwasher distribution through established infrastructure. In-store demonstrations and expert consultation enabling informed purchasing decisions.
Online Sales Channels capturing 38% market share at rapid growth rate. E-commerce expansion enabling broad product accessibility and price comparison functionality supporting consumer adoption. Direct manufacturer websites and third-party retailers expanding rapidly particularly among younger demographics.
Hybrid fulfillment models combining online ordering with local installation services gaining traction. Channel evolution reflects changing consumer purchasing preferences supporting diverse distribution strategies.

Competitive Landscape
The U.S. dishwasher market exhibits moderate to high consolidation with leading manufacturers Whirlpool Corporation, BSH Home Appliances Corporation, Electrolux AB, and Samsung Electronics collectively commanding approximately 60-65% market share through established brand recognition, extensive product portfolios, and integrated distribution networks.
Tier-two participants including GE Appliances (Haier), LG, and regional brands capture significant market segments through specialized product positioning and niche market focus.
Strategic R&D investments, technology innovation, and smart home integration drive competitive differentiation. Emerging competitors from Asia leveraging cost advantages and manufacturing scale supporting market penetration. Companies emphasize smart technology development, energy efficiency innovation, design aesthetics, and e-commerce channel expansion supporting competitive positioning and market share growth.
Key Market Developments
- In Febraury 2025, GE Profile introduces GE Profile Smart Compact Dishwasher designed for flexible installation supporting diverse kitchen configurations. This compact model addresses the growing need for appliances in non-traditional or smaller kitchen spaces, such as home bars, RVs, dorm rooms, or secondary kitchen areas.
- In July 2023, Bosch Home Appliances launches industry-first PowerControl spray arm technology in 800 and Benchmark Series models enhancing washing performance. The PowerControl spray arm allows users to select and concentrate the washing intensity to specific target areas (or quadrants) in the lower rack.
Companies Covered in U.S. Dishwasher Market
- BSH Home Appliances Corporation
- Maytag Corporation
- KitchenAid
- Kenmore
- Frigidaire Appliance Company
- Amana Corporation
- Electrolux AB
- Samsung Electronics Co., Ltd
- LG appliance
- Sunpentown International Inc.
- Danby Products Inc
- Whirlpool Corporation
- Haier America Company LLC
- GE Appliances (Haier)
- BPL Ltd.
Frequently Asked Questions
The U.S. dishwasher market was valued at US$ 8.2 billion in 2025 and is projected to reach US$ 12.8 billion by 2032, representing a CAGR of 6.6% during the forecast period.
Increasing consumer preference for convenience and time-saving home solutions, coupled with technological advancements leading to energy-efficient, smart-connected, and compact appliance models are primary factors driving demand.
Freestanding Dishwashers command the dominant segment at approximately 56% market share, driven by affordability, flexibility, ease of installation, and appeal to renters and budget-conscious consumers supporting mainstream market adoption.
Smart dishwasher technology integration with IoT and voice control capabilities represents the highest-value opportunity, with consumers willing to pay 15-20% premiums for advanced connected features, supporting margin expansion and premium market segment growth.
Market leaders include Whirlpool Corporation (United States) with extensive portfolio spanning Maytag and KitchenAid brands, BSH Home Appliances Corporation (Germany) with Bosch premium positioning, and Samsung Electronics Co., Ltd (South Korea) with smart technology leadership, collectively representing approximately 60-65% market concentration.


