


- Executive Summary
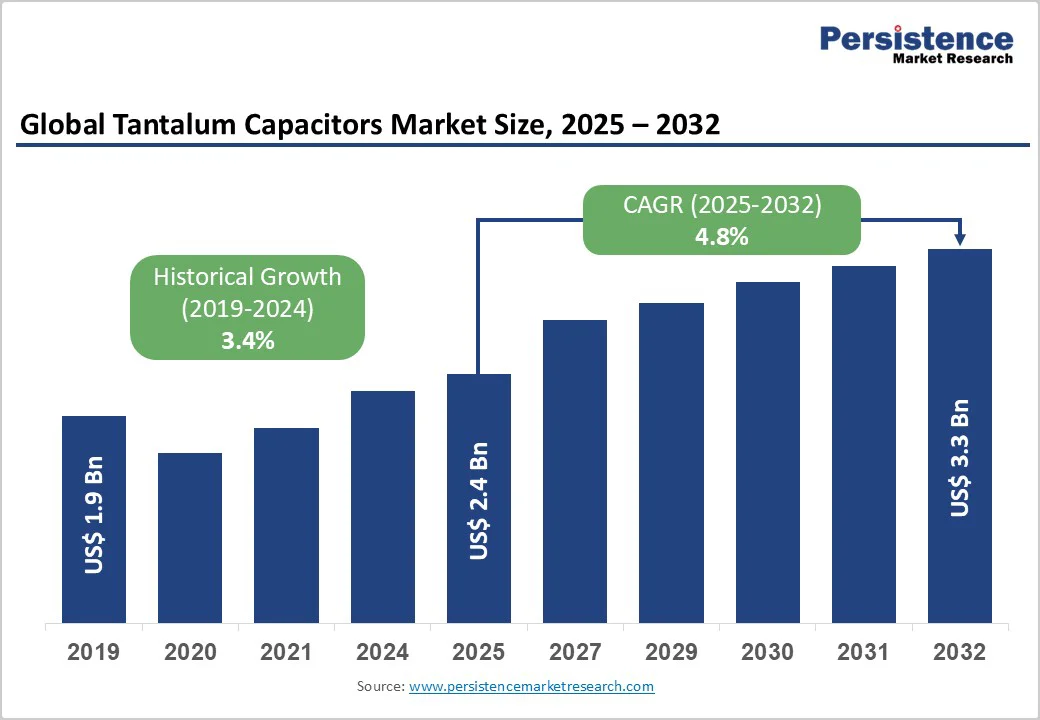
- Global Tantalum Capacitors Market Snapshot 2025 and 2032
- Market Opportunity Assessment, 2025-2032, US$ Bn
- Key Market Trends
- Industry Developments and Key Market Events
- Demand Side and Supply Side Analysis
- PMR Analysis and Recommendations
- Market Overview
- Market Scope and Definitions
- Value Chain Analysis
- Macro-Economic Factors
- Global GDP Outlook
- Digital Transformation and ICT Penetration
- Infrastructure Development Outlook
- Semiconductor & Electronics Capital Expenditure
- Telecom Infrastructure Rollouts
- Forecast Factors – Relevance and Impact
- COVID-19 Impact Assessment
- PESTLE Analysis
- Porter's Five Forces Analysis
- Geopolitical Tensions: Market Impact
- Regulatory and Technology Landscape
- Market Dynamics
- Drivers
- Restraints
- Opportunities
- Trends
- Price Trend Analysis, 2019 – 2032
- Region-wise Price Analysis
- Price by Product
- Price Impact Factors
- Global Tantalum Capacitors Market Outlook: Historical (2019 – 2024) and Forecast (2025 – 2032)
- Key Highlights
- Global Tantalum Capacitors Market Outlook: Product
- Introduction/Key Findings
- Historical Market Size (US$ Bn) and Volume (Units) Analysis by Product, 2019-2024
- Current Market Size (US$ Bn) and Volume (Units) Forecast, by Product, 2025-2032
- Solid Tantalum Capacitors
- Wet Tantalum Capacitors
- Polymer Tantalum Capacitors
- Market Attractiveness Analysis: Product
- Global Tantalum Capacitors Market Outlook: Mounting Type
- Introduction/Key Findings
- Historical Market Size (US$ Bn) and Volume (Units) Analysis by Mounting Type, 2019-2024
- Current Market Size (US$ Bn) and Volume (Units) Forecast, by Mounting Type, 2025-2032
- Surface-Mount
- Axial
- Radial
- Market Attractiveness Analysis: Mounting Type
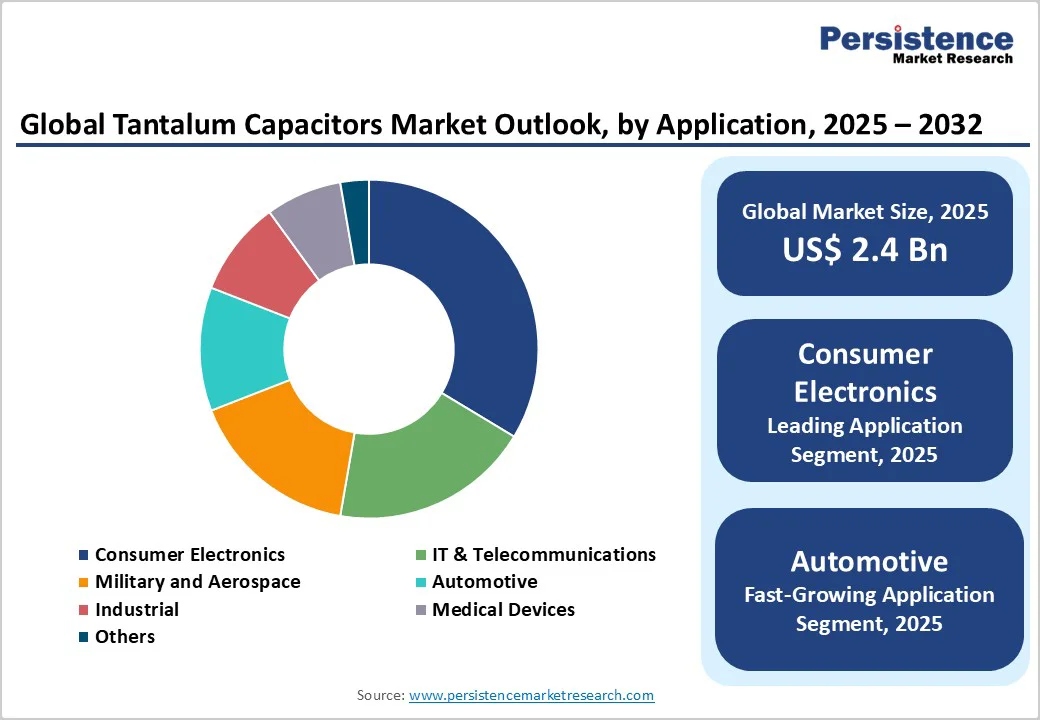
- Global Tantalum Capacitors Market Outlook: Application
- Introduction/Key Findings
- Historical Market Size (US$ Bn) and Volume (Units) Analysis by Application, 2019-2024
- Current Market Size (US$ Bn) and Volume (Units) Forecast, by Application, 2025-2032
- IT & Telecommunications
- Consumer Electronics
- Military and Aerospace
- Automotive
- Industrial
- Medical Devices
- Others
- Market Attractiveness Analysis: Application
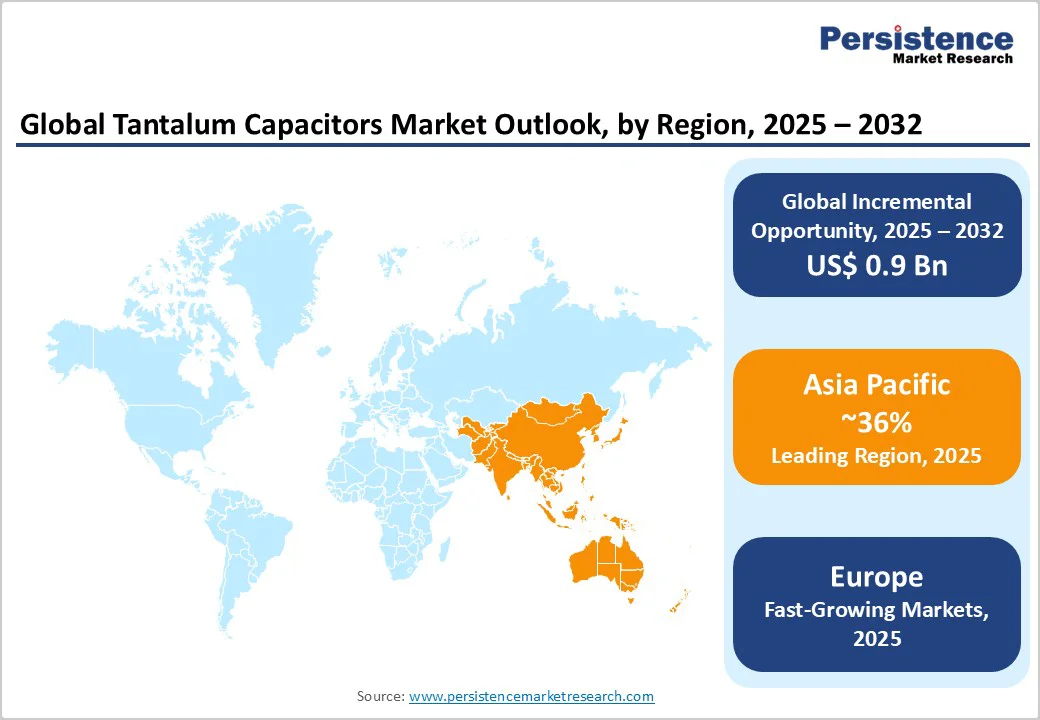
- Global Tantalum Capacitors Market Outlook: Region
- Key Highlights
- Historical Market Size (US$ Bn) and Volume (Units) Analysis by Region, 2019-2024
- Current Market Size (US$ Bn) and Volume (Units) Forecast, by Region, 2025-2032
- North America
- Europe
- East Asia
- South Asia & Oceania
- Latin America
- Middle East & Africa
- Market Attractiveness Analysis: Region
- North America Tantalum Capacitors Market Outlook: Historical (2019 – 2024) and Forecast (2025 – 2032)
- Key Highlights
- Pricing Analysis
- North America Market Size (US$ Bn) and Volume (Units) Forecast, by Country, 2025-2032
- U.S.
- Canada
- North America Market Size (US$ Bn) and Volume (Units) Forecast, by Product, 2025-2032
- Solid Tantalum Capacitors
- Wet Tantalum Capacitors
- Polymer Tantalum Capacitors
- North America Market Size (US$ Bn) and Volume (Units) Forecast, by Mounting Type, 2025-2032
- Surface-Mount
- Axial
- Radial
- North America Market Size (US$ Bn) and Volume (Units) Forecast, by Application, 2025-2032
- IT & Telecommunications
- Consumer Electronics
- Military and Aerospace
- Automotive
- Industrial
- Medical Devices
- Others
- Europe Tantalum Capacitors Market Outlook: Historical (2019 – 2024) and Forecast (2025 – 2032)
- Key Highlights
- Pricing Analysis
- Europe Market Size (US$ Bn) and Volume (Units) Forecast, by Country, 2025-2032
- Germany
- Italy
- France
- U.K.
- Spain
- Russia
- Benelux
- Nordics
- Rest of Europe
- Europe Market Size (US$ Bn) and Volume (Units) Forecast, by Product, 2025-2032
- Solid Tantalum Capacitors
- Wet Tantalum Capacitors
- Polymer Tantalum Capacitors
- Europe Market Size (US$ Bn) and Volume (Units) Forecast, by Mounting Type, 2025-2032
- Surface-Mount
- Axial
- Radial
- Europe Market Size (US$ Bn) and Volume (Units) Forecast, by Application, 2025-2032
- IT & Telecommunications
- Consumer Electronics
- Military and Aerospace
- Automotive
- Industrial
- Medical Devices
- Others
- East Asia Tantalum Capacitors Market Outlook: Historical (2019 – 2024) and Forecast (2025 – 2032)
- Key Highlights
- Pricing Analysis
- East Asia Market Size (US$ Bn) and Volume (Units) Forecast, by Country, 2025-2032
- China
- Japan
- South Korea
- East Asia Market Size (US$ Bn) and Volume (Units) Forecast, by Product, 2025-2032
- Solid Tantalum Capacitors
- Wet Tantalum Capacitors
- Polymer Tantalum Capacitors
- East Asia Market Size (US$ Bn) and Volume (Units) Forecast, by Mounting Type, 2025-2032
- Surface-Mount
- Axial
- Radial
- East Asia Market Size (US$ Bn) and Volume (Units) Forecast, by Application, 2025-2032
- IT & Telecommunications
- Consumer Electronics
- Military and Aerospace
- Automotive
- Industrial
- Medical Devices
- Others
- South Asia & Oceania Tantalum Capacitors Market Outlook: Historical (2019 – 2024) and Forecast (2025 – 2032)
- Key Highlights
- Pricing Analysis
- South Asia & Oceania Market Size (US$ Bn) and Volume (Units) Forecast, by Country, 2025-2032
- India
- Southeast Asia
- ANZ
- Rest of SAO
- South Asia & Oceania Market Size (US$ Bn) and Volume (Units) Forecast, by Product, 2025-2032
- Solid Tantalum Capacitors
- Wet Tantalum Capacitors
- Polymer Tantalum Capacitors
- South Asia & Oceania Market Size (US$ Bn) and Volume (Units) Forecast, by Mounting Type, 2025-2032
- Surface-Mount
- Axial
- Radial
- South Asia & Oceania Market Size (US$ Bn) and Volume (Units) Forecast, by Application, 2025-2032
- IT & Telecommunications
- Consumer Electronics
- Military and Aerospace
- Automotive
- Industrial
- Medical Devices
- Others
- Latin America Tantalum Capacitors Market Outlook: Historical (2019 – 2024) and Forecast (2025 – 2032)
- Key Highlights
- Pricing Analysis
- Latin America Market Size (US$ Bn) and Volume (Units) Forecast, by Country, 2025-2032
- Brazil
- Mexico
- Rest of LATAM
- Latin America Market Size (US$ Bn) and Volume (Units) Forecast, by Product, 2025-2032
- Solid Tantalum Capacitors
- Wet Tantalum Capacitors
- Polymer Tantalum Capacitors
- Latin America Market Size (US$ Bn) and Volume (Units) Forecast, by Mounting Type, 2025-2032
- Surface-Mount
- Axial
- Radial
- Latin America Market Size (US$ Bn) and Volume (Units) Forecast, by Application, 2025-2032
- IT & Telecommunications
- Consumer Electronics
- Military and Aerospace
- Automotive
- Industrial
- Medical Devices
- Others
- Middle East & Africa Tantalum Capacitors Market Outlook: Historical (2019 – 2024) and Forecast (2025 – 2032)
- Key Highlights
- Pricing Analysis
- Middle East & Africa Market Size (US$ Bn) and Volume (Units) Forecast, by Country, 2025-2032
- GCC Countries
- South Africa
- Northern Africa
- Rest of MEA
- Middle East & Africa Market Size (US$ Bn) and Volume (Units) Forecast, by Product, 2025-2032
- Solid Tantalum Capacitors
- Wet Tantalum Capacitors
- Polymer Tantalum Capacitors
- Middle East & Africa Market Size (US$ Bn) and Volume (Units) Forecast, by Mounting Type, 2025-2032
- Surface-Mount
- Axial
- Radial
- Middle East & Africa Market Size (US$ Bn) and Volume (Units) Forecast, by Application, 2025-2032
- IT & Telecommunications
- Consumer Electronics
- Military and Aerospace
- Automotive
- Industrial
- Medical Devices
- Others
- Competition Landscape
- Market Share Analysis, 2024
- Market Structure
- Competition Intensity Mapping
- Competition Dashboard
- Company Profiles
- KEMET Corporation
- Company Overview
- Product Portfolio/Offerings
- Key Financials
- SWOT Analysis
- Company Strategy and Key Developments
- AVX Corporation
- Vishay Intertechnology, Inc.
- Nichicon
- Murata Manufacturing Co., Ltd.
- TDK Corporation
- ROHM Co., Ltd.
- Samsung Electro-Mechanics
- NIC Components Corp.
- Hitachi AIC
- Exxelia
- Panasonic
- Xiangyee
- KEMET Corporation
- Appendix
- Research Methodology
- Research Assumptions
- Acronyms and Abbreviations

Loading page data
Please wait a moment


