


- LED & Lighting (Optoelectronics)
- Stadium Lighting Market
Stadium Lighting Market Size, Share, and Growth Forecast for 2025 - 2032
Stadium Lighting Market By Operation (Manual Control System, Automated Control System), by Application (Outdoor Stadium Lighting, Indoor Stadium Lighting), and Regional Analysis for 2025 - 2032
Stadium Lighting Market Size and Trends Analysis
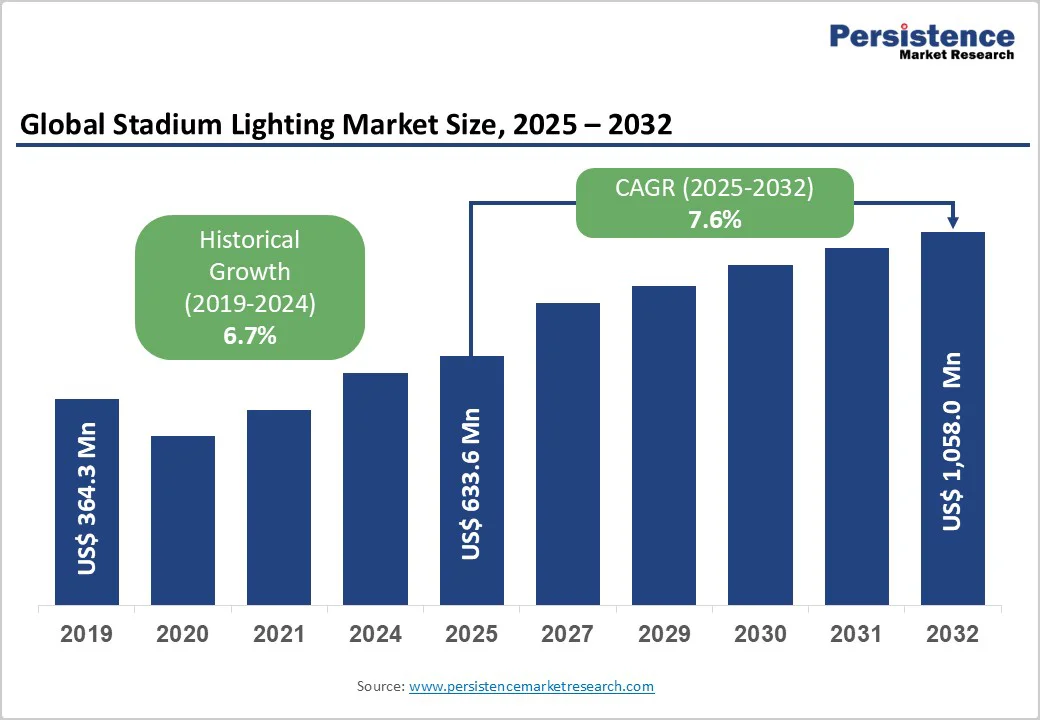
The global stadium lighting market size was valued at US$633.6 Million in 2025 and is projected to reach US$1,058.0 Million by 2032, growing at a CAGR of 7.6% during the forecast period from 2025 to 2032, driven by widespread adoption of energy-efficient LED technology, the expansion of sports infrastructure in emerging economies, and regulatory mandates for sustainability and broadcast quality. The shift from metal halide to LED systems offering 100,000-hour lifespans versus 6,000 hours for traditional lighting reduces operational costs and enhances spectator and broadcasting experiences.
Key Industry Highlights
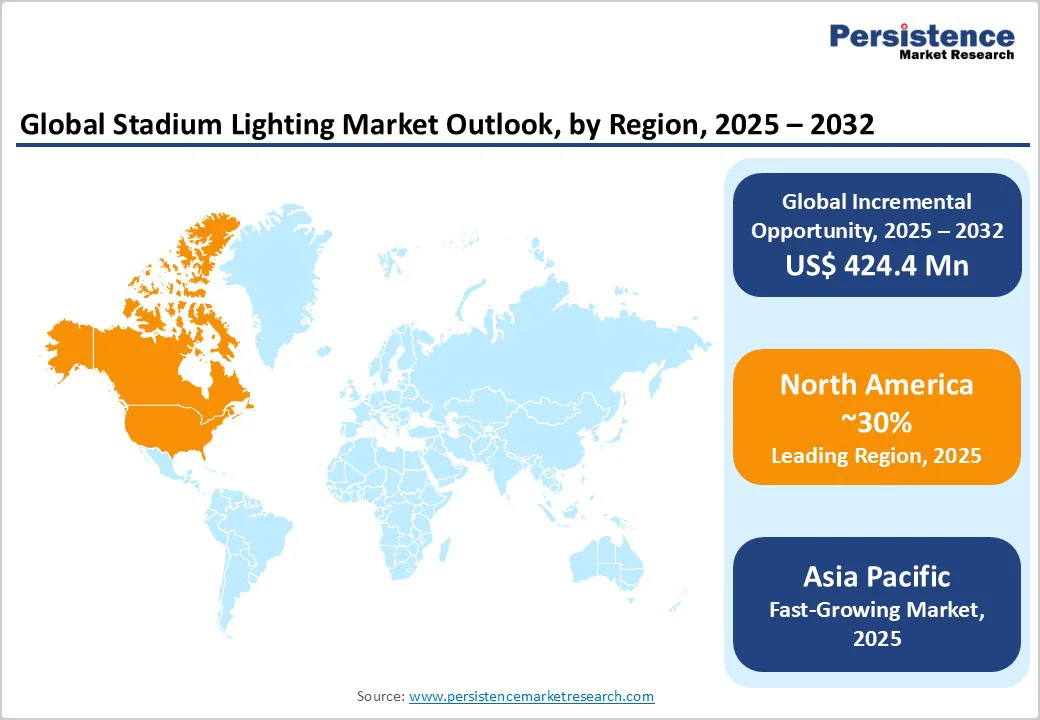
- Leading Region: North America leads the global market with an estimated 30% share in 2025, driven by the modernization of sports infrastructure, integration of smart lighting control systems, and increasing investments in energy-efficient lighting for major arenas and entertainment venues.
- Fastest-Growing Region: Asia Pacific is the fastest-growing region, supported by a surge in the construction of new sports facilities, government-led infrastructure initiatives, and the rising popularity of international sporting events in countries, including China, India, and Japan.
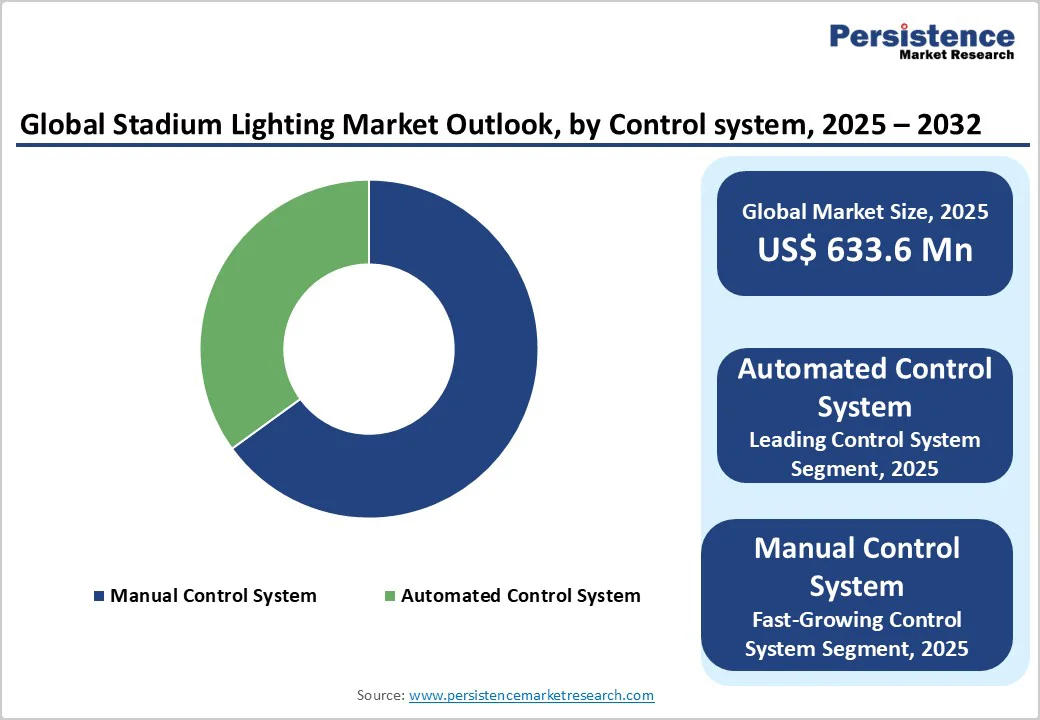
- Dominant Control System: Automated lighting control systems dominate the market with an estimated 65% share, offering superior flexibility, energy efficiency, and centralized management of complex lighting environments. The manual control segment is witnessing the fastest growth, driven by demand from smaller venues and cost-sensitive installations in developing regions.
- Application Leadership: Indoor stadium lighting leads with approximately 80% market share, driven by the need for consistent illumination quality and advanced control systems in enclosed sports arenas. The outdoor stadium segment is expected to record the highest growth rate, supported by expanding sports infrastructure, night-time event scheduling, and retrofitting of traditional floodlights with smart LED systems.
- Technology Advancement: LED technology dominates with around 60% of total installations, projected to reach 65% by 2025 due to superior energy savings, longer lifespan, and lower maintenance costs. The ongoing shift from conventional metal halide and halogen systems to intelligent LED-based lighting underscores the industry’s transition toward sustainability and performance optimization.
- Strategic Market Developments: Key industry developments between 2023 and 2025 include Acuity Brands’ acquisition of M3 Innovation to strengthen smart lighting capabilities, Musco Lighting’s purchase of Ephesus to expand its sports lighting portfolio, and Signify’s launch of advanced modular LED systems designed for professional sports venues and large-scale events.
| Key Insights | Details |
|---|---|
|
Stadium Lighting Market Size (2025E) |
US$633.6 Mn |
|
Projected Market Value (2032F) |
US$1,058.0 Mn |
|
Global Market Growth Rate (CAGR 2025 to 2032) |
7.6% |
|
Historical Market Growth Rate (CAGR 2019 to 2023) |
6.7% |
Market Factors - Growth, Barriers, and Opportunity Analysis
Growth Analysis - Transition to LED Technology and Energy Efficiency Mandates
LED lighting now accounts for approximately 60% of stadium installations globally, driven by superior energy efficiency (up to 180 lumens per watt), extended lifespans (100,000 hours), and minimal maintenance requirements. Government regulations, including the U.S. Department of Energy's requirement for 120 lumens per watt by 2028 and EU energy conservation directives, accelerate the phase-out of metal halide and high-pressure sodium systems. FIFA and UEFA mandate LED luminaires for all new Standard A and B stadiums, ensuring broadcast-quality illumination and sustainability. These regulatory frameworks have driven energy savings of 50% in retrofit projects, translating to US$27 Billion in utility bill reductions over 30 years and 70 million metric tons in carbon emission reductions.
Proliferation of Global Sports Events and Infrastructure Investments
The surge in international sporting events such as the FIFA World Cup, Olympics, IPL, and continental tournaments, fuels the demand for high-performance stadium lighting. Over 150 international tournaments in 2024 drove a 30% increase in lighting upgrades across cricket stadiums in India alone, with 25 venues adopting 5000K LED systems for enhanced visibility. China invested heavily in sports infrastructure for the 2022 Winter Olympics, with facilities such as Beijing National Stadium and Hangzhou Olympic Sports Center receiving advanced LED upgrades aligned with carbon reduction goals. North America's SoFi Stadium and Allegiant Stadium exemplify multi-billion-dollar projects incorporating programmable LED systems optimized for ultra-HD broadcasts and live events.
Smart Lighting and IoT Integration
Integration of IoT, sensors, and AI-driven automation transforms stadium lighting into dynamic, adaptive systems. Approximately 70% of North American stadiums deployed occupancy sensors and smart controls by 2025, reducing energy waste by 20% during low-attendance events. Real-time adjustments based on crowd density, weather conditions, and broadcast requirements optimize both performance and energy consumption. Lighting systems now sync with crowd noise, adjust for 8K broadcasts, and provide dramatic pre-match effects, enhancing fan engagement and operational efficiency.
Barrier Analysis - High Initial Installation and Retrofit Costs
Advanced LED systems with smart features require substantial upfront investment, ranging from US$142,460 to US$877,260 for new installations and US$95,000 to US$541,800 for retrofits. Smaller venues and budget-constrained organizations face financial barriers, particularly in emerging markets where capital availability is limited. Compatibility challenges with legacy infrastructure, structural assessments for pole reuse, and integration with existing electrical systems increase project complexity and delay adoption timelines.
Technical Complexity and Integration Challenges
Smart stadium lighting systems require seamless integration with centralized control platforms, sensors, and broadcasting equipment, leading to connectivity issues, software bugs, and synchronization failures. Outdoor stadiums face additional challenges related to heat dissipation, water resistance, and long-term durability in harsh weather conditions. Ensuring HD and 4K broadcast compatibility, managing glare control, and achieving uniform illumination across large playing surfaces demand specialized expertise and continuous innovation in materials and optical design.
Opportunity Analysis - Expansion in Asia Pacific and Emerging Markets
Asia Pacific, representing 36-39% of global installations, and offers significant expansion opportunities. China, India, and ASEAN nations are constructing world-class stadiums as part of smart city initiatives and preparations for major tournaments. India's stadium lighting market alone is projected to grow from US$37.24 Million in 2025 to US$83.60 Million by 2033 at a 9.4% CAGR. Government subsidies, urbanization, and rising sports participation create scalable opportunities for LED and smart lighting vendors.
Retrofit and Modernization of Existing Facilities
Over 60% of existing stadiums globally utilize outdated metal halide systems, presenting a substantial retrofit market. Retrofitting offers 50% energy savings, improved broadcast quality, and compliance with modern safety standards. Projects leveraging existing poles and electrical infrastructure reduce costs and minimize downtime, making retrofits attractive for budget-conscious facility operators. The retrofit segment is poised for accelerated growth as aging infrastructure reaches end-of-life and regulatory pressures intensify.
Multi-Purpose Venues and Dynamic Lighting Effects
Stadiums increasingly host concerts, esports, entertainment events, and community activities, driving demand for versatile, programmable lighting systems. Dynamic color-changing LEDs, synchronized light shows, and adaptive brightness controls enhance event experiences and create additional revenue streams. Smart lighting systems enable seamless transitions between sporting events and entertainment programming, maximizing facility utilization and return on investment.
Category-wise Analysis
Control System Insights
Automated control systems dominate the market with a 65% share in 2025, driven by superior energy efficiency, remote operation capabilities, and integration with IoT platforms. These systems enable real-time brightness adjustments, sensor-based dimming, and predictive maintenance, reducing operational costs by 20-30%. AI-driven automation allows lighting to adapt dynamically to event requirements, weather conditions, and broadcasting standards, enhancing both performance and sustainability.
Manual control systems represent the fastest-growing segment, appealing to budget-sensitive operators and smaller venues prioritizing simplicity and lower upfront costs. While offering less automation, manual systems provide reliable performance for community stadiums, training facilities, and regional sports complexes. Growth is fueled by cost-effectiveness, ease of installation, and minimal technical complexity, particularly in emerging markets transitioning from legacy systems.
Application Insights
Indoor stadium lighting accounts for 80% of the market share in 2025, reflecting the prevalence of enclosed arenas for basketball, volleyball, ice hockey, and indoor soccer. Indoor environments enable precise light control, uniform distribution, and reduced glare, critical for player visibility and spectator comfort. The segment benefits from hosting multi-use events, including concerts and conventions, requiring flexible, high-quality lighting solutions. Indoor facilities-controlled environments facilitate advanced smart lighting integration and energy management systems.
Outdoor stadium lighting is the fastest-growing application segment, driven by the expansion of football, cricket, baseball, and athletics facilities globally. Outdoor venues require robust, weather-resistant systems with high lumen output, precise beam control, and minimal light pollution. FIFA and UEFA standards mandate specific horizontal and vertical illuminance levels (1,500-2,500 lux) for broadcast-quality coverage, pushing the evolution of outdoor lighting technology. Growth is fueled by new stadium construction, international tournament preparations, and retrofit projects upgrading aging infrastructure.
Regional Insights
North America Stadium Lighting Market Trends
North America dominates the market, holding 28-29% market share in 2025, with the U.S. representing approximately 75-78% of regional revenue. Market leadership is attributed to advanced sports infrastructure, high broadcast standards, and substantial investment in facility modernization.
Major leagues (NFL, NBA, MLB, MLS) drive continuous lighting upgrades, with venues such as SoFi Stadium and Allegiant Stadium showcasing cutting-edge LED and IoT systems. Government incentives promoting energy efficiency and sustainability further accelerate LED adoption. The region's innovation ecosystem supports R&D in smart lighting, wireless controls, and AR-enhanced fan engagement. Regulatory frameworks (OSHA, ANSI Z21) ensure stringent safety and performance standards, while multi-purpose stadium trends sustain demand for versatile lighting solutions.
Europe Stadium Lighting Market Trends
Europe commands 23-25% of the global market share, led by Germany, the U.K., France, and Spain. The region emphasizes sustainability, energy conservation, and regulatory harmonization through EU directives (REACH, Energy Performance of Buildings Directive). Germany's strong sporting culture and Industry 4.0 leadership drive adoption of smart, connected lighting systems.
Premier League stadiums in the U.K. and La Liga venues in Spain undergo LED retrofits to meet HD and 4K broadcast requirements. UEFA guidelines mandate broadcast-quality lighting for European club competitions, accelerating technology upgrades. Investment in renewable energy integration and smart grid connectivity positions Europe as a leader in sustainable stadium infrastructure.
Asia Pacific Stadium Lighting Market Trends
Asia Pacific is the fastest-growing region through 2033. China leads regional dominance with 42% of APAC revenue, driven by government-sponsored smart city programs, urbanization, and preparations for international events. Major projects include Hangzhou Olympic Sports Center and Beijing National Stadium LED upgrades.
India's cricket infrastructure expansion, 25 venues upgraded in 2024, and PLI schemes for manufacturing bolster growth. ASEAN nations invest in multi-sport facilities to host regional tournaments. Cost-competitive manufacturing, government incentives, and rising disposable incomes create favorable conditions for LED and smart lighting adoption.
Competitive Landscape
The global stadium lighting market is moderately fragmented, with top players Signify Holding, Musco Lighting, Acuity Brands, Eaton/Ephesus Lighting, and GE Current collectively holding 52-60% of the global market share. Market concentration is moderate, with established vendors competing on technology innovation, international distribution, and comprehensive service offerings. Regional specialists and new entrants contribute to fragmentation, particularly in Asia Pacific and Latin America, where price competition and local partnerships prevail.
Key Industry Developments
- In February 2024, Romanso launched an LED stadium light series for outdoor applications, designed with a remote power system that simplifies the driver maintenance operation and eliminates extra cost.
- In June 2023, authorities installed LED floodlights at Wankhede Stadium, located in Mumbai, India. The upgrade will include refurbished hospitality boxes for the 2023 ODI cricket World Cup.
Companies Covered in Stadium Lighting Market
- Signify Holding (Philips)
- Douglas Lighting Controls (Panasonic)
- Cooper Lighting Solutions (Eaton Corporation)
- Cree Inc.
- Hubbell
- LG Electronics
- Bajaj Electricals Ltd.
- Zumtobel Group
- General Electric
- Acuity Brands, Inc.
Frequently Asked Questions
The stadium lighting market is estimated to be valued at US$633.6 Million in 2025.
The key demand driver for the stadium lighting market is the rising global investments in modern sports infrastructure and the widespread transition toward energy-efficient LED lighting systems.
In 2025, the North America region will dominate the market with an exceeding 30% revenue share in the stadium lighting market.
Automated control systems hold the highest preference, capturing beyond 65.2% of the market revenue share in 2025, surpassing other control systems.
The key players in the stadium lighting market are Signify Holding (Philips), Douglas Lighting Controls, Cooper Lighting Solutions, Cree Inc., and Hubbell.


