


- Hardware & Software IT Services
- Smart Home Cloud Platform Market
Smart Home Cloud Platform Market Size, Share, and Growth Forecast 2026 – 2033
Smart Home Cloud Platform Market Solution (Smart Home Cloud Platforms, Services), Application (Security & Access Control, Lighting Control, HVAC Control, Entertainment Control & Other Controls, Smart Speakers, Home Appliances, Home Healthcare, Smart Kitchens, Others), and Region Analysis 2026 to 2033
Smart Home Cloud Platform Market Size and Trend Analysis
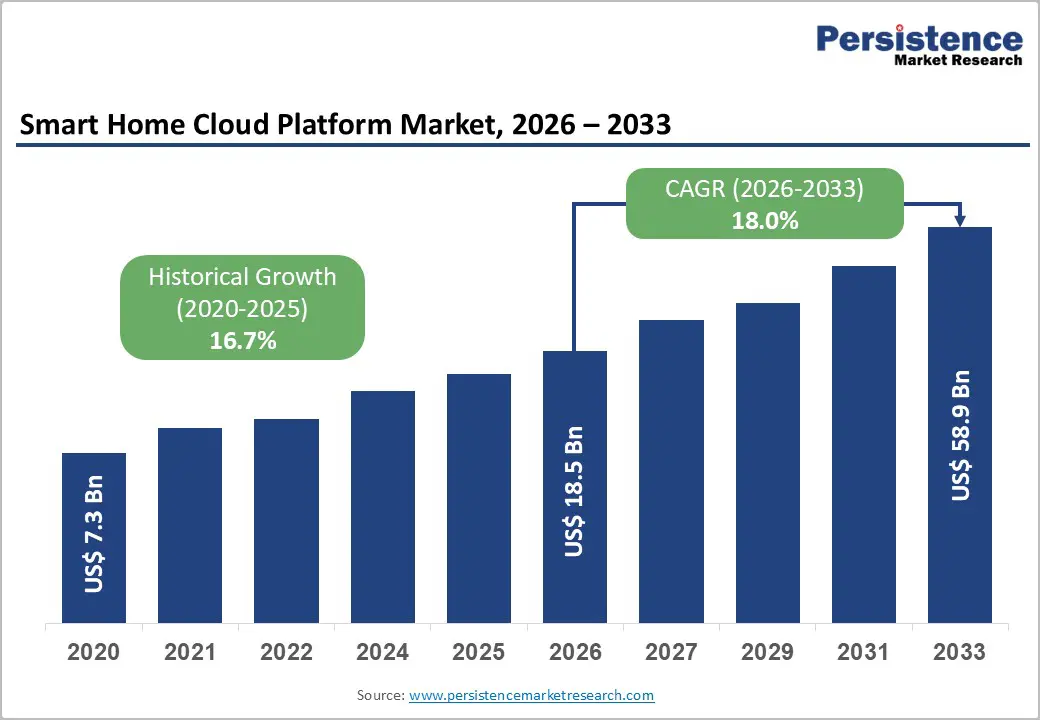
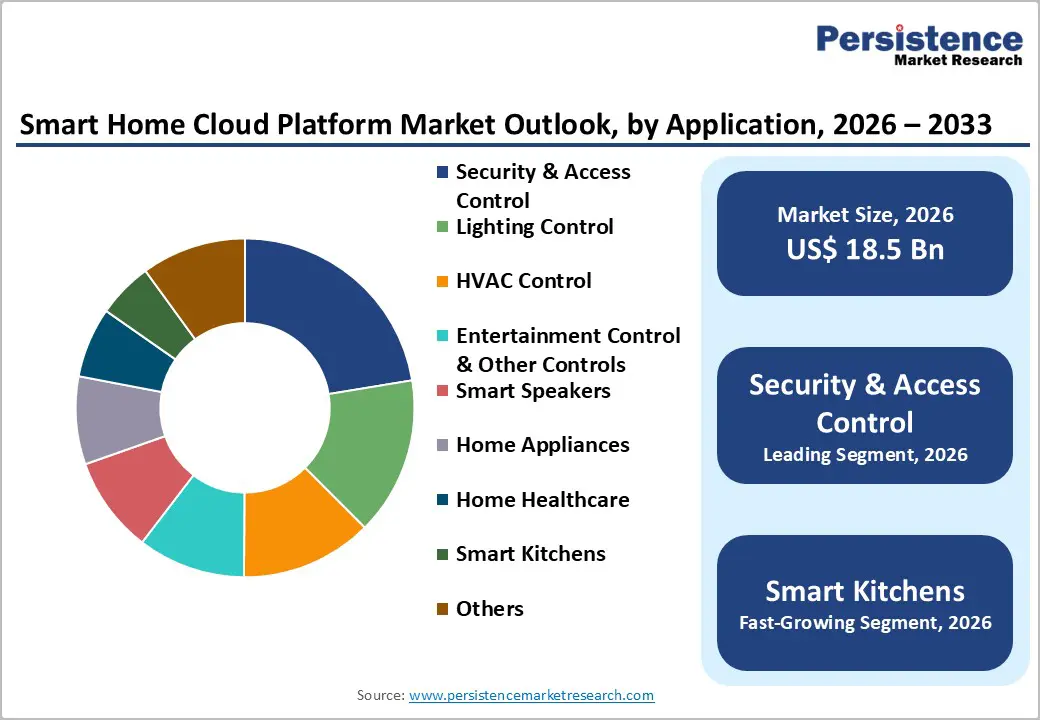
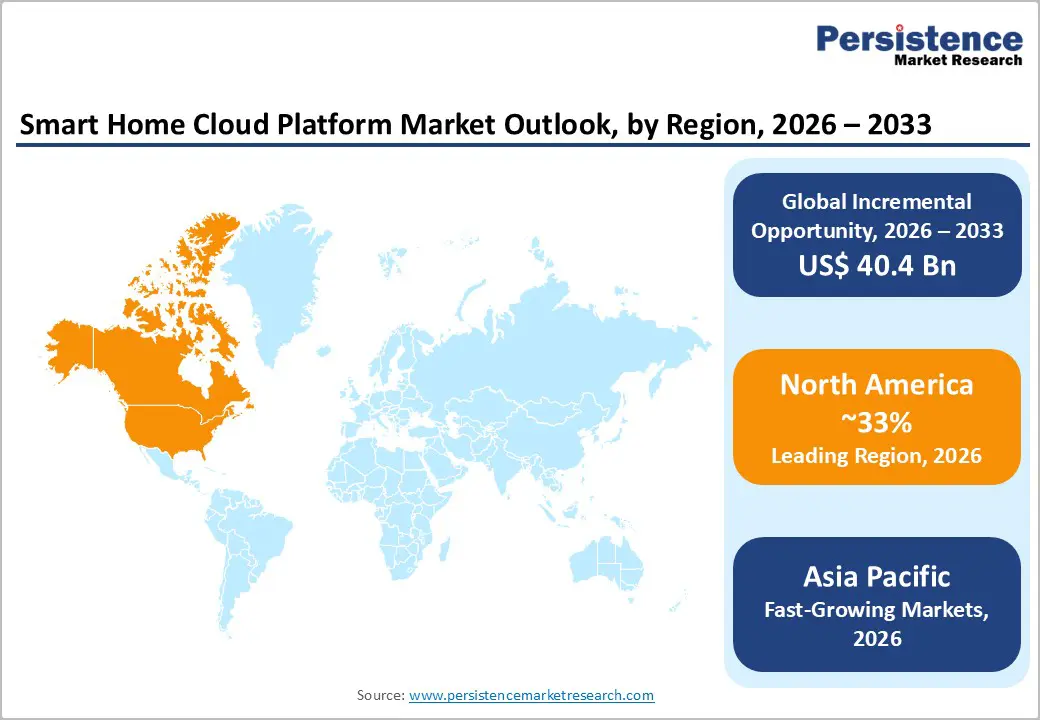
The global Smart Home Cloud Platform Market size is projected to be valued at US$18.5 Billion in 2026 and is anticipated to reach US$58.9 Billion by 2033, growing at a CAGR of 18.0% between 2026 and 2033.
This robust expansion is driven by accelerating IoT device adoption surpassing 15.9 billion connected home devices globally, increasing consumer demand for integrated home automation systems, and advancing cloud infrastructure capabilities enabling seamless device interoperability. Government energy efficiency initiatives and declining smart device costs further catalyze residential technology adoption across developed and emerging markets.
Key Highlights Summary
- Solution/Software dominates at 72% market share, while Services segment accelerates at 15.6% CAGR, reflecting growing organizational preference for vendor-managed operational support.
- Healthcare vertical emerging as fastest-growing segment at 15.1% CAGR, driven by telemedicine, EHR cloud migration, and HIPAA compliance mandates.
- North America maintains leadership with 33% global market share, while Asia Pacific emerges as fastest-growing region at 14.4% CAGR, driven by China, India, and ASEAN digital transformation.
- Europe holds 27% market share with steady 11.4% CAGR growth, reinforced by GDPR compliance requirements and data sovereignty mandates.
- BYOD adoption reaching 80% of organizations globally, with 55% productivity gains driving SME and mid-market adoption acceleration.
- 5G infrastructure expansion and IoT device proliferation enabling real-time MDM capabilities supporting field-intensive industries and distributed operations.
| Key Insights | Details |
|---|---|
| Smart Home Cloud Platform Market Size (2026E) | US$ 18.5 billion |
| Market Value Forecast (2033F) | US$ 58.9 billion |
| Projected Growth CAGR (2026-2033) | 18.0% |
| Historical Market Growth (2020-2025) | 16.7% |

Market Dynamics Analysis
Market Growth Drivers
Rapid Proliferation of IoT-Enabled Smart Home Devices
The global installed base of smart home devices has expanded exponentially, with the International Telecommunication Union reporting over 15.9 billion connected IoT devices worldwide as of 2024, with residential deployments accounting for 38% of total installations. The U.S. Department of Energy indicates smart thermostat adoption reached 47 million households in North America, representing around 32-36% penetration in eligible homes. Consumer technology spending on smart home products exceeded US$174 billion in 2024, growing 23% annually according to the Consumer Technology Association. This device proliferation necessitates centralized cloud platforms for unified management, automation orchestration, and cross-device communication. Smart speaker adoption alone surpassed 320 million units globally, creating ecosystem anchor points driving broader platform adoption across lighting, security, and appliance categories.
Advancing Artificial Intelligence and Machine Learning Integration
Cloud platforms increasingly incorporate AI and ML capabilities enabling predictive automation, behavioral learning, and intelligent energy optimization. The National Institute of Standards and Technology reports AI-powered smart home systems achieve 67% improvement in energy efficiency compared to rule-based automation. Machine learning algorithms analyze occupancy patterns, weather forecasts, and user preferences to autonomously optimize heating, cooling, and lighting systems. Voice assistant technologies powered by natural language processing reached 94% accuracy rates, with 58% of smart home users relying on voice control according to the Federal Communications Commission consumer surveys. AI-driven security systems demonstrate 83% reduction in false alarm rates while improving threat detection capabilities. These technological advancements enhance user experience, operational efficiency, and platform value propositions driving accelerated adoption across demographic segments.
Market Restraints
Data Privacy Concerns and Cybersecurity Vulnerabilities
Smart home platforms face significant consumer resistance due to data privacy apprehensions and documented security breaches. The Federal Trade Commission reports 47% of consumers express concerns about personal data collection by smart home devices, with 34% delaying purchases due to privacy issues. Cybersecurity incidents targeting connected home systems increased 58% in 2024, with average breach remediation costs reaching US$287,000 per incident. Regulatory compliance requirements including GDPR, CCPA, and emerging IoT security standards impose substantial compliance costs averaging US$3.2 million annually for platform providers. Consumer trust deficits, amplified by high-profile data breaches and unauthorized surveillance incidents, create adoption barriers particularly among privacy-conscious demographics and limit market penetration rates.
High Initial Investment Costs and Interoperability Challenges
Comprehensive smart home implementations require substantial upfront investments averaging US$8,500 to US$15,000 for whole-home automation systems, creating accessibility barriers for middle-income households. Device compatibility issues persist despite standardization efforts, with fragmented ecosystems requiring multiple platforms and proprietary protocols. The lack of universal interoperability standards results in consumer confusion, with 42% of potential buyers citing compatibility concerns as primary purchase barriers. Integration complexities increase installation costs by 35-50% when incorporating legacy systems, while platform switching costs averaging US$2,400 create vendor lock-in concerns. These financial and technical barriers particularly impact market penetration in price-sensitive segments and emerging economies.
Market Opportunities
Expanding Adoption in Emerging Markets with Rising Urbanization
Emerging economies present substantial growth opportunities as urbanization accelerates and middle-class populations expand. The United Nations projects urban populations in developing nations will increase by 2.5 billion people by 2050, with 68% residing in urban areas. Smart city initiatives across India, Southeast Asia, and Latin America incorporate residential automation infrastructure, with government investments exceeding US$124 billion through 2030. Rising disposable incomes in these regions, growing 6.8% annually, enable technology adoption previously limited to developed markets. The smart home market in Asia Pacific emerging economies is projected to reach US$28.4 billion by 2030, driven by affordable device availability, improving internet connectivity reaching 78% penetration, and localized platform solutions addressing regional preferences and requirements.
Integration with Renewable Energy Systems and Grid Management
The convergence of smart home platforms with residential solar installations, battery storage systems, and utility demand response programs creates significant value-addition opportunities. Global residential solar capacity reached 142 GW in 2024, with 67% of installations incorporating smart energy management capabilities. Vehicle-to-grid technologies enable electric vehicle integration with home energy systems, with the International Renewable Energy Agency projecting 245 million EVs globally by 2030. Cloud platforms facilitating energy arbitrage, peak demand management, and renewable energy optimization represent around US$16.8 billion opportunity. Utility partnerships enabling virtual power plant participation and grid stabilization services generate recurring revenue streams while supporting sustainability objectives and energy independence goals.
Segmentation Analysis
Solution Analysis
Smart Home Cloud Platforms dominate the market with a commanding 54% share, serving as the foundational infrastructure enabling device connectivity, data processing, automation orchestration, and user interface delivery. These platforms provide essential capabilities including device provisioning, secure communication protocols, real-time data analytics, and third-party integration frameworks. Major technology providers invest heavily in platform development, with enterprise-grade infrastructure supporting millions of concurrent device connections. Cloud platforms enable remote access, cross-device automation scenarios, and firmware update distribution while offering scalability accommodating household device growth. The segment's dominance reflects the critical role platforms play in delivering seamless smart home experiences across diverse device ecosystems.
Services including API Integration, Remote Firmware Upgradation, Diagnostic Services, and Risk Assessment represent the fastest-growing segment at 19.5% CAGR through 2033. This acceleration reflects increasing implementation complexity requiring specialized expertise, ongoing maintenance necessitating professional support, and cybersecurity concerns demanding continuous monitoring and updates.
Application Analysis
Security & Access Control maintains application leadership with 22% market share, driven by fundamental consumer priorities for safety, property protection, and family security. This segment encompasses smart locks, video doorbells, security cameras, motion sensors, and integrated alarm systems managed through cloud platforms. Rising crime rates in urban areas, insurance premium discounts averaging 15% for monitored security systems, and declining equipment costs drive widespread adoption. Cloud connectivity enables real-time alerts, remote monitoring, and emergency response integration, with 64% of homeowners identifying security as primary smart home purchase motivation. The segment benefits from recurring monitoring service revenue, professional installation requirements, and regulatory mandates in commercial residential properties.
Smart Kitchens emerge as the fastest-growing application segment at 19.8% CAGR, propelled by connected appliance innovation, cooking automation technologies, and inventory management integration. Growth drivers include smart refrigerators with internal cameras and expiration tracking, connected ovens enabling remote preheating and recipe guidance, and automated meal planning systems. This segment benefits from appliance replacement cycles and premium product positioning.
Regional Market Insights
North America
North America commands a significant 33% share of the global Smart Home Cloud Platform Market, valued at approximately US$6.12 Billion in 2026, maintaining regional leadership through advanced technology adoption and mature consumer markets. The United States drives this dominance with 72% of households owning at least one smart home device and average household smart technology spending reaching US$1,340 annually. The region benefits from robust broadband infrastructure with 94% coverage, high disposable incomes supporting premium product adoption, and concentrated presence of leading platform providers including Amazon, Google, and Apple. Favorable regulatory frameworks, utility incentive programs offering cumulative rebates exceeding US$4.2 billion annually, and strong retail distribution networks support sustained market expansion.
Innovation ecosystems centered in Silicon Valley and technology hubs across major metropolitan areas drive continuous platform advancement and new application development. The region's early adopter culture, with 41% of consumers categorized as technology enthusiasts, accelerates market maturity and establishes consumer behavior patterns influencing global markets.
Europe
Europe holds approximately 26% of the global market share, demonstrating steady growth at 16.5% CAGR, driven by stringent energy efficiency regulations and sustainability commitments under the European Green Deal. Germany leads regional adoption through strong smart home penetration in new construction projects, with 58% of newly built residences incorporating automated systems. The United Kingdom maintains significant market presence through retrofitting initiatives in existing housing stock, while France and Spain demonstrate accelerating adoption in urban centers. The EU Energy Performance of Buildings Directive mandates smart readiness indicators for buildings, compelling developers to integrate cloud-enabled automation systems. Regional investments in 5G infrastructure exceeding US$78 billion enhance platform capabilities and support advanced applications.
Europe's emphasis on data privacy under GDPR creates unique market dynamics, with consumers preferring locally hosted solutions and platforms demonstrating transparent data governance. The region's focus on interoperability standards through the Connectivity Standards Alliance shapes product development and competitive
Asia Pacific
Asia Pacific demonstrates the most dynamic growth trajectory at 19.9% CAGR, driven by rapid urbanization, expanding middle-class populations, and aggressive smart city deployment across major metropolitan areas. China leads regional market development with government-supported smart home initiatives, e-commerce platform integration enabling widespread device accessibility, and local manufacturing capabilities delivering cost-competitive products. Japan contributes through advanced technology adoption in aging population support systems and energy-efficient residential solutions, while India represents the fastest-growing market with 76% year-over-year increase in smart home product sales. ASEAN nations including Singapore, Thailand, and Malaysia experience accelerating adoption as infrastructure development and rising incomes enable technology accessibility. The region's mobile-first consumer behavior, with 89% of smart home control via smartphone applications, shapes platform design and feature prioritization.
Government smart city programs across 1,000+ cities allocate ~US$312 billion toward urban infrastructure modernization including residential automation integration. The region's manufacturing dominance enables rapid innovation cycles and aggressive pricing strategies, with average smart device costs 40% lower than Western markets.
Competitive Landscape
Strategic Developments
- In May 2024, Google LLC launched Google Home Developer Program enhancements incorporating generative AI capabilities for natural language automation creation and predictive behavior learning, enabling users to configure complex automation scenarios through conversational interfaces, significantly reducing setup complexity and expanding addressable market to non-technical users.
- In May 2025, Xiaomi Corporation announced expansion of Mi Home cloud platform into Latin American markets with localized voice assistant supporting Spanish and Portuguese languages, establishing regional cloud infrastructure in Brazil and Mexico with partnerships across 450 retail locations enabling market penetration.
Business Strategies
Market leaders pursue ecosystem expansion strategies, integrating proprietary devices with open platforms supporting third-party connectivity to maximize device coverage and user engagement. Innovation focus emphasizes voice assistant enhancement, AI-powered automation, and privacy-preserving architectures addressing consumer security concerns. Freemium business models offer basic cloud connectivity without subscription fees while monetizing premium features including extended video storage, advanced analytics, and professional monitoring services. Strategic partnerships with utility providers, insurance companies, and healthcare organizations create additional revenue streams and expand value propositions beyond traditional home automation applications.
Frequently Asked Questions
The Smart Home Cloud Platform Market is projected at US$18.5 Billion in 2026, expanding to US$58.9 Billion by 2033.
Rapid proliferation of connected IoT devices, stricter energy efficiency regulations, advancing AI-driven automation, and mass adoption of smart speakers are accelerating global demand for smart home cloud platforms.
The market is projected to grow at a CAGR of 18.0% between 2026 and 2033.
Expanding smart home adoption in emerging economies, deeper integration with renewable energy systems, and rising demand for cloud-enabled home healthcare solutions are unlocking strong long-term growth avenues for smart home cloud platforms.
Leading players include Amazon.com, Google LLC, Apple Inc., Samsung Electronics, Tuya Inc., Microsoft Corporation, Honeywell International, Schneider Electric, Siemens AG, ABB Ltd., LG Electronics, Xiaomi Corporation, Robert Bosch, Control4 Corporation, and Legrand SA.


