


- Executive Summary
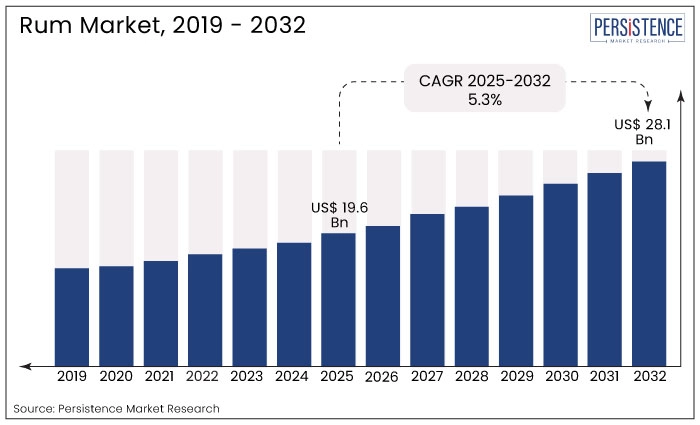
- Global Rum Market Snapshot, 2025 and 2032
- Market Opportunity Assessment, 2025 – 2032, US$ Bn
- Key Market Trends
- Future Market Projections
- Industry Developments and Key Market Events
- PMR Analysis and Recommendations
- Market Overview
- Market Scope and Definition
- Market Dynamics
- Drivers
- Restraints
- Opportunity
- Challenges
- Key Trends
- Rum Market: Value Chain
- List of key players
- List of key distributors
- Key Regulations
- Forecast Factors – Relevance and Impact
- Covid-19 Impact Assessment
- PESTLE Analysis
- Porter Five Force’s Analysis
- Trade Statistics
- Supply-Demand Overview
- Import/Export Analysis (HS code: 220840)
- List of key exporting countries
- Price Trend Analysis, 2019 – 2032
- Key Factors Impacting Prices
- Prices by Product Type
- Global Rum Market Outlook
- Key Highlights
- Market Volume (Mn Litre) Projections
- Market Size (US$ Bn) and Y-o-Y Growth
- Absolute $ Opportunity
- Market Size (US$ Bn) Analysis and Forecast
- Historical Market Size (US$ Bn) Analysis, 2019-2024
- Market Size (US$ Bn) Analysis and Forecast, 2025–2032
- Global Rum Market Outlook: Product Type
- Historical Market Size (US$ Bn) and Volume (Mn Litre) Analysis By Product Type, 2019 – 2024
- Market Size (US$ Bn) and Volume (Mn Litre) Forecast By Product Type, 2025 – 2032
- Dark and Golden
- White
- Flavored
- Spiced
- Market Attractiveness Analysis: Product Type
- Global Rum Market Outlook: Distribution Channel
- Historical Market Size (US$ Bn) and Volume (Mn Litre) Analysis By Distribution Channel, 2019 – 2024
- Market Size (US$ Bn) and Volume (Mn Litre) Forecast By Distribution Channel, 2025 – 2032
- Off-trade
- On-trade
- Market Attractiveness Analysis: Distribution Channel
- Key Highlights
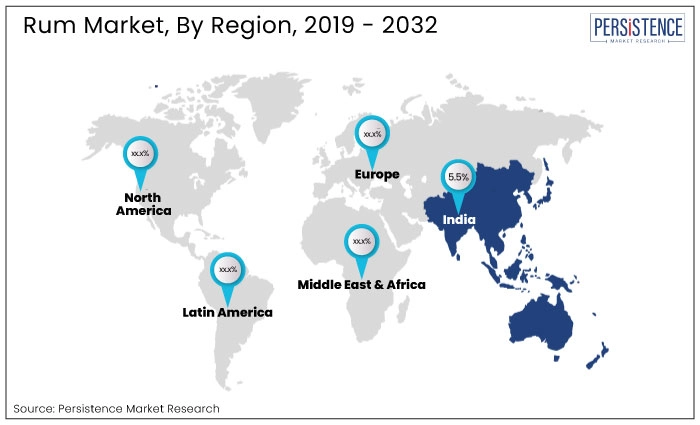
- Global Rum Market Outlook: Region
- Historical Market Size (US$ Bn) and Volume (Mn Litre) Analysis By Region, 2019 – 2024
- Market Size (US$ Bn) and Volume (Mn Litre) Forecast By Region, 2025 – 2032
- North America
- Europe
- East Asia
- South Asia and Oceania
- Latin America
- Middle East & Africa
- Market Attractiveness Analysis: Region
- North America Rum Market Outlook
- Historical Market Size (US$ Bn) and Volume (Mn Litre) Analysis By Market, 2019 – 2024
- By Country
- By Product Type
- By Distribution Channel
- Market Size (US$ Bn) and Volume (Mn Litre) Forecast By Country, 2025 – 2032
- U.S.
- Canada
- Market Size (US$ Bn) and Volume (Mn Litre) Forecast By Product Type, 2025 – 2032
- Dark and Golden
- White
- Flavored
- Spiced
- Market Size (US$ Bn) and Volume (Mn Litre) Forecast By Distribution Channel, 2025 – 2032
- Off-trade
- On-trade
- Market Attractiveness Analysis
- Historical Market Size (US$ Bn) and Volume (Mn Litre) Analysis By Market, 2019 – 2024
- Europe Rum Market Outlook
- Historical Market Size (US$ Bn) and Volume (Mn Litre) Analysis By Market, 2019 – 2024
- By Country
- By Product Type
- By Distribution Channel
- Market Size (US$ Bn) and Volume (Mn Litre) Forecast By Country, 2025 – 2032
- Germany
- France
- U.K.
- Italy
- Spain
- Russia
- Market Size (US$ Bn) and Volume (Mn Litre) Forecast By Product Type, 2025 – 2032
- Dark and Golden
- White
- Flavored
- Spiced
- Market Size (US$ Bn) and Volume (Mn Litre) Forecast By Distribution Channel, 2025 – 2032
- Off-trade
- On-trade
- Market Attractiveness Analysis
- Historical Market Size (US$ Bn) and Volume (Mn Litre) Analysis By Market, 2019 – 2024
- East Asia Rum Market Outlook
- Historical Market Size (US$ Bn) and Volume (Mn Litre) Analysis By Market, 2019 – 2024
- By Country
- By Product Type
- By Distribution Channel
- Market Size (US$ Bn) and Volume (Mn Litre) Forecast By Country, 2025 – 2032
- China
- Japan
- South Korea
- Market Size (US$ Bn) and Volume (Mn Litre) Forecast By Product Type, 2025 – 2032
- Dark and Golden
- White
- Flavored
- Spiced
- Market Size (US$ Bn) and Volume (Mn Litre) Forecast By Distribution Channel, 2025 – 2032
- Off-trade
- On-trade
- Market Attractiveness Analysis
- Historical Market Size (US$ Bn) and Volume (Mn Litre) Analysis By Market, 2019 – 2024
- South Asia & Oceania Rum Market Outlook
- Historical Market Size (US$ Bn) and Volume (Mn Litre) Analysis By Market, 2019 – 2024
- By Country
- By Product Type
- By Distribution Channel
- Market Size (US$ Bn) and Volume (Mn Litre) Forecast By Country, 2025 – 2032
- India
- Southeast Asia
- ANZ
- Rest of South Asia & Oceania
- Market Size (US$ Bn) and Volume (Mn Litre) Forecast By Product Type, 2025 – 2032
- Dark and Golden
- White
- Flavored
- Spiced
- Market Size (US$ Bn) and Volume (Mn Litre) Forecast By Distribution Channel, 2025 – 2032
- Off-trade
- On-trade
- Market Attractiveness Analysis
- Historical Market Size (US$ Bn) and Volume (Mn Litre) Analysis By Market, 2019 – 2024
- Latin America Rum Market Outlook
- Historical Market Size (US$ Bn) and Volume (Mn Litre) Analysis By Market, 2019 – 2024
- By Country
- By Product Type
- By Distribution Channel
- Market Size (US$ Bn) and Volume (Mn Litre) Forecast By Country, 2025 – 2032
- Brazil
- Mexico
- Market Size (US$ Bn) and Volume (Mn Litre) Forecast By Product Type, 2025 – 2032
- Dark and Golden
- White
- Flavored
- Spiced
- Market Size (US$ Bn) and Volume (Mn Litre) Forecast By Distribution Channel, 2025 – 2032
- Off-trade
- On-trade
- Market Attractiveness Analysis
- Historical Market Size (US$ Bn) and Volume (Mn Litre) Analysis By Market, 2019 – 2024
- Middle East & Africa Rum Market Outlook
- Historical Market Size (US$ Bn) and Volume (Mn Litre) and Volume (Mn Litre) Analysis By Market, 2019 – 2024
- By Country
- By Product Type
- By Distribution Channel
- Market Size (US$ Bn) and Volume (Mn Litre) Forecast By Country, 2025 – 2032
- GCC
- South Africa
- Northern Africa
- Market Size (US$ Bn) and Volume (Mn Litre) Forecast By Product Type, 2025 – 2032
- Dark and Golden
- White
- Flavored
- Spiced
- Market Size (US$ Bn) and Volume (Mn Litre) Forecast By Distribution Channel, 2025 – 2032
- Off-trade
- On-trade
- Market Attractiveness Analysis
- Historical Market Size (US$ Bn) and Volume (Mn Litre) and Volume (Mn Litre) Analysis By Market, 2019 – 2024
- Competition Landscape
- Market Share Analysis, 2024
- Market Structure
- Competition Intensity Mapping By Market
- Competition Dashboard
- Company Profiles (Details – Overview, Financials, Strategy, Recent Developments)
- Pernod Ricard SA
- Overview
- Segments and Product Type
- Key Financials
- Market Developments
- Market Strategy
- Bacardi Limited
- Admiral Rodney
- Diageo plc
- Tanduay Distillers, Inc.
- Appleton Estate
- Captain Morgan
- Gosling’s Rum
- Havana Club International S.A.
- Radico Khaitan
- Barceló
- Others
- Pernod Ricard SA
- Appendix
- Research Methodology
- Research Assumptions
- Acronyms and Abbreviations

Loading page data
Please wait a moment


