


- Technology
- Reinsurance Market
Reinsurance Market Size, Share and Growth Forecast, 2026-2033
Reinsurance Market by Line of Business (Life & Health, Property, Casualty, Motor, Financial Lines, Marine & Aviation), Reinsurance Type (Proportional, Non-Proportional, Alternative Risk Transfer), Risk Type (Natural Catastrophe, Man-Made, Mortality & Longevity), and Regional Analysis for 2026-2033
Reinsurance Market Share and Trends Analysis
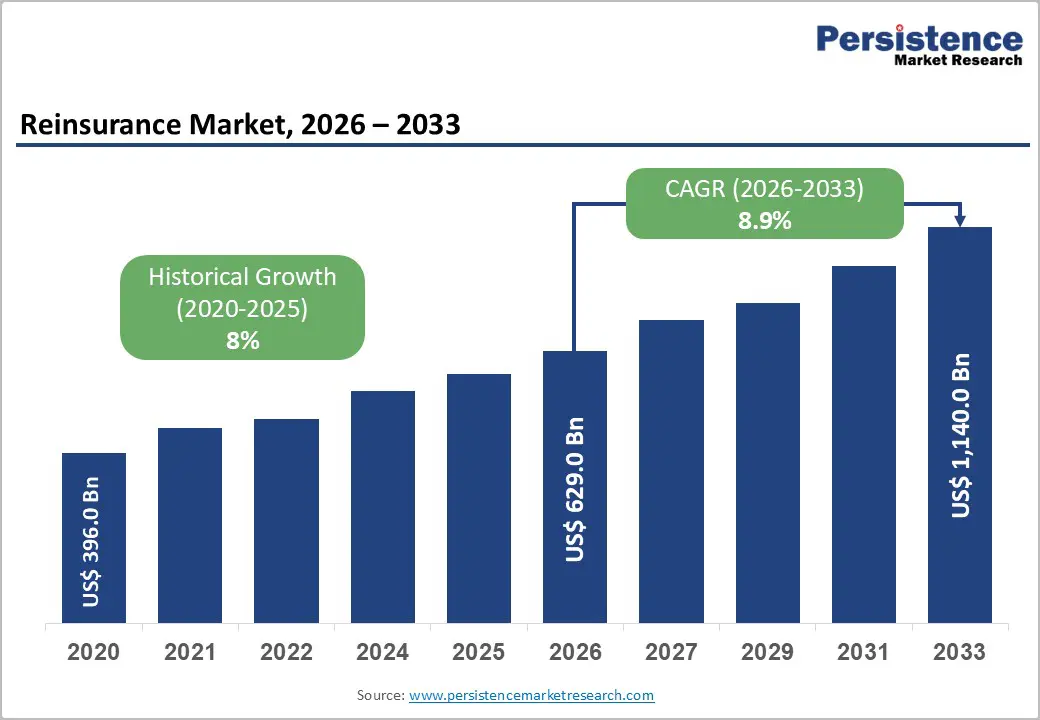
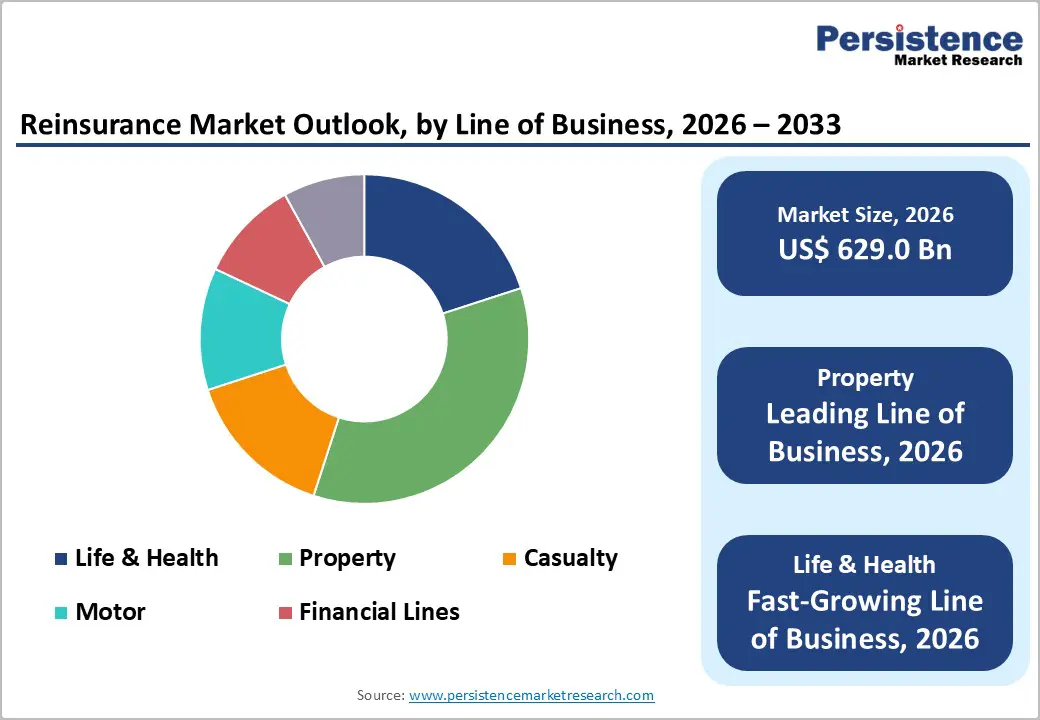
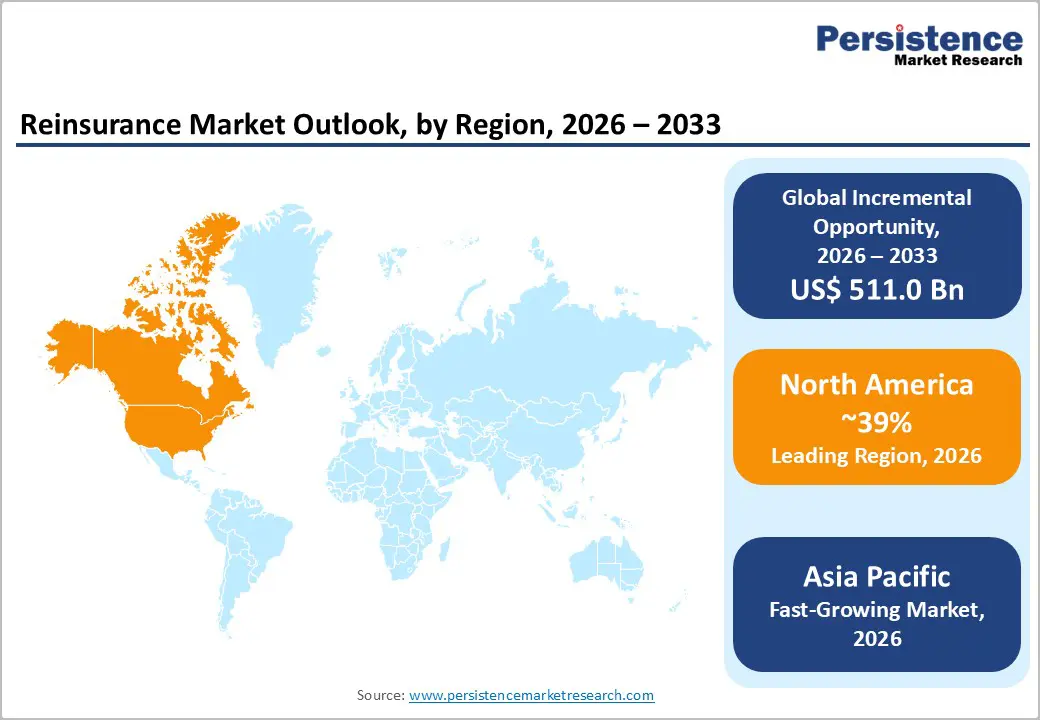
The global reinsurance market size is likely to be valued at US$ 629.0 billion in 2026, and is projected to reach US$ 1,140 billion by 2033, growing at a CAGR of 8.9% during the forecast period 2026–2033.
The market has demonstrated sustained expansion, supported by higher catastrophe frequency, urban asset concentration, and expanding insurance penetration across Asia Pacific, Latin America, and parts of Africa. Increasing exposure to secondary perils such as floods and wildfires has elevated demand for excess-of-loss protection and multi-line reinsurance structures. At the same time, regulatory capital frameworks, including risk-based solvency regimes and International Financial Reporting Standards (IFRS) 17, are reinforcing insurers’ reliance on reinsurance for balance sheet optimization. Growing longevity, cyber, and specialty risk exposures are further reshaping portfolio allocations. In response, reinsurers are reallocating capacity toward data-driven underwriting, structured solutions, and alternative capital partnerships to enhance risk-adjusted profitability and capital efficiency.
Key Industry Highlights
- Regional Leadership: North America is anticipated to account for nearly 39% market share in 2026, while Asia Pacific is poised to register the fastest growth at a 9.9% CAGR through 2033, on account of a well-functioning reinsurance industry.
- Dominant Line of Business: Property reinsurance is set to command around 35% revenue share in 2026, while life & health is likely to grow the fastest at a 9.7% CAGR through 2033, driven by longevity risk transfer and health insurance expansion.
- Leading Reinsurance Type: Non-proportional treaties are projected to hold approximately 48% share in 2026, whereas alternative risk transfer is expected to expand the fastest at a 10.8% CAGR during 2026–2033, reflecting increased catastrophe bond issuance.
- Dominant Risk: Natural catastrophe risk is expected to represent about 41% of total exposure in 2026, while mortality and longevity risk are forecast to grow the fastest at a 9.5% CAGR through 2033, driven by demographic ageing trends.
- Investment Focus: Digital underwriting and AI-enabled risk analytics are projected to contribute to operational cost reductions, while integration with capital markets through insurance-linked securities (ILS) structures is expected to support double-digit growth in alternative capital deployment.
| Key Insights | Details |
|---|---|
| Reinsurance Market Size (2026E) | US$ 629.0 Bn |
| Market Value Forecast (2033F) | US$ 1140.0 Bn |
| Projected Growth (CAGR 2026 to 2033) | 8.9% |
| Historical Market Growth (CAGR 2020 to 2025) | 7.4% |
Market Factors – Growth, Barriers, and Opportunity Analysis
Escalating Natural Catastrophe Exposure and Climate Risk Intensification
Global insured catastrophe losses continued to rise in 2025, with total economic losses reaching US$ 166 billion and insured losses around US$ 98 billion, driven by floods, wildfires, and severe storms. These figures exceeded long-term averages and underscored how non-peak perils are increasingly significant drivers of annual losses, reshaping risk transfer needs across major markets. Insurers and reinsurers face heightened exposure as climate volatility accelerates, expanding opportunities for catastrophe reinsurance coverage and pricing adjustments that reflect shifting risk profiles.
In response, the U.S. Federal Emergency Management Agency (FEMA) uses traditional reinsurance placements to manage future flood risk, transferring significant federal exposure to the private reinsurance market in 2025. This ongoing engagement with private reinsurers highlights the essential role of structured reinsurance in national risk programs and demonstrates institutional acknowledgment of amplified climate risk. Such government-linked placements strengthen demand for catastrophe treaties and support capital inflows into natural catastrophe risk pools globally.
Regulatory Capital Optimization and Emerging Market Insurance Expansion
Regulatory and capital frameworks are driving reinsurance demand in multiple jurisdictions. In India, the insurance regulator granted approval to the country’s first dedicated reinsurance company, Valueattics Reinsurance Ltd., signaling proactive steps toward expanding domestic reinsurance capacity and attracting global capital. This regulatory milestone is expected to deepen the market and create new reinsurance treaty flows, particularly for property and motor portfolios.
At the same time, innovations in insurance-linked securities are emerging as regulators expand risk diversification tools. The International Financial Services Centres Authority (IFSCA) in India announced plans to issue ILS structures via special purpose vehicles (SPVs), aimed at broadening access to catastrophe risk financing and integrating capital markets with traditional reinsurance mechanisms. This move underscores how regulatory bodies in emerging markets are supporting alternative risk transfer solutions to enhance resilience and capital efficiency.
Capital Volatility and Rising Cost of Reinsurance
Reinsurance pricing hardened significantly between 2022 and 2024 due to elevated catastrophe losses and higher interest rates. Property catastrophe reinsurance rates increased by over 20% in certain markets during recent renewal cycles, constraining capacity. Rising retrocession costs and constrained alternative capital inflows in 2023–2024 limited underwriting flexibility, particularly in short-tail property lines. Although some pricing pressures eased by late 2025, insurers reported only low single-digit rate increases across casualty and specialty segments, indicating a softer pricing environment than in prior hard markets. Renewed capital inflows have increased capacity but also created pricing competition, depressing yield. These dynamics collectively challenge reinsurers’ ability to command higher risk premiums.
Recent 2026 industry trends further underline capital volatility. Renewals in January 2026 saw double-digit price reductions in property programs as record capital availability reshaped buyer leverage, according to verified reinsurance renewal insights, leading insurers to pursue broader coverage at lower cost. At the same time, reinsurers adjusting capital allocations face widespread uncertainty in investment portfolios due to macroeconomic fluctuations and elevated interest rate volatility. Despite robust earnings in 2025, softness in core pricing trends, particularly property catastrophe reinsurance, reduces margin potential and complicates long-term underwriting strategies. This ongoing cost fluctuation directly affects reinsurers’ risk appetite and capacity deployment decisions.
Regulatory Fragmentation and Geopolitical Uncertainty
Sanctions, cross-border regulatory restrictions, and geopolitical conflicts continue to increase operational complexity for global reinsurers. In 2025, geopolitical tensions put pressure on aviation and marine risk underwriting, particularly across Europe and Asia, leading carriers to tighten treaty terms and adjust exposure. Compliance with evolving data protection, solvency, and cross-border regulatory frameworks raises administrative costs and reporting burdens, with reinsurers adapting to divergent rules across jurisdictions. Fragmented regimes often extend placement timelines and raise legal compliance costs, inhibiting efficient capital mobility for multinational risk portfolios. Political risk and trade disruptions also increase uncertainty in credit and political risk lines. These structural hurdles have tangible impacts on treaty negotiations and execution efficiency.
Recent government and industry reporting have highlighted secondary effects of macroeconomic and geopolitical instability on risk portfolios. Ongoing U.S. tariff tensions and trade disputes have exposed insurers to secondary economic risks, affecting investment returns and underwriting performance, particularly for insurers based in Europe, the Middle East, and Africa (EMEA) with global exposure. Furthermore, industry survey data show that geopolitical instability remains a top concern for aviation insurers, directly influencing reinsurance coverage terms and risk appetite. These factors limit reinsurers’ flexibility to allocate capital across borders and adjust exposures dynamically, slowing growth in transnational treaty segments and complicating global risk diversification strategies.
Expansion of Alternative Capital and Insurance-Linked Risk Transfer Solutions
The global ILS market exceeded US$ 100 billion in capital outstanding in 2024, with catastrophe bonds and sidecars diversifying funding beyond traditional reinsurance. In 2025, catastrophe bond issuance surged to US$ 25.6 billion, eclipsing the 2024 record and marking participation from 122 transactions worldwide, including first-time sponsors. Total ILS listings on the Bermuda Stock Exchange jumped over 34% year-on-year, capturing more than 93% of global issuance and reflecting strong investor demand. New cyber catastrophe bonds emerged on the BSX, expanding risk coverage into emerging peril classes such as cyber and systemic risks. These developments signal deepening capital market integration as reinsurers and cedents leverage alternative risk transfer frameworks to broaden coverage.
In India, the IFSCA has been advancing plans for SPV-based frameworks to issue catastrophe bonds and other ILS instruments, seeking government approval to enable broader investor participation in risk-sharing vehicles. This initiative could significantly deepen domestic risk transfer markets and attract private capital for disaster risk financing. The combination of institutional investor uptake and regulatory support underpins a growing pipeline of alternative capital structures. For reinsurers, these trends present scalable opportunities to innovate risk financing, manage volatility, and optimize balance sheet capital through diversified instruments beyond traditional treaty arrangements.
Longevity Risk Transfer and Digital Underwriting Transformation
Ageing populations in developed markets continue to drive demand for longevity and pension risk transfer solutions. In the U.K., the defined benefit pension de-risking market is projected to exceed £ 70 billion in 2026, with bulk annuity and longevity swap volumes rising meaningfully as trustees seek to secure long-term funding positions. This expanding risk transfer activity supports increasing reinsurance engagement across life and health portfolios as cedents hedge long-duration liabilities. Growing pension risk transfer activity extends beyond traditional markets, encouraging reinsurers to build capabilities in mortality and longevity instruments tailored for institutional clients.
Leading global reinsurers are further accelerating digital transformation to strengthen underwriting precision and operational productivity. Major players are publicly setting profit goals for 2026 underpinned by AI integration across underwriting, claims, and data analytics functions. These initiatives support more resilient earnings and faster risk assessments, enabling reinsurers to compete more effectively in complex lines such as casualty and specialty segments. Technology-enabled automation also improves portfolio insights, reduces cycle times, and enhances pricing accuracy. These demographic shifts and technological advancements are reshaping long-term value creation for reinsurers, creating differentiated growth paths in a competitive market environment.
Category-wise Analysis
Line of Business Insights
Property reinsurance is likely to maintain the largest premium share, supported by sustained catastrophe risk demand and expanding alternative capital participation. Despite pricing moderation at the January 2026 renewals, record catastrophe bond issuance of over US$ 16.8 billion in H1 2025 strengthened global risk capacity and reinforced property treaty volumes. In July 2025, Allianz entered a 50:50 reinsurance joint venture with Jio Financial Services in India, expanding general and life reinsurance penetration in a high-growth market. Such strategic alliances enhance underwriting depth while broadening regional catastrophe coverage. Elevated attachment points and disciplined underwriting continue protecting reinsurer balance sheets amid evolving climate exposures.
Life & health reinsurance is projected to expand rapidly due to ageing demographics, rising medical inflation, and increasing protection gaps in emerging markets. In March 2025, Prudential Financial completed a multi-billion-dollar longevity risk transfer transaction covering U.K. pension liabilities, highlighting sustained pension de-risking momentum. Asian insurers also strengthened health-focused offerings in 2025, increasing proportional reinsurance arrangements for morbidity and mortality risk management. Governments in developed economies continue to promote pension stability frameworks, indirectly supporting longevity reinsurance demand. Growing awareness of retirement funding gaps further accelerates structured risk transfer solutions. This positions Life & Health as the fastest growing line through 2033.
Reinsurance Type Insights
The non-proportional segment is expected to dominate with 58% of the reinsurance market revenue share in 2026 due to its effectiveness in covering high-severity, low-frequency catastrophe events. In April 2025, the Florida Office of Insurance Regulation approved expanded catastrophe reinsurance programs to stabilize insurer capacity ahead of hurricane season, reinforcing demand for excess-of-loss treaties. Reinsurers maintained disciplined underwriting standards through 2025 renewal cycles, preserving margin stability. Elevated climate volatility continues to push cedents toward structured excess layers for capital protection. Regulatory oversight in key markets further strengthens solvency requirements, sustaining treaty demand. As a result, non-proportional structures remain central to catastrophe risk management globally.
Alternative risk transfer (ART) is likely to witness accelerated growth as insurers and sovereigns diversify beyond traditional reinsurance capacity. In May 2025, the World Bank issued a new catastrophe bond supporting earthquake risk coverage in Latin America, expanding sovereign access to capital market risk transfer. Governments increasingly collaborate with capital markets to manage fiscal exposure to natural disasters. Investor appetite for uncorrelated yield assets continues to strengthen catastrophe bond pipelines into 2026. ART structures also extend into cyber and parametric risk frameworks, broadening application scope. This momentum positions ART as the fastest expanding reinsurance type through the forecast period.
Regional Insights
North America Reinsurance Market Trends
North America is anticipated hold approximately 41.8% of the reinsurance market share in 2026, driven by the scale of the U.S. insurance industry and broad treaty demand. In Q4 2025, Fairfax Financial reported modest low single-digit pricing increases in casualty lines amid softening market conditions, reflecting resilient underwriting discipline and diversified risk appetite across regions. This trend illustrates how North American reinsurers balance competition with profitability despite pricing pressures. Catastrophe exposures, particularly thunderstorms, wildfires, and hurricane risks, continue to underpin structured excess-of-loss protection demand. Insurers are also exploring facultative layers to manage specialized risks such as cyber and environmental liability, indicating evolving coverage needs. These dynamics reinforce sustained treaty activity across key segments.
Reinsurance capital remains deep at the start of 2026, with dedicated global capital expected to remain robust, enabling broad underwriting capacity across property, casualty, and specialty lines. Softening pricing has created buyer leverage at 1 January 2026 renewals, widening optionality for cedents and allowing insurers to redistribute capital toward earnings protection and growth. This capital abundance supported broader treaty coverage even amid volatility concerns. Advanced regulatory oversight under NAIC RBC frameworks and continued innovation in catastrophe analytics further strengthen the region’s resilience. These factors secure North America’s leadership role in global risk transfer and market stability.
Europe Reinsurance Market Trends
Europe is likely to account for a market share of nearly 31% in 2026, underpinned by mature markets such as Germany, the U.K., France, and Spain, and harmonized solvency frameworks. The region’s regulatory consistency under Solvency II continues to support cross-border treaty placements and capital efficiency, even as global property rates softened through early 2026. Despite competitive pricing pressure, this stability encourages long-term engagements and diversified treaty structures among European cedents. Climate exposures such as increasing hailstorm activity and drought-induced wildfires sustained property risk transfer demand during 2025. Insurers are also broadening life and specialty reinsurance portfolios in response to demographic shifts across major markets. These developments help maintain steady regional engagement in global reinsurance flows.
Financial resilience remains a core strength for European reinsurers heading into 2026 renewals. Enhanced combined ratios and diversified underwriting books enabled market participants to sustain capacity across lines despite moderating global rates. Risk-adjusted earnings prospects remain stable, supported by disciplined underwriting and capital buffers. This robust performance backdrop encourages reinvestment into strategic products and long-term risk transfer instruments. Combined with a deep asset base and evolving environmental, social, & governance (ESG) risk frameworks, Europe remains a stable and technically advanced region within the global reinsurance ecosystem.
Asia Pacific Reinsurance Market Trends
Asia Pacific represents the fastest-growing regional market for reinsurance with a projected 7.4% CAGR through 2033. Expansion continues to be driven by rising insurance adoption, infrastructure development, and regulatory reforms across China, Japan, India, and ASEAN markets. In 2025, regional insurers confronted interconnected pressures from geopolitics, natural catastrophes, and digital transformation, prompting reinsurers to broaden service offerings and risk analytics capabilities. This evolution reflects a maturing risk transfer landscape and growing sophistication in underwriting practices. Soft pricing conditions in 2025 also created opportunities for cedents to secure capacity at competitive terms while reinsurers diversified into region-specific risks.
Domestic treaty demand is strong, supported by government-backed disaster schemes and steady life and health insurance penetration. Market participants are increasingly addressing regulatory and catastrophe risk challenges through tailored reinsurance solutions. Regional reinsurers have also been expanding overseas to balance portfolios and tap growth in mature markets, reinforcing APAC’s growing influence in global reinsurance flows. Partnerships with international reinsurers further strengthen underwriting expertise and capacity. Continued economic growth and enhanced risk management frameworks position Asia Pacific to sustain the highest growth performance into 2033
Competitive Landscape
The global reinsurance market structure is moderately consolidated, with top players such as Munich Re, Swiss Re, Hannover Re, SCOR, and Berkshire Hathaway Reinsurance Group collectively controlling over half of global premiums. These established reinsurers leverage deep underwriting expertise, diversified global portfolios, and strong capital bases to manage catastrophe, longevity, and specialty risks. They also invest heavily in AI-driven risk modeling, predictive underwriting, and digital claims analytics to maintain competitive leadership. Strategic capital allocation and alternative risk solutions such as catastrophe bonds further strengthen their market positioning.
Meanwhile, regional and niche reinsurers, including PartnerRe, RenaissanceRe, and MS&AD Insurance Group, focus on specialized lines, emerging markets, and parametric or structured solutions. Regulatory complexity, high capital requirements, and catastrophe exposure serve as barriers to entry, limiting new market participants. However, technological innovation and digital platforms are enabling smaller players and insurtech collaborators to enter the market via risk analytics, underwriting tools, and parametric products. Market consolidation is expected to progress gradually as leading global reinsurers acquire smaller regional firms to expand geographically and enhance specialty offerings, while software and analytics partnerships continue to accelerate operational efficiency and portfolio optimization.
Key Industry Developments
- In October 2025, AIG and Onex agreed to acquire specialty insurer Convex, with Onex taking a 63% stake and AIG 35%. This transaction significantly strengthens both firms’ positions in specialty and reinsurance markets, providing access to diversified underwriting portfolios and enhancing global market presence.
- In July 2025, F&G sold its life reinsurance business to launch a new insurance company backed by institutional and family office investors, led by ex-Blackstone executives. This move highlights growing private capital involvement in life reinsurance and reflects strategic repositioning toward more specialized financial services.
- In June 2025, IQUW added approximately US$1.9 billion in projected gross written premiums through two Lloyd’s reinsurance syndicates and a Bermuda platform. The expansion demonstrates the company’s organic growth strategy and reinforces its underwriting capacity across property and casualty lines.
Companies Covered in Reinsurance Market
- Munich Re
- Swiss Re
- Hannover Re
- SCOR SE
- Berkshire Hathaway Reinsurance Group
- Lloyd’s of London
- China Re
- Everest Re Group
- RenaissanceRe
- PartnerRe
- Arch Capital Group
- Korean Re
Frequently Asked Questions
The global reinsurance market is projected to reach US$ 629.0 billion in 2026.
Surging value of natural catastrophe losses, ageing populations, and regulatory capital requirements are driving market growth.
The market is poised to witness a CAGR of 8.9% from 2026 to 2033.
Expansion of alternative risk transfer and longevity risk solutions presents major growth opportunities.
Munich Re, Swiss Re, Hannover Re, SCOR, and Berkshire Hathaway Reinsurance Group are some of the leading players in the market.


