


- Executive Summary
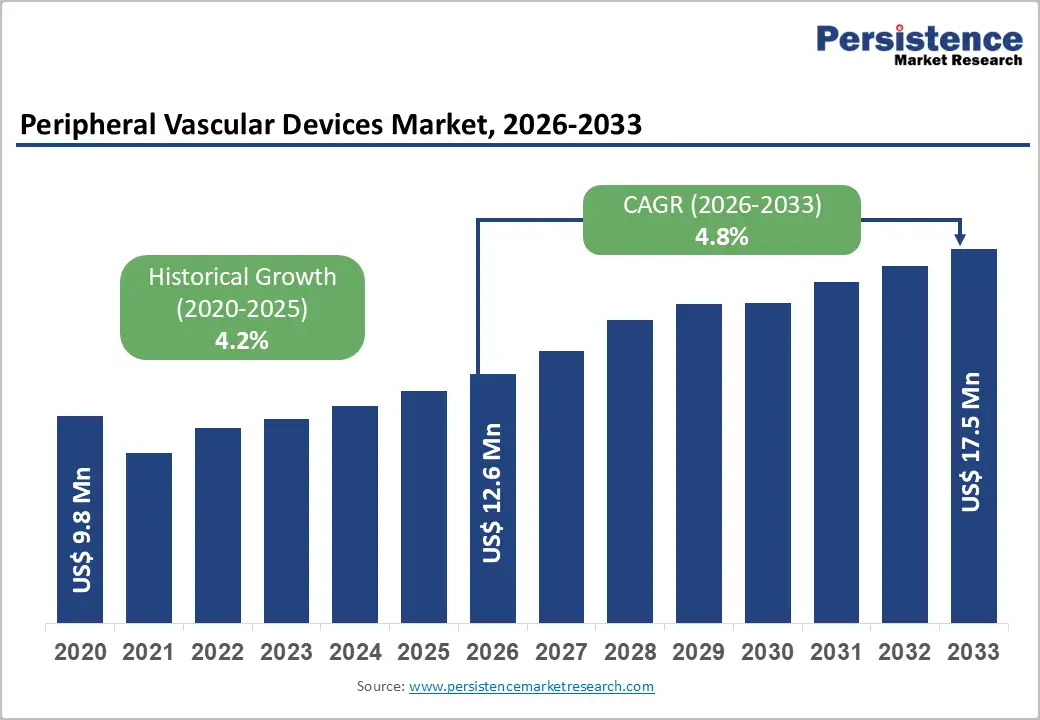
- Global Peripheral Vascular Devices Market Snapshot, 2026 and 2033
- Market Opportunity Assessment, 2026 - 2033, US$ Mn
- Key Market Trends
- Future Market Projections
- Premium Market Insights
- Industry Developments and Key Market Events
- PMR Analysis and Recommendations
- Market Overview
- Market Scope and Definition
- Market Dynamics
- Drivers
- Restraints
- Opportunity
- Challenges
- Macro-Economic Factors
- Global Medical Device Industry Outlook
- Global GDP Growth Outlook
- COVID-19 Impact Analysis
- Forecast Factors - Relevance and Impact
- Value Added Insights
- Disease Epidemiology
- Product Adoption Analysis
- Regulatory Landscape
- Reimbursement Scenario
- Value Chain Analysis
- Key Deals and Mergers
- PESTLE Analysis
- Porter’s Five Force Analysis
- Impact of AI on the Market
- Global Peripheral Vascular Devices Market Outlook:
- Key Highlights
- Market Size (US$ Mn) and Y-o-Y Growth
- Absolute $ Opportunity
- Market Size (US$ Mn) Analysis and Forecast
- Historical Market Size (US$ Mn) Analysis, 2020-2025
- Market Size (US$ Mn) Analysis and Forecast, 2026-2033
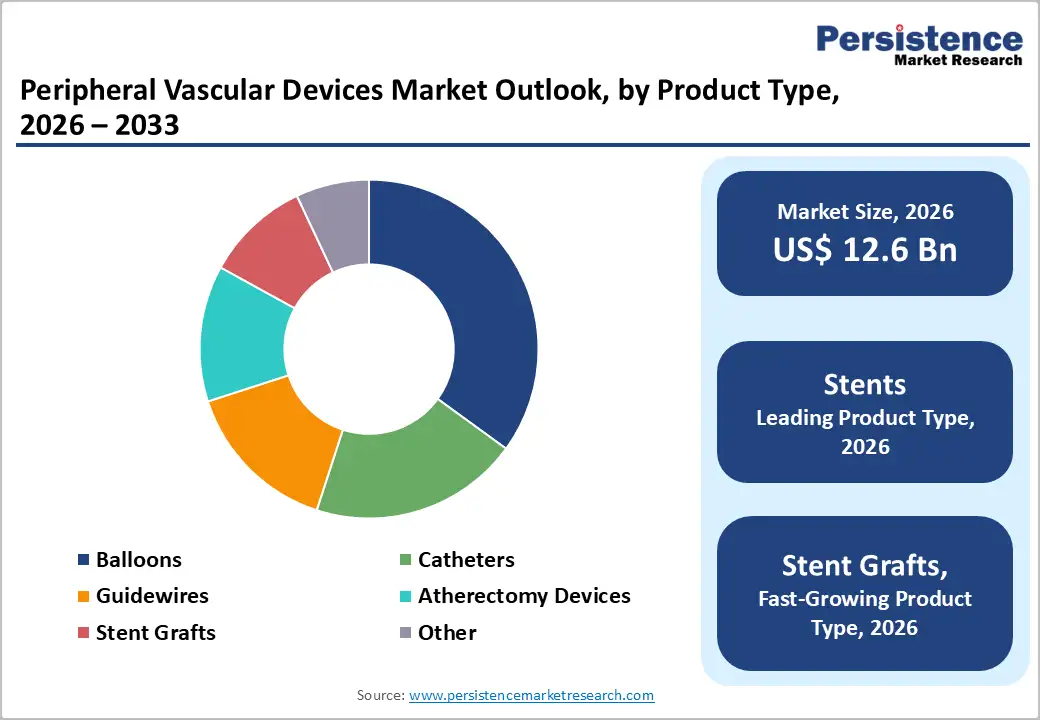
- Global Peripheral Vascular Devices Market Outlook: Product Type
- Introduction / Key Findings
- Historical Market Size (US$ Mn) and Volume (Units) Analysis, By Product Type, 2020 - 2025
- Market Size (US$ Mn) and Volume (Units) Analysis and Forecast, By Product Type, 2026 - 2033
- Stents
- Balloons
- Catheters
- Guidewires
- Atherectomy Devices
- Stent Grafts
- Other
- Market Attractiveness Analysis: Product Type
- Global Peripheral Vascular Devices Market Outlook: Disease Indication
- Introduction / Key Findings
- Historical Market Size (US$ Mn) Analysis, By Disease Indication, 2020 - 2025
- Market Size (US$ Mn) Analysis and Forecast, By Disease Indication, 2026 - 2033
- Peripheral Artery Disease
- Venous Disorders
- Aneurysm Repair
- Renal Artery Stenosis
- Others
- Market Attractiveness Analysis: Disease Indication
- Global Peripheral Vascular Devices Market Outlook: End-user
- Introduction / Key Findings
- Historical Market Size (US$ Mn) Analysis, By End user, 2020 - 2025
- Market Size (US$ Mn) Analysis and Forecast, By End user, 2026 - 2033
- Hospitals
- Ambulatory Surgical Centers
- Specialty Clinics
- Other
- Market Attractiveness Analysis: End user
- Key Highlights
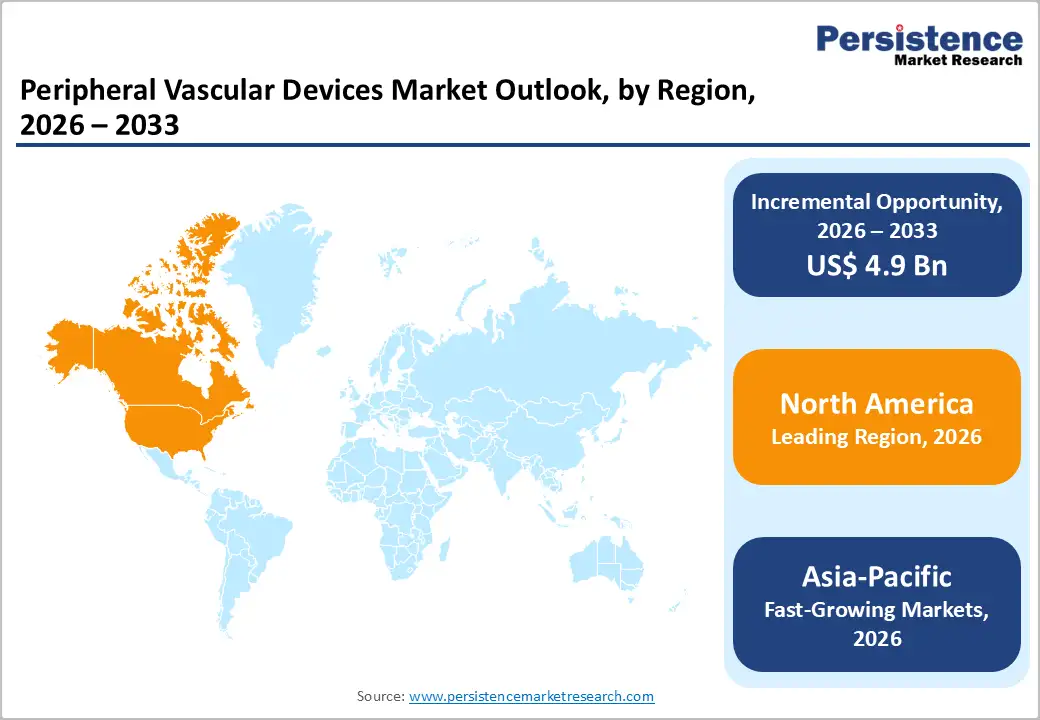
- Global Peripheral Vascular Devices Market Outlook: Region
- Key Highlights
- Historical Market Size (US$ Mn) Analysis, By Region, 2020 - 2025
- Market Size (US$ Mn) and Volume (Units) Analysis and Forecast, By Region, 2026 - 2033
- North America
- Europe
- East Asia
- South Asia and Oceania
- Latin America
- Middle East & Africa
- Market Attractiveness Analysis: Region
- North America Peripheral Vascular Devices Market Outlook:
- Key Highlights
- Historical Market Size (US$ Mn) Analysis, By Market, 2020 - 2025
- By Country
- By Product Type
- By Disease Indication
- By End user
- Market Size (US$ Mn) Analysis and Forecast, By Country, 2026 - 2033
- U.S.
- Canada
- Market Size (US$ Mn) and Volume (Units) Analysis and Forecast, By Product Type, 2026 - 2033
- Stents
- Balloons
- Catheters
- Guidewires
- Atherectomy Devices
- Stent Grafts
- Other
- Market Size (US$ Mn) Analysis and Forecast, By Disease Indication, 2026 - 2033
- Peripheral Artery Disease
- Venous Disorders
- Aneurysm Repair
- Renal Artery Stenosis
- Others
- Market Size (US$ Mn) Analysis and Forecast, By End-user, 2026 - 2033
- Hospitals
- Ambulatory Surgical Centers
- Specialty Clinics
- Other
- Market Attractiveness Analysis
- Europe Peripheral Vascular Devices Market Outlook:
- Key Highlights
- Historical Market Size (US$ Mn) Analysis, By Market, 2020 - 2025
- By Country
- By Product Type
- By Disease Indication
- By End user
- Market Size (US$ Mn) Analysis and Forecast, By Country, 2026 - 2033
- Germany
- France
- U.K.
- Italy
- Spain
- Russia
- Rest of Europe
- Market Size (US$ Mn) and Volume (Units) Analysis and Forecast, By Product Type, 2026 - 2033
- Stents
- Balloons
- Catheters
- Guidewires
- Atherectomy Devices
- Stent Grafts
- Other
- Market Size (US$ Mn) Analysis and Forecast, By Disease Indication, 2026 - 2033
- Peripheral Artery Disease
- Venous Disorders
- Aneurysm Repair
- Renal Artery Stenosis
- Others
- Market Size (US$ Mn) Analysis and Forecast, By End-user, 2026 - 2033
- Hospitals
- Ambulatory Surgical Centers
- Specialty Clinics
- Other
- Market Attractiveness Analysis
- East Asia Peripheral Vascular Devices Market Outlook:
- Key Highlights
- Historical Market Size (US$ Mn) Analysis, By Market, 2020 - 2025
- By Country
- By Product Type
- By Disease Indication
- By End user
- Market Size (US$ Mn) Analysis and Forecast, By Country, 2026 - 2033
- China
- Japan
- South Korea
- Market Size (US$ Mn) and Volume (Units) Analysis and Forecast, By Product Type, 2026 - 2033
- Stents
- Balloons
- Catheters
- Guidewires
- Atherectomy Devices
- Stent Grafts
- Other
- Market Size (US$ Mn) Analysis and Forecast, By Disease Indication, 2026 - 2033
- Peripheral Artery Disease
- Venous Disorders
- Aneurysm Repair
- Renal Artery Stenosis
- Others
- Market Size (US$ Mn) Analysis and Forecast, By End-user, 2026 - 2033
- Hospitals
- Ambulatory Surgical Centers
- Specialty Clinics
- Other
- Market Attractiveness Analysis
- South Asia & Oceania Peripheral Vascular Devices Market Outlook:
- Key Highlights
- Historical Market Size (US$ Mn) Analysis, By Market, 2020 - 2025
- By Country
- By Product Type
- By Disease Indication
- By End user
- Market Size (US$ Mn) and Volume (Units) Analysis and Forecast, By Product Type, 2026 - 2033
- Stents
- Balloons
- Catheters
- Guidewires
- Atherectomy Devices
- Stent Grafts
- Other
- Market Size (US$ Mn) Analysis and Forecast, By Disease Indication, 2026 - 2033
- Peripheral Artery Disease
- Venous Disorders
- Aneurysm Repair
- Renal Artery Stenosis
- Others
- Market Size (US$ Mn) Analysis and Forecast, By End-user, 2026 - 2033
- Hospitals
- Ambulatory Surgical Centers
- Specialty Clinics
- Other
- Market Attractiveness Analysis
- Latin America Peripheral Vascular Devices Market Outlook:
- Key Highlights
- Historical Market Size (US$ Mn) Analysis, By Market, 2020 - 2025
- By Country
- By Product Type
- By Disease Indication
- By End user
- Market Size (US$ Mn) Analysis and Forecast, By Country, 2026 - 2033
- Brazil
- Mexico
- Rest of Latin America
- Market Size (US$ Mn) and Volume (Units) Analysis and Forecast, By Product Type, 2026 - 2033
- Stents
- Balloons
- Catheters
- Guidewires
- Atherectomy Devices
- Stent Grafts
- Other
- Market Size (US$ Mn) Analysis and Forecast, By Disease Indication, 2026 - 2033
- Peripheral Artery Disease
- Venous Disorders
- Aneurysm Repair
- Renal Artery Stenosis
- Others
- Market Size (US$ Mn) Analysis and Forecast, By End-user, 2026 - 2033
- Hospitals
- Ambulatory Surgical Centers
- Specialty Clinics
- Other
- Market Attractiveness Analysis
- Middle East & Africa Peripheral Vascular Devices Market Outlook:
- Key Highlights
- Historical Market Size (US$ Mn) Analysis, By Market, 2020 - 2025
- By Country
- By Product Type
- By Disease Indication
- By End user
- Market Size (US$ Mn) Analysis and Forecast, By Country, 2026 - 2033
- GCC Countries
- Egypt
- South Africa
- Northern Africa
- Rest of Middle East & Africa
- Market Size (US$ Mn) and Volume (Units) Analysis and Forecast, By Product Type, 2026 - 2033
- Stents
- Balloons
- Catheters
- Guidewires
- Atherectomy Devices
- Stent Grafts
- Other
- Market Size (US$ Mn) Analysis and Forecast, By Disease Indication, 2026 - 2033
- Peripheral Artery Disease
- Venous Disorders
- Aneurysm Repair
- Renal Artery Stenosis
- Others
- Market Size (US$ Mn) Analysis and Forecast, By End-user, 2026 - 2033
- Hospitals
- Ambulatory Surgical Centers
- Specialty Clinics
- Other
- Market Attractiveness Analysis
- Competition Landscape
- Market Share Analysis, 2025
- Market Structure
- Competition Intensity Mapping By Market
- Competition Dashboard
- Company Profiles (Details - Overview, Financials, Strategy, Recent Developments)
- Medtronic plc
- Overview
- Segments and Types
- Key Financials
- Market Developments
- Market Strategy
- Boston Scientific Corporation
- Abbott Laboratories
- Becton, Dickinson & Company
- Terumo Corporation
- Cook Medical, Inc.
- Cardinal Health / Cordis
- AngioDynamics, Inc.
- BIOTRONIK SE & Co. KG
- Teleflex Incorporated
- OrbusNeich
- Lepu Medical
- Nipro Corporation
- Others
- Appendix
- Research Methodology
- Research Assumptions
- Acronyms and Abbreviations

Loading page data
Please wait a moment


