

- Executive Summary
- Global Ophthalmic Devices Market Snapshot, 2025 and 2032
- Market Opportunity Assessment, 2025 - 2032, US$ Bn
- Key Market Trends
- Future Market Projections
- Premium Market Insights
- Industry Developments and Key Market Events
- PMR Analysis and Recommendations
- Market Overview
- Market Scope and Definition
- Market Dynamics
- Drivers
- Restraints
- Opportunity
- Key Trends
- Macro-economic Factors
- Global Sectoral Outlook
- Global GDP Growth Outlook
- COVID-19 Impact Analysis
- Forecast Factors - Relevance and Impact
- Value Added Insights
- Tool Adoption Analysis
- Regulatory Landscape
- Value Chain Analysis
- PESTLE Analysis
- Porter’s Five Force Analysis
- Price Analysis, 2024A
- Key Highlights
- Key Factors Impacting Deployment Costs
- Pricing Analysis, By Disease Indication
- Global Ophthalmic Devices Market Outlook
- Key Highlights
- Market Volume (Units) Projections
- Market Size (US$ Bn) and Y-o-Y Growth
- Absolute $ Opportunity
- Market Size (US$ Bn) and Volume (Units) Analysis and Forecast
- Historical Market Size (US$ Bn) Analysis, 2019-2024
- Current Market Size (US$ Bn) Analysis and Forecast, 2025 - 2032
- Global Ophthalmic Devices Market Outlook: Device Type
- Introduction / Key Findings
- Historical Market Size (US$ Bn) and Volume (Units) Analysis, By Device Type, 2019 - 2024
- Current Market Size (US$ Bn) and Volume (Units) Analysis and Forecast, By Device Type, 2025 - 2032
- Surgical
- Diagnostic
- Vision Care
- Market Attractiveness Analysis: Device Type
- Global Ophthalmic Devices Market Outlook: Disease Indication
- Introduction / Key Findings
- Historical Market Size (US$ Bn) Analysis, By Disease Indication, 2019 - 2024
- Current Market Size (US$ Bn) Analysis and Forecast, By Disease Indication, 2025 - 2032
- Cataract
- Glaucoma
- Diabetic Retinopathy
- Dry Eye
- Refractive Errors
- Vitreoretinal Diseases
- Others
- Market Attractiveness Analysis: Disease Indication
- Global Ophthalmic Devices Market Outlook: End-User
- Introduction / Key Findings
- Historical Market Size (US$ Bn) Analysis, By End-User, 2019 - 2024
- Current Market Size (US$ Bn) Analysis and Forecast, By End-User, 2025 - 2032
- Hospitals
- Specialty Ophthalmic Clinics
- Ambulatory Surgery Centers
- Optical Retail Stores
- Research & Academic Institutes
- Market Attractiveness Analysis: End-User
- Key Highlights
- Global Ophthalmic Devices Market Outlook: Region
- Key Highlights
- Historical Market Size (US$ Bn) and Volume (Units) Analysis, By Region, 2019 - 2024
- Current Market Size (US$ Bn) and Volume (Units) Analysis and Forecast, By Region, 2025 - 2032
- North America
- Europe
- East Asia
- South Asia and Oceania
- Latin America
- Middle East & Africa
- Market Attractiveness Analysis: Region
- North America Ophthalmic Devices Market Outlook
- Key Highlights
- Historical Market Size (US$ Bn) Analysis, By Market, 2019 - 2024
- By Country
- By Device Type
- By Disease Indication
- By End-User
- Current Market Size (US$ Bn) Analysis and Forecast, By Country, 2025 - 2032
- U.S.
- Canada
- Current Market Size (US$ Bn) and Volume (Units) Analysis and Forecast, By Device Type, 2025 - 2032
- Surgical
- Diagnostic
- Vision Care
- Current Market Size (US$ Bn) Analysis and Forecast, By Disease Indication, 2025 - 2032
- Cataract
- Glaucoma
- Diabetic Retinopathy
- Dry Eye
- Refractive Errors
- Vitreoretinal Diseases
- Others
- Current Market Size (US$ Bn) Analysis and Forecast, By End-User, 2025-2032
- Hospitals
- Specialty Ophthalmic Clinics
- Ambulatory Surgery Centers
- Optical Retail Stores
- Research & Academic Institutes
- Market Attractiveness Analysis
- Europe Ophthalmic Devices Market Outlook
- Key Highlights
- Historical Market Size (US$ Bn) Analysis, By Market, 2019 - 2024
- By Country
- By Device Type
- By Disease Indication
- By End-User
- Current Market Size (US$ Bn) Analysis and Forecast, By Country, 2025 - 2032
- Germany
- France
- U.K.
- Italy
- Spain
- Russia
- Türkiye
- Rest of Europe
- Current Market Size (US$ Bn) and Volume (Units) Analysis and Forecast, By Device Type, 2025 - 2032
- Surgical
- Diagnostic
- Vision Care
- Current Market Size (US$ Bn) Analysis and Forecast, By Disease Indication, 2025 - 2032
- Cataract
- Glaucoma
- Diabetic Retinopathy
- Dry Eye
- Refractive Errors
- Vitreoretinal Diseases
- Others
- Current Market Size (US$ Bn) Analysis and Forecast, By End-User, 2025-2032
- Hospitals
- Specialty Ophthalmic Clinics
- Ambulatory Surgery Centers
- Optical Retail Stores
- Research & Academic Institutes
- Market Attractiveness Analysis
- East Asia Ophthalmic Devices Market Outlook
- Key Highlights
- Historical Market Size (US$ Bn) Analysis, By Market, 2019 - 2024
- By Country
- By Device Type
- By Disease Indication
- By End-User
- Current Market Size (US$ Bn) Analysis and Forecast, By Country, 2025 - 2032
- China
- Japan
- South Korea
- Current Market Size (US$ Bn) and Volume (Units) Analysis and Forecast, By Device Type, 2025 - 2032
- Surgical
- Diagnostic
- Vision Care
- Current Market Size (US$ Bn) Analysis and Forecast, By Disease Indication, 2025 - 2032
- Cataract
- Glaucoma
- Diabetic Retinopathy
- Dry Eye
- Refractive Errors
- Vitreoretinal Diseases
- Others
- Current Market Size (US$ Bn) Analysis and Forecast, By End-User, 2025-2032
- Hospitals
- Specialty Ophthalmic Clinics
- Ambulatory Surgery Centers
- Optical Retail Stores
- Research & Academic Institutes
- Market Attractiveness Analysis
- South Asia & Oceania Ophthalmic Devices Market Outlook
- Key Highlights
- Historical Market Size (US$ Bn) Analysis, By Market, 2019 - 2024
- By Country
- By Device Type
- By Disease Indication
- By End-User
- Current Market Size (US$ Bn) Analysis and Forecast, By Country, 2025 - 2032
- India
- Southeast Asia
- ANZ
- Rest of South Asia & Oceania
- Current Market Size (US$ Bn) and Volume (Units) Analysis and Forecast, By Device Type, 2025 - 2032
- Surgical
- Diagnostic
- Vision Care
- Current Market Size (US$ Bn) Analysis and Forecast, By Disease Indication, 2025 - 2032
- Cataract
- Glaucoma
- Diabetic Retinopathy
- Dry Eye
- Refractive Errors
- Vitreoretinal Diseases
- Others
- Current Market Size (US$ Bn) Analysis and Forecast, By End-User, 2025-2032
- Hospitals
- Specialty Ophthalmic Clinics
- Ambulatory Surgery Centers
- Optical Retail Stores
- Research & Academic Institutes
- Market Attractiveness Analysis
- Latin America Ophthalmic Devices Market Outlook
- Key Highlights
- Historical Market Size (US$ Bn) Analysis, By Market, 2019 - 2024
- By Country
- By Device Type
- By Disease Indication
- By End-User
- Current Market Size (US$ Bn) Analysis and Forecast, By Country, 2025 - 2032
- Brazil
- Mexico
- Rest of Latin America
- Current Market Size (US$ Bn) and Volume (Units) Analysis and Forecast, By Device Type, 2025 - 2032
- Surgical
- Diagnostic
- Vision Care
- Current Market Size (US$ Bn) Analysis and Forecast, By Disease Indication, 2025 - 2032
- Cataract
- Glaucoma
- Diabetic Retinopathy
- Dry Eye
- Refractive Errors
- Vitreoretinal Diseases
- Others
- Current Market Size (US$ Bn) Analysis and Forecast, By End-User, 2025-2032
- Hospitals
- Specialty Ophthalmic Clinics
- Ambulatory Surgery Centers
- Optical Retail Stores
- Research & Academic Institutes
- Market Attractiveness Analysis
- Middle East & Africa Ophthalmic Devices Market Outlook
- Key Highlights
- Historical Market Size (US$ Bn) Analysis, By Market, 2019 - 2024
- By Country
- By Device Type
- By Disease Indication
- By End-User
- Current Market Size (US$ Bn) Analysis and Forecast, By Country, 2025 - 2032
- GCC Countries
- Egypt
- South Africa
- Northern Africa
- Rest of Middle East & Africa
- Current Market Size (US$ Bn) and Volume (Units) Analysis and Forecast, By Device Type, 2025 - 2032
- Surgical
- Diagnostic
- Vision Care
- Current Market Size (US$ Bn) Analysis and Forecast, By Disease Indication, 2025 - 2032
- Cataract
- Glaucoma
- Diabetic Retinopathy
- Dry Eye
- Refractive Errors
- Vitreoretinal Diseases
- Others
- Current Market Size (US$ Bn) Analysis and Forecast, By End-User, 2025-2032
- Hospitals
- Specialty Ophthalmic Clinics
- Ambulatory Surgery Centers
- Optical Retail Stores
- Research & Academic Institutes
- Market Attractiveness Analysis
- Competition Landscape
- Market Share Analysis, 2024
- Market Structure
- Competition Intensity Mapping By Market
- Competition Dashboard
- Company Profiles (Details - Overview, Financials, Strategy, Recent Developments)
- Alcon Vision LLC
- Overview
- Segments and Deployments
- Key Financials
- Market Developments
- Market Strategy
- Johnson & Johnson Vision Care, Inc.
- Essilor International S.A.
- Carl Zeiss Meditec AG
- Bausch & Lomb Incorporated
- Topcon Corporation
- Nidek Co. Ltd.
- Haag-Streit AG
- Ziemer Ophthalmic Systems AG
- CooperVision, Inc.
- Alcon Vision LLC
- Appendix
- Research Methodology
- Research Assumptions
- Acronyms and Abbreviations


- Medical Devices
- Ophthalmic Devices Market
Ophthalmic Devices Market Size, Share, Trends, Growth, and Forecasts for 2025 - 2032
Ophthalmic Devices Market by Device Type (Surgical, Diagnostic, Vision Care), Disease Indication (Cataract, Glaucoma, Diabetic Retinopathy, Dry Eye, Refractive Errors, Vitreoretinal Diseases, Others), End-User (Hospitals, Specialty Ophthalmic Clinics, Ambulatory Surgery Centers, Optical Retail Stores, Research & Academic Institutes), and Regional Analysis for 2025 - 2032
Ophthalmic Devices Market Share and Trends Analysis
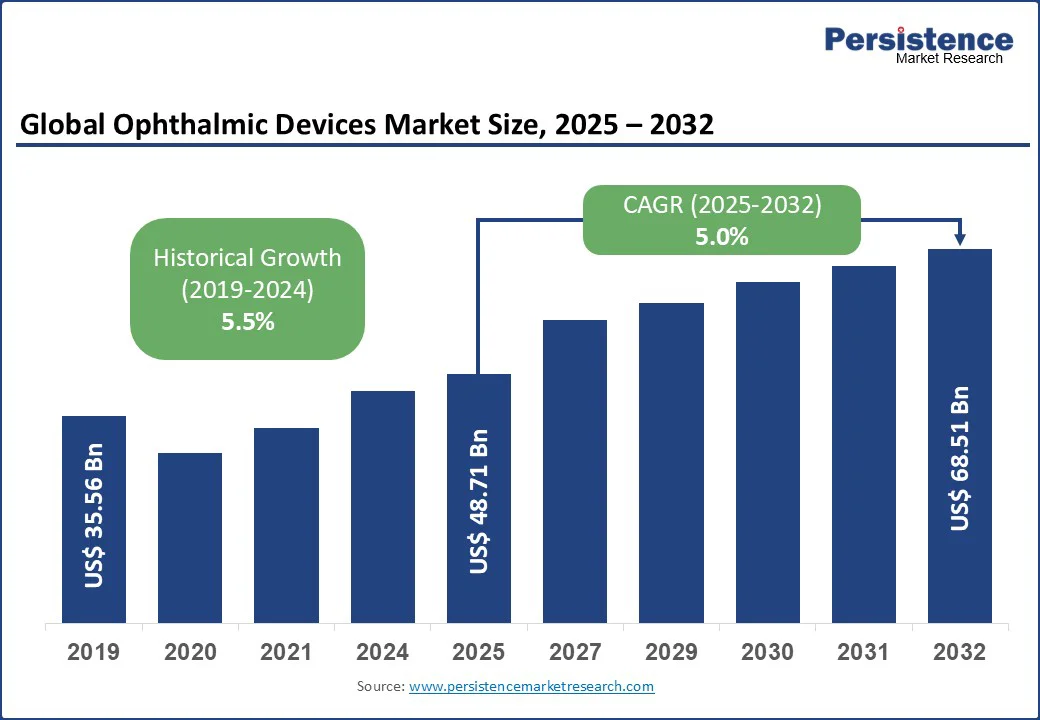
The global ophthalmic devices market size is likely to be valued at US$ 48.71 Bn in 2025, and is estimated to reach US$ 68.51 Bn by 2032, growing at a CAGR of 5.0% during the forecast period 2025 - 2032 due to the increasing presence of smart contact lenses, promising progress in robot-assisted eye surgeries, and the growing adoption of automated phacoemulsification systems that minimize the long wait for cataract surgery.
Key Industry Highlights:
- Dominant Device Type: The vision care device segment is poised to command a dominant share of approximately 62% in 2025, driven by a surging demand for spectacles and contact lenses in response to a rising number of refractive error cases globally.
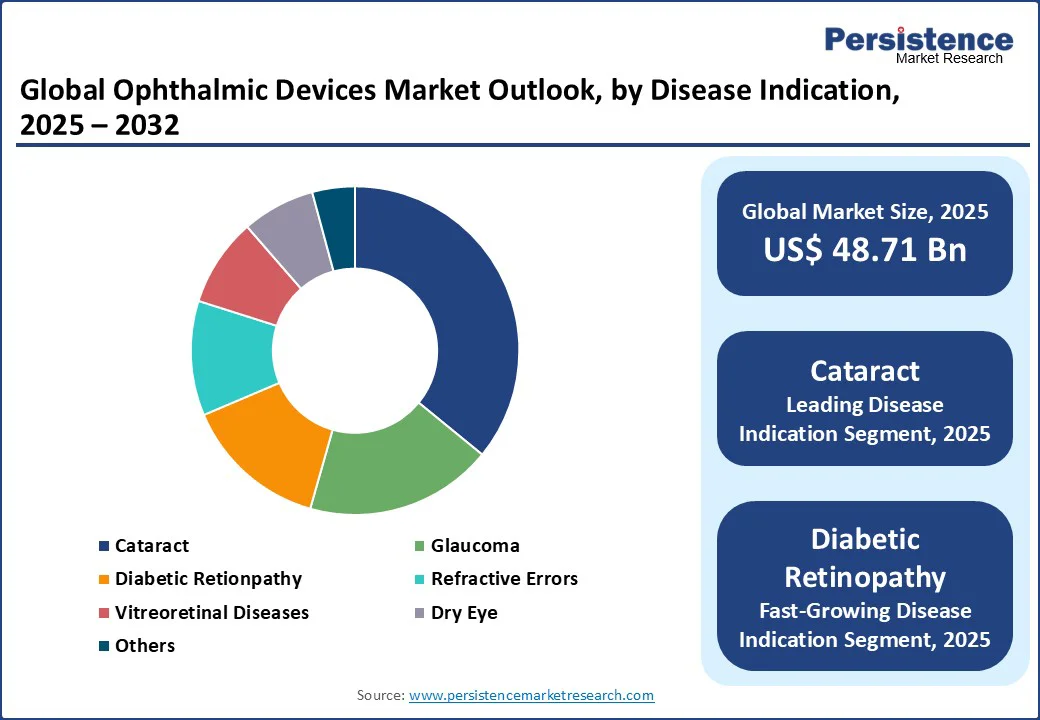
- Leading Disease Indication: Cataract is anticipated to secure the largest ophthalmic devices market revenue share of about 36% in 2025, owing to the high global burden of age-related cataract.
- Fastest-growing Disease Indication: Diabetic retinopathy is expected to register the highest CAGR of around 7.0% through 2032, fueled by the global diabetes epidemic and AI-powered retinal diagnostics.
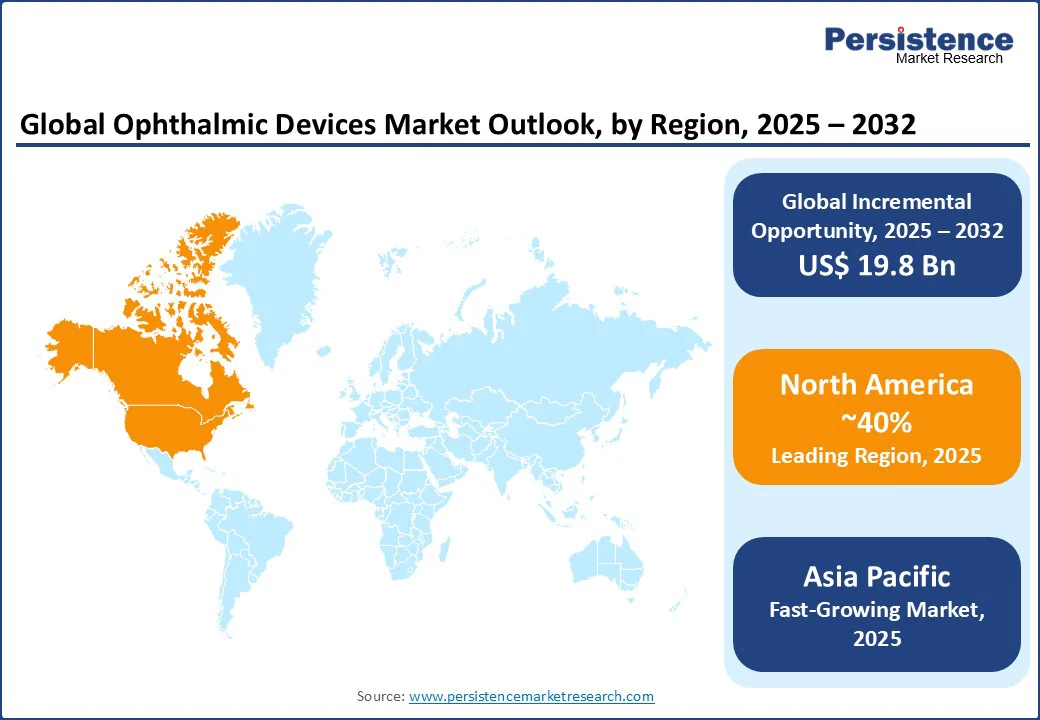
- Largest Regional Market: North America is projected to hold the regional share at around 40% in 2025, propelled by advanced healthcare infrastructure, favorable reimbursement models, and rapid adoption of cutting-edge ophthalmic technologies.
- Fastest-growing Regional Market: Asia Pacific is likely to be the fastest-growing regional market during 2025 - 2032 with a CAGR above 7.0%, driven by a widespread prevalence of ocular diseases, expanding healthcare access, and innovative tele-ophthalmology programs in emerging economies.
- Notable Development: In July 2025, Alcon announced its intention to acquire LumiThera, Inc., including its FDA-cleared Valeda photobiomodulation (PBM) device, the only therapy to show meaningful vision improvement in early- to intermediate-stage dry age-related macular degeneration (AMD) over two years.
| Global Market Attribute | Key Insights |
|---|---|
| Ophthalmic Devices Market Size (2025E) | US$ 48.71 Bn |
| Market Value Forecast (2032F) | US$ 68.51 Bn |
| Projected Growth (CAGR 2025 to 2032) | 5.0% |
| Historical Market Growth (CAGR 2019 to 2024) | 5.5% |
Market Dynamics
Driver - High Global Prevalence of Age-related Eye Disorders to Push the Demand for Ophthalmic Devices
The accelerating global burden of age-related eye disorders accounts as the critical driver propelling the ophthalmic devices market growth into an explosive trajectory. In its World Population Prospects 2024, the UN DESA predicts that by the 2070s, the number of people aged 65 and above will reach 2.2 billion, and around the mid-2030s, nearly 265 million people will be aged 80 and above, surpassing infants.
Furthermore, the WHO estimates that of the 2.2 billion people worldwide suffering from vision impairment or loss, most are at or above the age of 50. As a result, there is a mounting incidence of cataracts, glaucoma, diabetic retinopathy, and macular degeneration.
Since all of these conditions are preventable, the demand for sophisticated ophthalmic surgical and diagnostic tools, ranging from AI-enhanced optical coherence tomography (OCT) systems to minimally invasive femtosecond lasers, which collectively improve diagnostic accuracy and surgical outcomes, is increasing speedily.
For example, femtosecond laser-assisted cataract surgery has been shown to reduce complication rates by up to 30%, boosting patient safety and recovery times, a game-changer for ophthalmologists aiming to expand high-precision care efficiently. Besides this, increasing diabetes prevalence, affecting over 537 million adults globally, as per the International Diabetes Federation (IDF), will likely amplify demand for retinal imaging and vitrectomy equipment to manage diabetic retinopathy even more.
Restraint - Skewed Uptake of Ophthalmic Devices to Inhibit Market Expansion
One of the factors responsible for the limited expansion of the ophthalmic devices market is the uneven adoption of advanced ophthalmic technologies due to disparities in healthcare infrastructure and skilled workforce availability, particularly in emerging and underdeveloped regions.
While cutting-edge diagnostics and surgical devices such as femtosecond lasers offer transformative clinical benefits, their deployment is often limited by a lack of trained ophthalmologists and technicians who can operate these sophisticated instruments effectively.
For example, despite India’s vast market potential, there remain large swathes of rural areas where eye care access is restricted due to a shortage of specialists and inadequate training facilities.
Furthermore, the steep learning curve and maintenance requirements of complex ocular equipment deter smaller clinics from deploying them, creating a technological divide that restrains market growth and delays the global standardization of eye care. This gap between innovation and on-the-ground capability has ultimately slowed down the diffusion of new-age ophthalmic devices across key emerging markets.
Opportunity - Integration of AI and ML in Ophthalmic Procedures to Spur Market Growth
The ophthalmic devices market is getting stimulated by the rapid advancement and integration of artificial intelligence (AI), machine learning (ML), and tele-ophthalmology into ophthalmic diagnostics and treatment. These cutting-edge technologies are revolutionizing early detection and personalized management of ocular diseases by enabling precise, automated image analysis, cloud-based patient monitoring, and remote consultation services.
For instance, a new review published in Pediatric Investigation in June 2025 explored how AI, ML, and deep learning can revolutionize early myopia care by detecting the condition from retinal images, identifying individual risk factors such as genetics and lifestyle, and predicting disease progression to aid preventive treatment strategies.
Furthermore, AI-driven platforms such as RetinAI Discovery leverage deep learning algorithms to analyze retinal images with remarkable accuracy, accelerating diagnosis of diabetic retinopathy and age-related macular degeneration (AMD) while reducing clinician workload.
At the same time, tele-ophthalmology has expanded access to eye care in remote and underserved regions, considerably increasing screening rates and early intervention, which in turn are expected to stoke the demand for advanced diagnostic devices and remote-capable ophthalmic equipment.
Category-wise Analysis
Disease Indication Insights
Among diseases, cataract is anticipated to lead the market with a revenue share of nearly 36% in 2025. This dominance is attributable to the surging prevalence of age-related cataract. The Global Burden of Disease Study 2021 found that from 1991 to 2021, the global years lived with disabilities (YLDs) due to cataracts rose by 91.8%, from 3.42 million to 6.55 million.
Innovations such as femtosecond laser-assisted cataract surgery have revolutionized treatment precision and patient outcomes, reducing recovery time and surgical risks significantly. This segment is also set to make notable gains from the growing geriatric populations, especially in China, Japan, the U.S., and the European Union (EU), where expanding healthcare infrastructure and government initiatives aim to reduce cataract-related blindness through accessible surgical solutions.
On the other hand, the segment slated to display the highest CAGR of about 7.0% through 2032 is diabetic retinopathy, essentially because of the rise in global diabetes epidemic impacting over 537 million adults, according to the IDF. The factor favouring the growth of this segment is the increasing adoption of advanced retinal imaging devices, AI-integrated diagnostic platforms, and therapeutics targeting early detection and intervention to prevent vision loss.
Notably, AI-based retinal screening tools such as the FDA-approved IDx-DR have elevated the diagnostic precision of diabetes retinopathy in primary care settings, enhancing reach and efficiency. Furthermore, rising awareness campaigns and tele-ophthalmology programs in underserved regions are broadening patient access, propelling the demand for diagnostic fundus cameras, OCT systems, and vitreoretinal surgical devices.
Device Type Insights
Vision care devices are expected to account for roughly 62% of the revenue share in the device type category in 2025, authoritatively leading the ophthalmic devices market. The enviable position of this segment is a result of the massive demand for ocular corrective solutions such as spectacles and contact lenses, getting even more fuelled by the rising prevalence of refractive errors and myopia.
Projected to affect over half the global population by 2050, the high incidence of these conditions has produced an urgent need for advanced vision correction solutions. Consumer awareness, fashion trends in eyewear, and technological advancements such as blue light filtering and smart lenses are also contributing to the growth of the vision care segment.
Contrastingly, ophthalmic diagnostic devices are anticipated to exhibit approximately 6.5% CAGR through 2032, the highest in the lot, driven by technological innovations and an increasingly critical need for early detection of eye disorders such as diabetic retinopathy and glaucoma.
Advances in optical coherence tomography, fundus imaging, and AI-powered diagnostic platforms are improving diagnostic accuracy and operational efficiency, enabling ophthalmologists to identify and treat eye diseases earlier and more effectively.
For example, AI-integrated OCT devices now enable automated retinal layer segmentation and pathology detection with over 90% accuracy, significantly improving clinical decision-making and patient management. Furthermore, the rising adoption of tele-ophthalmology and portable diagnostic tools in emerging markets is expanding access to eye care, stimulating the demand for advanced ophthalmic diagnostic equipment globally.
Regional Insights
North America Ophthalmic Devices Market Trends
North America is set to command approximately 40% of the ophthalmic devices market share in 2025 on account of the robust healthcare infrastructure, supportive reimbursement systems, and widespread awareness about ocular disorders and age-related eye diseases across the U.S. and Canada.
The regional market also benefits from the rapid adoption of cutting-edge medical technologies, including AI-enabled diagnostics, femtosecond lasers, and minimally invasive glaucoma surgery devices. For example, the U.S. leads the market here, aided by an increasing geriatric population and a rising incidence of diabetic retinopathy and glaucoma.
Insurance models and regulatory frameworks are also being modified to favor patient safety and encourage innovation, enabling faster introduction of new ophthalmic devices into the market.
Asia Pacific Ophthalmic Devices Market Trends
Asia Pacific, expected to be the fastest growing regional market through 2025 - 2032 with an estimated CAGR over 7.0%, is propelled by a high prevalence of preventable eye diseases and vision impairment affecting millions, a substantial diabetic population, and rapidly aging demographics.
Countries such as China, India, and Japan are spearheading the demand for cutting-edge ophthalmic devices due to increased government interventions in meeting cataract surgery backlogs and promoting diabetic retinopathy screening programs.
Innovative models such as Aravind Eye Care’s telemedicine network in India are revolutionizing access to such treatments and technologies in rural areas, where 60% of screenings occur in community health camps. The rise of local manufacturing hubs in China and South Korea have reduced import dependency and pushed the adoption of cost-effective ophthalmic devices, further accelerating market expansion.
Europe Ophthalmic Devices Market Trends
Europe, characterized by mature healthcare systems with universal health coverage prioritizing early diagnosis and treatment of age-related ophthalmic diseases such as AMD and glaucoma, offers excellent opportunities for market players.
Stakeholders in the region are also known to show strong adoption of advanced diagnostic platforms such as high-resolution OCT and scanning laser ophthalmoscopes, especially in Germany, France, and the U.K. Dedicated government-supported screening programs and regulatory support for innovative medical devices, including streamlined CE marking processes in the European Union (EU), are likely to aid regional market penetration.
The gradual transition to AI-powered diagnostics among healthcare facilities and professionals in Europe signals a movement toward precision ophthalmology with an aim to enhance patient outcomes.
Competitive Landscape
A confluence of factors revolving around relentless innovation, strategic acquisitions, and intricate collaborations is governing the dynamics of the competitive landscape of the global ophthalmic devices market.
At the forefront is the integration of artificial intelligence and machine learning into diagnostic platforms and surgical tools by key players such as Alcon Vision and Johnson & Johnson, facilitating early intervention in preventable diseases such as glaucoma and diabetic retinopathy. Several large players are also increasingly investing in precision surgical systems such as femtosecond lasers that reduce complications and recovery times.
On the other hand, industry leaders are implementing mergers & acquisitions (M&A) strategies in a bid to diversify their portfolios and amplify geographic reach. Moreover, the rise of cloud-based data analytics and tele-ophthalmology is envisaged to sufficiently meet the growing demand for remote patient monitoring, creating new service-based revenue streams and fostering value-based care models.
Key Industry Developments
- In August 2025, the FDA granted conditional approval for an Investigational Device Exemption (IDE), allowing Myra Vision to begin its ADAPT clinical trial for evaluating the Calibreye™ Titratable Glaucoma Therapy™ (TGT) system. This innovative aqueous shunt offers ophthalmologists adjustable, slit lamp-based control over intraocular fluid outflow, potentially providing safer, personalized treatment for up to 70 patients with refractory glaucoma over 12 months.
- In July 2025, Topcon Healthcare acquired Intelligent Retinal Imaging Systems (IRIS), a U.S.-based provider of cloud-based, AI-powered diabetic retinopathy screening solutions. Integrating IRIS into its Healthcare from the Eye initiative and Harmony platform, Topcon aims to enhance care coordination between primary care and eye care providers, enabling earlier detection, smoother referrals, and improved shared decision-making.
- In June 2025, Johnson & Johnson expanded its TECNIS Odyssey intraocular lens (IOL), a full-range presbyopia-correcting lens offering continuous and high-contrast vision from near to far and in low-light conditions, now to Europe, the Middle East, and Canada, following its U.S. debut in October 2024. Over 95% of patients surveyed expressed satisfaction with both reading and distance vision, underscoring the lens's effectiveness in reducing reliance on glasses.
Companies Covered in Ophthalmic Devices Market
- Alcon Vision LLC
- Johnson & Johnson Vision Care, Inc.
- Essilor International S.A.
- Carl Zeiss Meditec AG
- Bausch & Lomb Incorporated
- Topcon Corporation
- Nidek Co. Ltd.
- Haag-Streit AG
- Ziemer Ophthalmic Systems AG
- CooperVision, Inc.
Frequently Asked Questions
The global ophthalmic devices market is projected to reach US$ 48.71 billion in 2025.
The increasing prevalence of age-related eye diseases amid a rapidly aging population globally drives the market.
The ophthalmic devices market is poised to witness a CAGR of 5.0% from 2025 to 2032.
The advancement and integration of artificial intelligence (AI), machine learning (ML), and tele-ophthalmology into ophthalmic diagnostics and treatment are key market opportunities.
Alcon Vision LLC, Johnson & Johnson Vision Care, Inc., and Essilor International S.A.are some leading players.


