


- Biotechnology
- Multiomics Market
Multiomics Market Size, Trends, Share, Growth, and Regional Forecast, 2026 to 2033
Multiomics Market by Product (Instruments, Consumables, Software, and Services), by Workflow Type (Single-cell Multiomics, and Bulk Multiomics), by Platform (Genomics, Transcriptomics, Proteomics, and Metabolomics), by Application (Oncology, Neurology, Immunology, and Rare Diseases), End-user (Pharmaceutical & Biotechnology Companies, Academic and Research Institutes, and Others), and Regional Analysis from 2026 to 2033
Multiomics Market Share and Trends Analysis
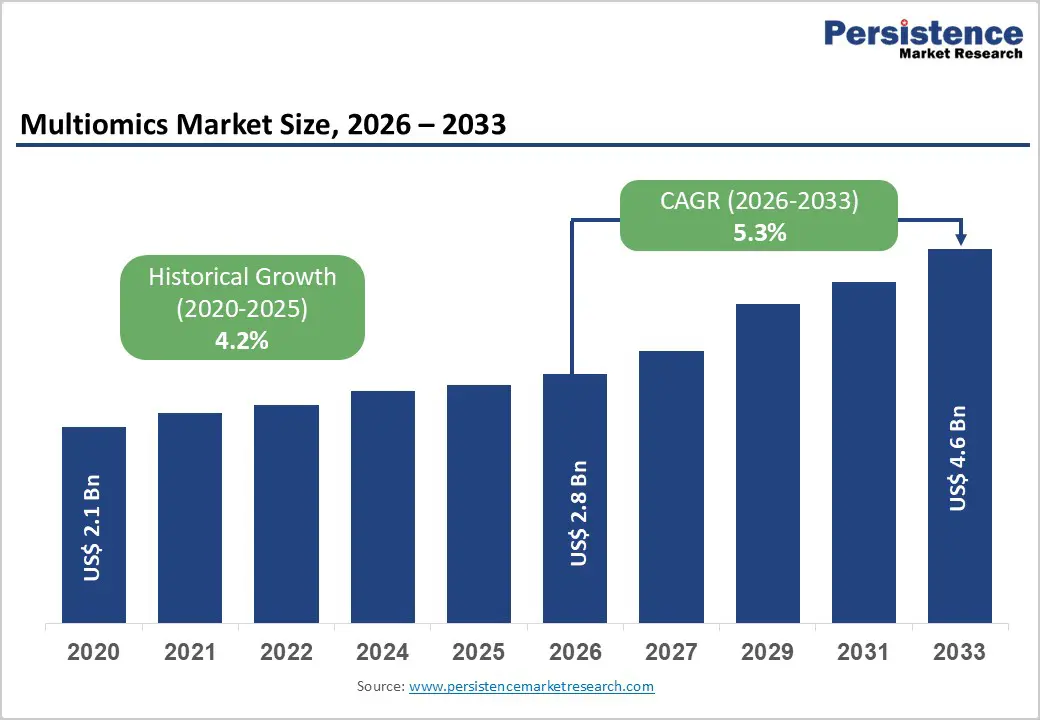
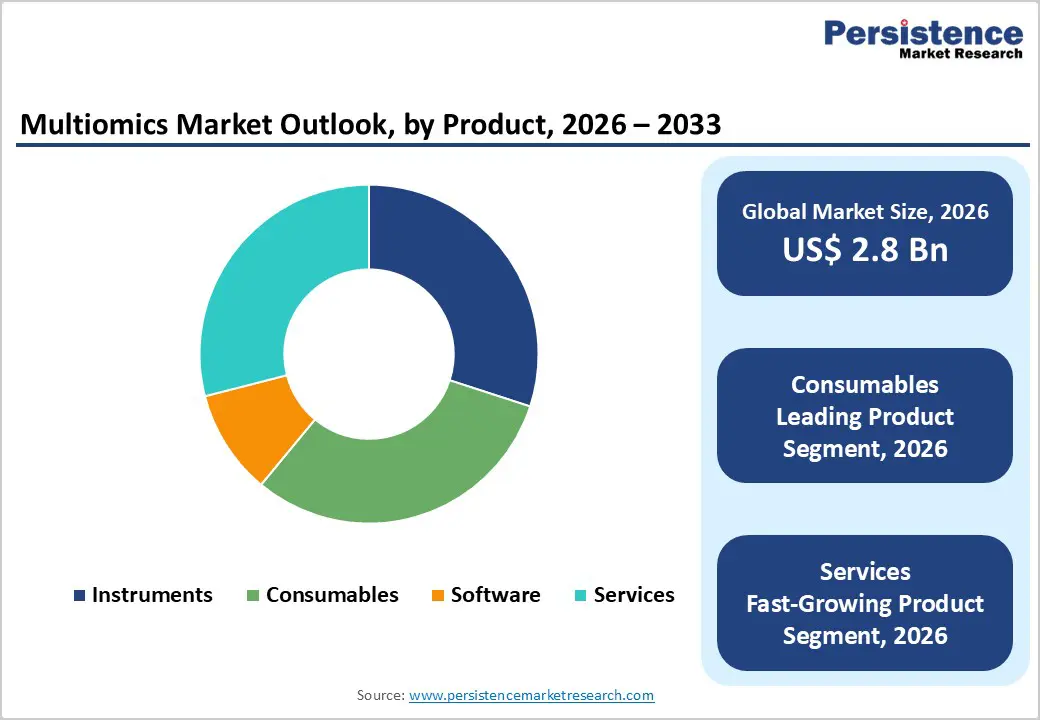
The global multiomics market size is likely to be valued at US$ 2.8 billion in 2026 to US$ 4.6 billion by 2033 growing at a CAGR of 5.3% during the forecast period from 2026 to 2033.
The global demand for multiomics is increasing steadily, driven by the rising prevalence of complex chronic diseases, expanding adoption of precision medicine, and growing reliance on integrated biological data for clinical and translational research. Increasing use of genomics, transcriptomics, proteomics, and metabolomics in drug discovery, biomarker identification, and disease stratification is supporting sustained market growth.
Rise in research activity, expanding access to advanced analytical platforms, and higher healthcare and life sciences R&D expenditure are further accelerating demand. Continuous innovation in assay sensitivity, data integration accuracy, analytical throughput, and bioinformatics connectivity is improving research efficiency, data reliability, and clinical relevance. Additionally, the growing shift toward single-cell analysis, AI-driven data interpretation, and digitally integrated laboratory workflows is further propelling the global multiomics market.
Key Industry Highlights
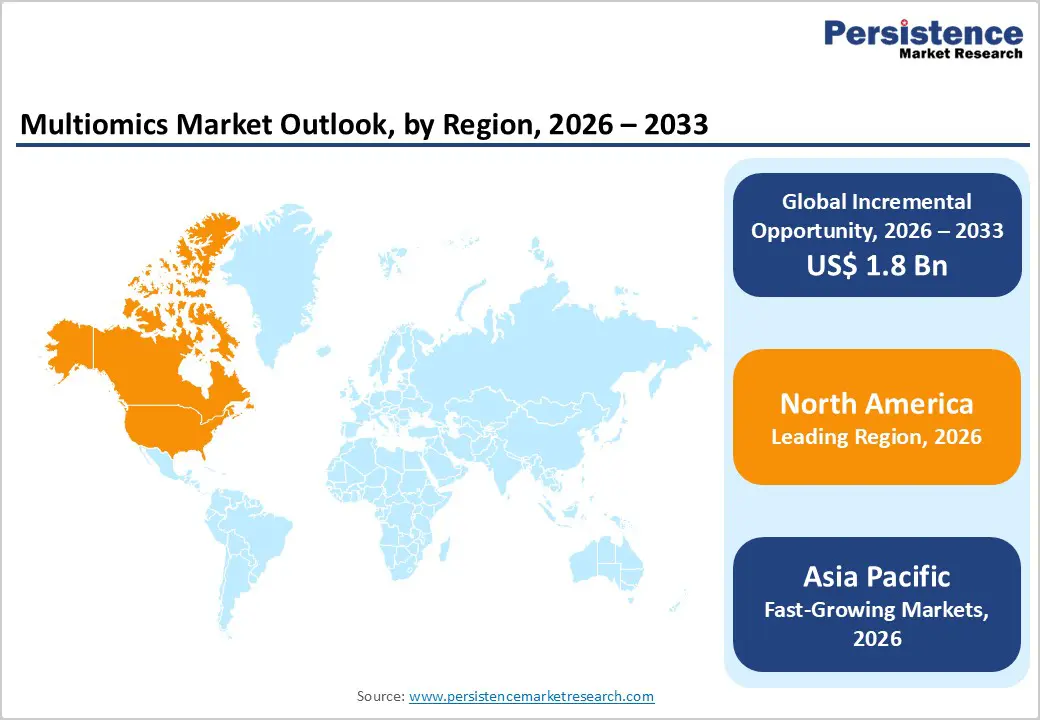
- Leading Region: North America holds the largest share at 47.8%, supported by advanced healthcare and research infrastructure, high life sciences R&D spending, early adoption of multiomics technologies, and the strong presence of leading multiomics platform providers.
- Fastest-Growing Region: Asia Pacific is expanding fastest due to a large patient population, rapid expansion of genomic and proteomic research facilities, improving healthcare and research infrastructure, and rising government and private investments in life sciences.
- Leading Platform Segment: Genomics dominates the market due to their broad applicability across research and clinical workflows, high scalability, and central role in multiomics integration.
- Fastest-Growing Platform Segment: Proteomics are expanding rapidly as demand increases for functional insights, biomarker validation, and cost-effective disease profiling solutions.
- Leading Application Segment: Oncology remains the top segment, driven by extensive use of multiomics in cancer research, precision oncology, and biomarker-driven therapy development.
- Fastest-Growing Application Segment: Rare diseases are scaling quickly as demand rises for deeper molecular insights, improved diagnostic accuracy, and integrated multiomics approaches to address unmet clinical needs.
| Key Insights | Details |
|---|---|
| Multiomics Market Size (2026E) | US$ 2.8 Bn |
| Market Value Forecast (2033F) | US$ 4.6 Bn |
| Projected Growth (CAGR 2026 to 2033) | 5.3% |
| Historical Market Growth (CAGR 2020 to 2025) | 4.2% |
Market Dynamics
Driver - Rising Adoption of Precision Medicine and Expansion of Translational Research
The growing emphasis on precision medicine is a major driver of multiomics adoption, as healthcare systems and life sciences companies increasingly focus on patient stratification, targeted therapies, and personalized treatment pathways. Integrated multiomics approaches combining genomics, transcriptomics, proteomics, and metabolomics enable a deeper understanding of disease heterogeneity, molecular mechanisms, and treatment response variability. This is particularly evident in oncology, immunology, and rare diseases, where single-omics analysis is often insufficient to capture biological complexity. As clinical decision-making shifts toward biomarker-driven and data-rich frameworks, demand for comprehensive multiomics profiling continues to expand across both research and translational settings.
The rising biopharmaceutical R&D investments and the expansion of large-scale research initiatives are accelerating market growth. Pharmaceutical and biotechnology companies are increasingly deploying multiomics to improve target identification, optimize lead selection, and reduce attrition rates across drug development pipelines. At the same time, government-funded genomics programs and population-scale health initiatives are generating vast multi-layered datasets, creating sustained demand for advanced multiomics platforms and analytics. These efforts support long-term data generation, foster public-private collaboration, and strengthen the role of multiomics as a foundational tool for next-generation biomedical research and therapeutic innovation.
Restraints - High Cost and Operational Complexity of Multiomics Implementation
The high cost associated with multiomics workflows remains a key restraint for broader market adoption. Integrated multiomics studies require significant capital investment in advanced instruments such as next-generation sequencers, mass spectrometers, and single-cell platforms, along with recurring expenditure on specialized consumables and reagents. In addition, licensing fees for bioinformatics software, cloud computing resources, and data storage further increase total project costs. These financial barriers limit adoption among smaller research laboratories, academic institutions with constrained budgets, and stakeholders in emerging markets, where funding availability and reimbursement mechanisms for advanced molecular analyses remain limited.
Moreover, the operational complexity of multiomics data integration and analysis presents a substantial challenge. Managing, harmonizing, and interpreting large, multi-layered datasets generated from different omics platforms is technically demanding and resource intensive. The lack of unified data standards, variable analytical pipelines, and inconsistent reporting formats complicates cross-study comparison and reproducibility. These challenges hinder large-scale data sharing, slow clinical translation, and increase dependency on highly specialized bioinformatics expertise. Until standardization improves and analytical workflows become more streamlined and automated, these factors will continue to restrain the full-scale adoption of multiomics solutions.
Opportunity - Emerging Opportunities in Advanced Disease Research and Data-Driven Multiomics
The increasing application of multiomics in rare and complex diseases represents a significant growth opportunity for the market. Rare diseases often exhibit high genetic and molecular heterogeneity, making them difficult to diagnose and treat using conventional single-omics approaches. Multiomics enables comprehensive molecular characterization by integrating genomic, transcriptomic, proteomic, and metabolomic data, supporting improved disease classification, biomarker discovery, and therapeutic target identification. This capability is particularly valuable in underserved disease areas where limited patient populations and fragmented biological data have historically constrained research progress. As regulatory agencies and funding bodies place greater emphasis on rare disease research, adoption of multiomics platforms is expected to accelerate.
Furthermore, technological advancements are expanding opportunities through AI-enabled analytics and high-resolution profiling techniques. The integration of artificial intelligence and machine learning into multiomics workflows is streamlining data interpretation, uncovering complex biological patterns, and generating actionable insights at scale. At the same time, rapid expansion of single-cell and spatial multiomics is enabling precise analysis of cellular heterogeneity and tissue microenvironments, particularly in oncology and immunology. Together, these innovations are enhancing analytical depth, improving translational relevance, and positioning advanced multiomics platforms as critical tools for next-generation biomedical research and therapeutic development.
Category-wise Analysis
By Product, Consumables Lead Due to High Reagent Intensity and Recurring Usage
The consumables segment is projected to dominate the global multiomics market in 2026, accounting for a revenue share of 31.0%. This dominance is primarily driven by the intensive and repetitive use of reagents, kits, assay panels, sample preparation chemistries, and sequencing consumables across genomics, proteomics, transcriptomics, and metabolomics workflows. Multiomics studies typically require multiple layers of sample processing and validation, significantly increasing consumable consumption per project. Rising adoption of large-scale population studies, longitudinal clinical research, and single-cell multiomics applications is further reinforcing demand. Continuous innovation in library preparation kits, high-sensitivity reagents, and automation-compatible consumables is improving data quality and throughput, supporting sustained leadership of the consumables segment.
By Workflow Type, Bulk Multiomics Maintains Leadership Due to Established Research Utility
The bulk multiomics segment is projected to dominate the global multiomics market in 2026, accounting for a revenue share of 55.0%. This leadership is driven by the widespread adoption of bulk-level omics analysis in drug discovery, biomarker identification, and population-scale research studies. Bulk multiomics workflows offer cost efficiency, high throughput, and strong reproducibility, making them well suited for large cohorts and translational research programs. Established analytical pipelines, robust data interpretation frameworks, and compatibility with existing sequencing and mass spectrometry infrastructure continue to support adoption. Strong validation across oncology, immunology, and metabolic disease research, along with increasing utilization in emerging markets, further strengthens the segment’s dominant market position.
By End User, Pharmaceutical & Biotechnology Companies Lead Due to Advanced R&D Capabilities
The pharmaceutical & biotechnology companies segment is projected to dominate the global multiomics market in 2026, accounting for a revenue share of 45.0%. This dominance is driven by high volumes of diagnostic and interventional cardiology procedures performed in hospital-based catheterization laboratories. Hospitals are typically equipped with advanced imaging systems, integrated hemodynamic monitoring platforms, and specialized interventional cardiology teams required for complex coronary physiology assessments. Strong investment in cath lab infrastructure, access to skilled operators, and comprehensive post-procedural care capabilities further reinforce their leading role. Long-term procurement contracts, centralized purchasing, and preference for premium pressure guidewire systems also contribute significantly to hospital-led revenue generation.
Regional Insights
North America Multiomics Market Trends
North America is expected to dominate the global multiomics market with a value share of in 2026, led primarily by the United States. The region benefits from a highly developed 47.8% healthcare infrastructure, strong research funding ecosystems, and early adoption of advanced omics technologies across academic, clinical, and biopharmaceutical settings. Robust penetration of next-generation sequencing, mass spectrometry, and high-throughput analytical platforms supports large-scale multiomics studies in oncology, immunology, and precision medicine. The presence of well-established biopharma companies, leading research universities, and national genomic initiatives drives sustained demand for integrated multiomics workflows.
Market growth in North America is further supported by rapid integration of AI-enabled bioinformatics platforms, cloud-based data analytics, and digital laboratory automation that enhance data interpretation and translational research outcomes. Favorable regulatory pathways, strong intellectual property frameworks, and consistent federal and private research funding accelerate commercialization of innovative multiomics solutions. Strategic collaborations between industry players, academic centers, and clinical research organizations, along with extensive researcher training programs, continue to reinforce the region’s leadership position in the global multiomics market.
Europe Multiomics Market Trends
The Europe multiomics market is expected to grow steadily, driven by an aging population, increasing prevalence of chronic and complex diseases, and expanding emphasis on precision medicine and systems biology research. Countries such as Germany, the U.K., France, Italy, and the Nordic region demonstrate strong adoption of genomics, proteomics, and metabolomics platforms, supported by publicly funded healthcare and research systems. Pan-European initiatives promoting data sharing, translational research, and personalized therapeutics are strengthening the role of multiomics across drug discovery and clinical research applications.
Growth is also supported by increasing adoption of integrated multiomics platforms designed to improve biological insight, biomarker discovery, and therapeutic stratification. Supportive regulatory frameworks, expanding public research budgets, and strong collaboration between academic institutions, biopharmaceutical companies, and technology providers continue to strengthen the regional ecosystem. Increasing integration of digital laboratory infrastructure, standardized research protocols, and cross-border clinical research networks is enhancing operational efficiency and data reproducibility, supporting sustained expansion of the multiomics market across Europe.
Asia Pacific Multiomics Market Trends
The Asia Pacific multiomics market is expected to register a relatively higher CAGR of around 7.2% between 2026 and 2033, driven by rapid expansion of healthcare and research infrastructure and growing investments in life sciences innovation. Large patient populations, rising burden of cancer, metabolic disorders, and neurological diseases, and increasing focus on precision medicine are accelerating demand across China, India, Japan, and South Korea. Expanding genomic research programs, increasing availability of advanced analytical platforms, and growing participation of academic research institutes are key contributors to regional growth.
Additionally, government-led biotechnology initiatives, rising public and private research funding, and expanding collaborations with global pharmaceutical companies are supporting adoption of multiomics technologies. Cost-competitive manufacturing, growing local instrument and reagent production, and strategic localization by multinational players are improving accessibility in emerging markets. Increasing awareness of integrated omics approaches and gradual adoption of AI-driven data analytics are strengthening long-term growth prospects for the Asia Pacific multiomics market.
Competitive Landscape
The global multiomics market is highly competitive, with strong participation from companies such as BD, Thermo Fisher Scientific, Inc., Illumina, Inc., Danaher (Beckman Coulter), PerkinElmer, Inc., and Shimadzu Corporation. These players leverage extensive global distribution networks, strong brand recognition, and continuous innovation in multiomics instruments, reagents, and bioinformatics solutions to address evolving research and clinical needs. Their portfolios emphasize high-throughput data generation, cross-omics integration, scalability, and workflow automation, enabling broad adoption across genomics, proteomics, transcriptomics, and metabolomics applications.
Growing demand for precision medicine, single-cell analysis, and systems biology research is driving ongoing product innovation and portfolio expansion. Manufacturers are increasingly prioritizing advancements in sample preparation chemistries, high-resolution analytical platforms, AI-enabled data integration, and cloud-based analytics. Strategic priorities include expanding collaborations with academic and research institutes, strengthening bioinformatics and software capabilities, pursuing geographic expansion in high-growth emerging markets, and forming partnerships with pharmaceutical and biotechnology companies to reinforce competitive positioning and support long-term market growth.
Key Industry Developments:
- In December 2025, The Hong Kong University of Science and Technology (HKUST), in collaboration with the Southern Marine Science and Engineering Guangdong Laboratory (Guangzhou), launched the world’s first Deep Ocean Omics (DOO) database. The platform integrates and analyzes multiomics data from deep-sea organisms in extreme environments, supported by specialized analytical tools for cross-species and evolutionary studies. As the largest database of its kind, DOO aims to advance understanding of deep-sea biodiversity while enabling global research and applications related to biological adaptation in extreme conditions.
- In December 2025, Bio-Techne Corporation partnered with the Wyss Center for Bio and Neuroengineering to develop an automated 3D multiomics workflow enabling simultaneous RNA and protein detection in three-dimensional tissue samples. The collaboration builds on Bio-Techne’s existing 2D spatial biology platforms, aiming to provide deeper insights into tissue architecture and cellular interactions through advanced 3D multiomic analysis.
- In October 2025, researchers from Weill Cornell Medicine and the University of Adelaide introduced a new multiomics tool that links gene mutations with gene activity at the single-cell level. Using UMAP analysis of 45,963 cancer cells from aggressive chronic lymphocytic leukemia cases, the platform identified distinct cellular states and uncovered shared gene activity patterns associated with treatment resistance. The technology supports diverse pathology samples and high-throughput analysis, enabling deeper insights into cancer progression and therapeutic resistance.
Companies Covered in Multiomics Market
- BD
- Thermo Fisher Scientific, Inc.
- Illumina, Inc
- Danaher (Beckman Coulter)
- PerkinElmer, Inc
- Shimadzu Corporation
- Bruker
- QIAGEN
- Agilent Technologies, Inc.
- BGI Genomics
- Twist Bioscience
- Revvity
- AstraZeneca
- SIGNIOSBIO
- Others
Frequently Asked Questions
The global multiomics market is projected to be valued at US$ 2.8 Bn in 2026.
Rising adoption of precision medicine, rapid growth in single-cell and integrative biology research, declining sequencing costs, and increasing biopharma investment in multiomics-based drug discovery and biomarker development.
The global multiomics market is poised to witness a CAGR of 5.3% between 2026 and 2033.
Expansion of AI-enabled data integration platforms, growing demand for single-cell and spatial multiomics, and increasing application of multiomics in immuno-oncology, rare diseases, and clinical decision support.
BD, Thermo Fisher Scientific, Inc., Illumina, Inc, Danaher (Beckman Coulter), PerkinElmer, Inc, Shimadzu Corporation are some of the key players in the multiomics market.


