

- Executive Summary
- Global Mouthwash Market Snapshot, 2025 and 2032
- Market Opportunity Assessment, 2025 - 2032, US$ Bn
- Key Market Trends
- Future Market Projections
- Premium Market Insights
- Industry Developments and Key Market Events
- PMR Analysis and Recommendations
- Market Overview
- Market Scope and Definition
- Market Dynamics
- Drivers
- Restraints
- Opportunity
- Challenges
- Key Trends
- COVID-19 Impact Analysis
- Forecast Factors - Relevance and Impact
- Value Added Insights
- Value Chain Analysis
- Product Adoption / Usage Analysis
- Key Market Players
- Regulatory Landscape
- PESTLE Analysis
- Porter’s Five Forces Analysis
- Consumer Behavior Analysis
- Price Trend Analysis, 2019 - 2032
- Key Factors Impacting Prices
- Pricing Analysis by Type
- Regional Prices and Product Preferences
- Global Mouthwash Market Outlook
- Key Highlights
- Market Volume (Units) Projections
- Market Size (US$ Bn) and Y-o-Y Growth
- Absolute $ Opportunity
- Market Size (US$ Bn) Analysis and Forecast
- Historical Market Size (US$ Bn) Analysis, 2019-2024
- Current Market Size (US$ Bn) Analysis and Forecast, 2025-2032
- Global Mouthwash Market Outlook: Type
- Historical Market Size (US$ Bn) and Volume (Units) Analysis, By Type, 2019-2024
- Current Market Size (US$ Bn) and Volume (Units) Analysis and Forecast, By Type, 2025-2032
- Cosmetic
- Therapeutic
- Market Attractiveness Analysis: Type
- Global Mouthwash Market Outlook: Nature
- Historical Market Size (US$ Bn) Analysis, By Nature, 2019-2024
- Current Market Size (US$ Bn) Analysis and Forecast, By Nature, 2025-2032
- Natural & Organic
- Conventional
- Market Attractiveness Analysis: Nature
- Global Mouthwash Market Outlook: Application
- Historical Market Size (US$ Bn) Analysis, By Application, 2019-2024
- Current Market Size (US$ Bn) Analysis and Forecast, By Application, 2025-2032
- Plaque
- Gingivitis
- Cavity
- Whitening
- Bad Breath
- Others
- Market Attractiveness Analysis: Application
- Global Mouthwash Market Outlook: Distribution Channel
- Historical Market Size (US$ Bn) Analysis, By Distribution Channel, 2019-2024
- Current Market Size (US$ Bn) Analysis and Forecast, By Distribution Channel, 2025-2032
- e-Commerce
- Retail Pharmacies/Stores
- Hypermarkets/Supermarkets
- Market Attractiveness Analysis: Distribution Channel
- Key Highlights
- Global Mouthwash Market Outlook Region
- Historical Market Size (US$ Bn) and Volume (Units) Analysis, By Region, 2019-2024
- Current Market Size (US$ Bn) and Volume (Units) Analysis and Forecast by Region, 2025-2032
- North America
- Latin America
- Europe
- East Asia
- South Asia and Oceania
- Middle East & Africa
- Market Attractiveness Analysis: Region
- North America Mouthwash Market Outlook
- Historical Market Size (US$ Bn) Analysis, By Market, 2019-2024
- By Country
- By Type
- By Nature
- By Application
- By Distribution Channel
- Current Market Size (US$ Bn) and Volume (Units) Analysis and Forecast by Country, 2025-2032
- U.S.
- Canada
- Current Market Size (US$ Bn) and Volume (Units) Analysis and Forecast by Type, 2025-2032
- Cosmetic
- Therapeutic
- Current Market Size (US$ Bn) Analysis and Forecast by Nature, 2025-2032
- Natural & Organic
- Conventional
- Current Market Size (US$ Bn) Analysis and Forecast by Application, 2025-2032
- Plaque
- Gingivitis
- Cavity
- Whitening
- Bad Breath
- Others
- Current Market Size (US$ Bn) Analysis and Forecast by Distribution Channel, 2025-2032
- e-Commerce
- Retail Pharmacies/Stores
- Hypermarkets/Supermarkets
- Market Attractiveness Analysis
- Historical Market Size (US$ Bn) Analysis, By Market, 2019-2024
- Europe Mouthwash Market Outlook
- Historical Market Size (US$ Bn) Analysis, By Market, 2019-2024
- By Country
- By Type
- By Nature
- By Application
- By Distribution Channel
- Current Market Size (US$ Bn) Analysis and Forecast by Country, 2025-2032
- Germany
- France
- U.K.
- Italy
- Spain
- Russia
- Rest of Europe
- Current Market Size (US$ Bn) and Volume (Units) Analysis and Forecast by Type, 2025-2032
- Cosmetic
- Therapeutic
- Current Market Size (US$ Bn) Analysis and Forecast by Nature, 2025-2032
- Natural & Organic
- Conventional
- Current Market Size (US$ Bn) Analysis and Forecast by Application, 2025-2032
- Plaque
- Gingivitis
- Cavity
- Whitening
- Bad Breath
- Others
- Current Market Size (US$ Bn) Analysis and Forecast by Distribution Channel, 2025-2032
- e-Commerce
- Retail Pharmacies/Stores
- Hypermarkets/Supermarkets
- Market Attractiveness Analysis
- Historical Market Size (US$ Bn) Analysis, By Market, 2019-2024
- East Asia Mouthwash Market Outlook
- Historical Market Size (US$ Bn) Analysis, By Market, 2019-2024
- By Country
- By Type
- By Nature
- By Application
- By Distribution Channel
- Current Market Size (US$ Bn) and Volume (Units) Analysis and Forecast by Country, 2025-2032
- China
- Japan
- South Korea
- Current Market Size (US$ Bn) and Volume (Units) Analysis and Forecast by Type, 2025-2032
- Cosmetic
- Therapeutic
- Current Market Size (US$ Bn) Analysis and Forecast by Nature, 2025-2032
- Natural & Organic
- Conventional
- Current Market Size (US$ Bn) Analysis and Forecast by Application, 2025-2032
- Plaque
- Gingivitis
- Cavity
- Whitening
- Bad Breath
- Others
- Current Market Size (US$ Bn) Analysis and Forecast by Distribution Channel, 2025-2032
- e-Commerce
- Retail Pharmacies/Stores
- Hypermarkets/Supermarkets
- Market Attractiveness Analysis
- Historical Market Size (US$ Bn) Analysis, By Market, 2019-2024
- South Asia & Oceania Mouthwash Market Outlook
- Historical Market Size (US$ Bn) Analysis, By Market, 2019-2024
- By Country
- By Type
- By Nature
- By Application
- By Distribution Channel
- Current Market Size (US$ Bn) and Volume (Units) Analysis and Forecast by Country, 2025-2032
- India
- Indonesia
- Thailand
- Singapore
- ANZ
- Rest of South Asia & Oceania
- Current Market Size (US$ Bn) and Volume (Units) Analysis and Forecast by Type, 2025-2032
- Cosmetic
- Therapeutic
- Current Market Size (US$ Bn) Analysis and Forecast by Nature, 2025-2032
- Natural & Organic
- Conventional
- Current Market Size (US$ Bn) Analysis and Forecast by Application, 2025-2032
- Plaque
- Gingivitis
- Cavity
- Whitening
- Bad Breath
- Others
- Current Market Size (US$ Bn) Analysis and Forecast by Distribution Channel, 2025-2032
- e-Commerce
- Retail Pharmacies/Stores
- Hypermarkets/Supermarkets
- Market Attractiveness Analysis
- Historical Market Size (US$ Bn) Analysis, By Market, 2019-2024
- Latin America Mouthwash Market Outlook
- Historical Market Size (US$ Bn) Analysis, By Market, 2019-2024
- By Country
- By Type
- By Nature
- By Application
- By Distribution Channel
- Current Market Size (US$ Bn) and Volume (Units) Analysis and Forecast by Country, 2025-2032
- Brazil
- Mexico
- Rest of Latin America
- Current Market Size (US$ Bn) and Volume (Units) Analysis and Forecast by Type, 2025-2032
- Cosmetic
- Therapeutic
- Current Market Size (US$ Bn) Analysis and Forecast by Nature, 2025-2032
- Natural & Organic
- Conventional
- Current Market Size (US$ Bn) Analysis and Forecast by Application, 2025-2032
- Plaque
- Gingivitis
- Cavity
- Whitening
- Bad Breath
- Others
- Current Market Size (US$ Bn) Analysis and Forecast by Distribution Channel, 2025-2032
- e-Commerce
- Retail Pharmacies/Stores
- Hypermarkets/Supermarkets
- Market Attractiveness Analysis
- Historical Market Size (US$ Bn) Analysis, By Market, 2019-2024
- Middle East & Africa Mouthwash Market Outlook
- Historical Market Size (US$ Bn) Analysis, By Market, 2019-2024
- By Country
- By Type
- By Nature
- By Application
- By Distribution Channel
- Current Market Size (US$ Bn) and Volume (Units) Analysis and Forecast by Country, 2025-2032
- GCC Countries
- Egypt
- South Africa
- Northern Africa
- Rest of Middle East & Africa
- Current Market Size (US$ Bn) and Volume (Units) Analysis and Forecast by Type, 2025-2032
- Cosmetic
- Therapeutic
- Current Market Size (US$ Bn) Analysis and Forecast by Nature, 2025-2032
- Natural & Organic
- Conventional
- Current Market Size (US$ Bn) Analysis and Forecast by Application, 2025-2032
- Plaque
- Gingivitis
- Cavity
- Whitening
- Bad Breath
- Others
- Current Market Size (US$ Bn) Analysis and Forecast by Distribution Channel, 2025-2032
- e-Commerce
- Retail Pharmacies/Stores
- Hypermarkets/Supermarkets
- Market Attractiveness Analysis
- Historical Market Size (US$ Bn) Analysis, By Market, 2019-2024
- Competition Landscape
- Market Share Analysis, 2025
- Market Structure
- Competition Intensity Mapping by Market
- Competition Dashboard
- Company Profiles (Details - Overview, Financials, Strategy, Recent Developments)
- The Procter & Gamble Company
- Overview
- Segments and Sources
- Key Financials
- Market Developments
- Market Strategy
- Colgate-Palmolive
- GlaxoSmithKline plc
- Johnson & Johnson Services, Inc.
- Lion Corporation
- Tom’s of Maine
- Chattem Inc.
- Church & Dwight
- AMWAY
- SmartMouth Oral Health Laboratories
- Himalaya
- 3M
- Unilever
- Ambient Healthcare Pvt. Ltd.
- Kao Corporation
- Caldwell Consumer Health
- Dr. Harold Katz
- Sunstar Group
- Dentyl Active
- Jason Natural Care
- Lotus Brands Inc.
- Rowpar Pharmaceuticals Inc.
- Reckitt Benckiser Group Plc.
- Royal Philips N.V.
- Henkel AG & Co. KGaA
- Others
- The Procter & Gamble Company
- Appendix
- Research Methodology
- Research Assumptions
- Acronyms and Abbreviations


- Beauty & Personal Care
- Mouthwash Market
Mouthwash Market Size, Share, Trends, Growth, Trends and Forecasts, 2025 - 2032
Mouthwash Market by Type (Cosmetic and Therapeutic), by Nature (Natural & Organic and Conventional), by Application (Plaque, Gingivitis, Cavity, Whitening, Bad Breath, and Others) by Distribution Channel, and Regional Analysis for 2025 - 2032
Mouthwash Market Share and Trends Analysis
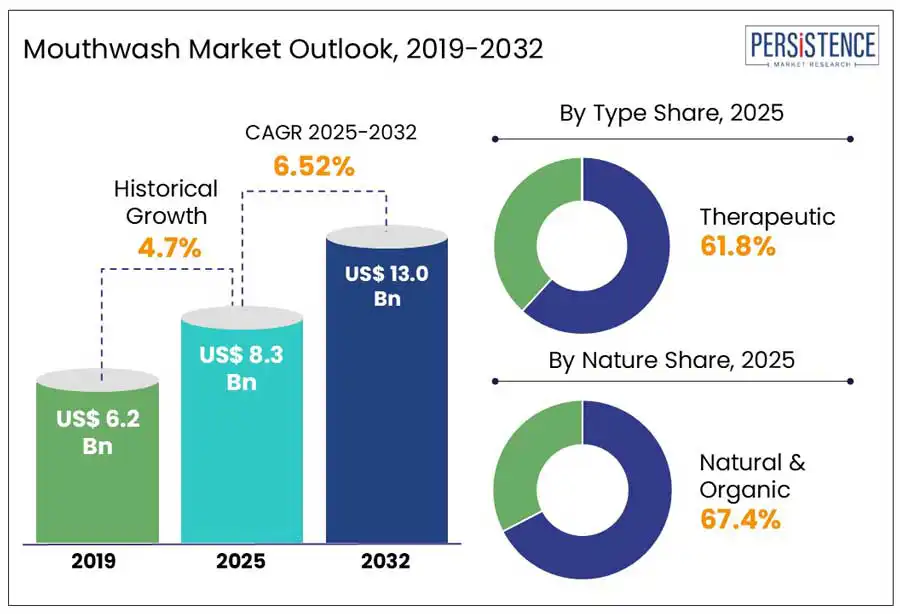
The global mouthwash market size is anticipated to reach a value of US$8.3 billion in 2025 and likely attain a value of US$13.0 billion to witness a CAGR of 6.5% by 2032. According to Persistence Market Research, the awareness of oral hygiene and the rising prevalence of dental issues are major growth factors. Mouthwash plays a crucial role in oral care by serving as an antiseptic solution that reduces bacteria and germs, further preventing conditions such as plaque, gingivitis, bad breath, and mouth ulcers. Beyond its therapeutic benefits, mouthwash is also used for cosmetic purposes, as a mouth cleanser, breath cleanser, and teeth whitening. Additionally, in cases of dry mouth, mouthwash can act as a saliva substitute, neutralizing acids and acting as a mouth moisturizer. Available in various flavors, mouthwashes offer therapeutic properties, including anti-bacterial, anti-fungal, and analgesic effects contributing to their widespread adoption in daily oral hygiene routines.
Key Industry Highlights:
- Public health campaigns promoting oral hygiene are increasing awareness and boosting mouthwash adoption.
- Online retail channels are expanding consumer reach, especially in remote and developing regions.
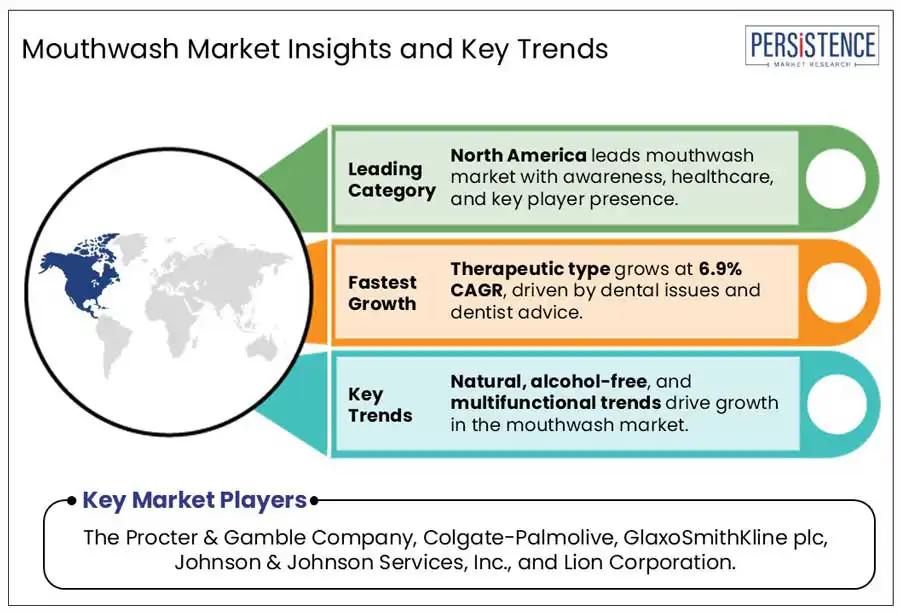
- Natural and organic mouthwashes are gaining traction as consumers seek safer alternatives to synthetic formulations.
- Ongoing product innovations include alcohol-free, multifunctional, and sensitivity-friendly variants.
|
Global Market Attribute |
Key Insights |
|
Mouthwash Market Size (2025E) |
US$ 8.3 Bn |
|
Market Value Forecast (2032F) |
US$ 13.0 Bn |
|
Projected Growth (CAGR 2025 to 2032) |
6.5% |
|
Historical Market Growth (CAGR 2019 to 2024) |
4.7% |
Market Dynamics
Driver - Growing Incidences of Dental Issues
The increasing prevalence of dental issues significantly propels the growth of the mouthwash market. According to the World Health Organization (WHO), untreated dental care in permanent teeth is the most common health condition globally, affecting approximately 3.7 billion people. In the United States, nearly 90% of adults aged 20 to 64 have experienced tooth decay, with one in four having untreated cavities. Furthermore, periodontal disease affects almost 50% of adults aged 45 to 64. These alarming statistics underscore a growing need for effective oral hygiene solutions. Mouthwashes with their anti-bacterial and therapeutic properties offer a convenient adjunct to regular brushing and flossing, preventing and managing dental caries and gum diseases. As the awareness of oral health increases, and with dental issues remaining prevalent, consumers are more inclined to turn to using mouthwash into their daily routine.
Restraint - Adverse Effects of Mouthwash and Low Awareness
Mouthwash plays an important role in maintaining oral hygiene. However, the side effects of using mouthwash, such as allergies in the mouth, impact on the taste buds, and dental over-sensitivities, are big obstacles to the regular adoption. Many mouthwashes contain synthetic ingredients that irritate the gums, damage teeth, and affect the inner oral tissues. Additionally, the mouthwash market faces slow growth in low and middle-income countries due to the limited awareness for oral care. These combined health concerns and regional disparities continue to restrain broader market expansion and product adoption.
Opportunity - Expanding Consumer Needs and Availability of Certified Products
The rising consumer awareness of comprehensive oral care and varying needs such as breath freshening, plaque control, teeth whitening, and dry mouth relief, consumers seek specialized solutions. Therapeutic mouthwashes offer anti-bacterial, anti-plaque, and fluoride-based benefits are in high demand. Products that cater to specific concerns such as dry mouth, enamel strengthening, or whitening opens doors for innovation. Additionally, the growing demand for child-friendly, alcohol-free formulations highlights a need for age-appropriate variants. Consumers are also more likely to trust products with certifications such as the Indian Dental Association (IDA) Seal of Acceptance. This shift toward personalized, functional, and certified products presents a significant opportunity for manufacturers to diversify and expand their offerings.
Category-Wise Insights
Type Insights
The growing incidence of oral health issues such as plaque buildup, gingivitis, halitosis, and dental caries is a major driver fueling the expansion of therapeutic mouthwash segment. These products enriched with active ingredients such as chlorhexidine and fluoride are widely recommended by dental professionals for their ability to provide lasting oral protection and support post-treatment care. As over two billion people worldwide suffer from permanent tooth decay and approximately 520 million children experience cavities in their former years.
This shift encourages consumers to choose therapeutic mouthwashes that offer more than cosmetic benefits, such as long-term protection and oral hygiene management. The emphasis on daily dental care and the need for effective at-home oral health solutions continues to strengthen the demand for therapeutic mouthwash products, establishing them as a key growth driver.
Nature Insights
For nature-based segmentation, the natural and organic segment holds a significant share, driven by rising consumer preference for safer and chemical-free oral care products. Synthetic mouthwashes while effective often come with side-effects such as dental sensitivity and irritation or thinning of oral mucosa. With the growing awareness, consumers are increasingly turning to herbal and plant-based alternatives that offer gentle yet effective protection.
Natural mouthwashes, typically formulated with ingredients such as neem, clove, tea tree oil, and aloe vera are becoming popular for their antimicrobial properties. The rising inclination toward holistic health, clean-label products, and sustainable choices is further fueling this demand. Additionally, the increasing availability of natural mouthwash options across retail and online channels has made them more accessible, positioning this segment as a key contributor to the overall market growth.
Regional Insights and Trends
North America Mouthwash Market Trends
The North America mouthwash industry is primarily driven by a heightened awareness of oral hygiene and the prevalence of dental issues, such as cavities and gum diseases. The U.S. mouthwash market stands out as the dominant country, accounting for over 25% of the global share.
This significant portion is attributed to the widespread adoption of oral care products and a proactive approach to dental health. Canada emerges as the fast-growing market in the region fueled by increasing consumer inclination toward preventive oral care and a rising demand for natural and alcohol-free mouthwash formulations. The trend toward natural products is gaining momentum with consumers seeking mouthwashes free from synthetic additives and harsh chemicals. Additionally, the expansion of e-commerce platforms has facilitated easier access to a diverse range of mouthwash products further propelling market growth in North America.
Europe Mouthwash Market Trends
Europe is experiencing a steady growth, driven by an aging population increasingly susceptible to oral health issues and a growing preference for natural and organic oral care products.
Germany leads as a dominant country with a well-established oral care industry and high consumer awareness regarding dental hygiene. France is identified as the fast-growing market within Europe. This is propelled by the increased consumer demand for natural mouthwashes and a heightened focus on preventive oral care measures. The market is also witnessing a surge in innovative product offerings, including mouthwashes with multifunctional benefits such as whitening and enamel protection, catering to the evolving preferences of European consumers.
Asia Pacific Mouthwash Market Trends
Asia Pacific is poised for significant expansion, driven by rapid urbanization, rising disposable incomes, and emphasis on oral hygiene. China emerges as the dominant country, accounting for a substantial market share, supported by a large population base and growing awareness of oral health. India emerges to be the fast-growing market which is attributed to the heightened awareness of oral hygiene, government initiatives promoting dental care, and growing middle-income groups with a greater spending capacity. The region is also witnessing a shift towards herbal and traditional formulations, incorporating ingredients such as neem and clove, reflecting cultural preferences for natural remedies. The proliferation of online retail channels has enhanced product accessibility.
Competitive Landscape
The global mouthwash market is highly fragmented with numerous players competing across various segments. Companies are striving to strengthen their market position through strategic initiatives such as mergers, acquisitions, and partnerships. These efforts help them broaden their product portfolios and cater to evolving consumer preferences. Innovation remains a key focus, with brands frequently launching new formulations to meet demands for natural, alcohol-free, and therapeutic solutions. As competition intensifies firms enhance their distribution networks and invest in brand visibility to capture a large share.
Key Industry Developments:
- In January 2025, oral care brand Hismile broadened its innovative product lineup with the introduction of a flavor-centric Foam Mouthwash. The new range features four fruity flavors; Strawberry, Watermelon, Blue Raspberry, and Grape Bubblegum, offering a fun and refreshing twist to daily oral hygiene.
- In April 2025, Haleon, formerly part of GSK and Pfizer, announced a US$ 167 million investment in a global oral health innovation center in Weybridge, Surrey. Scheduled for completion in 2027, this 90,000 sq ft facility aims to enhance Haleon's R&D capabilities, particularly for brands like Sensodyne, Corsodyl, and Polident. This move underscores Haleon's commitment to advancing oral health solutions.
- In February 2024, Sensodyne, the oral care brand owned by Haleon (formerly GlaxoSmithKline Consumer Healthcare), announced the launch of its new product, Sensodyne Complete Protection + Mouthwash in the Indian oral care market.
Companies Covered in Mouthwash Market
- The Procter & Gamble Company
- Colgate-Palmolive
- GlaxoSmithKline plc
- Johnson & Johnson Services, Inc.
- Lion Corporation
- Tom’s of Maine
- Chattem Inc.
- Church & Dwight
- AMWAY
- SmartMouth Oral Health Laboratories
- Himalaya
- 3M
- Unilever
- Ambient Healthcare Pvt. Ltd.
- Kao Corporation
- Caldwell Consumer Health
- Dr. Harold Katz
- Sunstar Group
- Dentyl Active
- Jason Natural Care
- Lotus Brands Inc.
- Rowpar Pharmaceuticals Inc.
- Reckitt Benckiser Group Plc.
- Royal Philips N.V.
- Henkel AG & Co. KGaA
- Others
Frequently Asked Questions
The global market is estimated to increase from US$ 8.3 billion in 2025 to US$ 13.0 billion in 2032.
Rising dental issues, growing oral hygiene awareness, and dentist-recommended therapeutic solutions significantly drive the global mouthwash market.
The market is projected to record a CAGR of 6.5% during the forecast period from 2025 to 2032.
Expanding demand for natural products, innovation in flavors and functions, and increasing oral care adoption in emerging economies create key opportunities.
The Procter & Gamble Company, Colgate-Palmolive, GlaxoSmithKline plc, Johnson & Johnson Services, Inc., Lion Corporation, and Others.


