


- Executive Summary
- Global Managed Learning Services Market Snapshot 2026 and 2033
- Market Opportunity Assessment, 2026-2033, US$ Bn
- Key Market Trends
- Industry Developments and Key Market Events
- Demand Side and Supply-Side Analysis
- PMR Analysis and Recommendations
- Market Overview
- Market Scope and Definitions
- Value Chain Analysis
- Macro-Economic Factors
- Global GDP Outlook
- Global Healthcare Industry Overview
- Global Telecommunication Industry Overview
- Forecast Factors – Relevance and Impact
- COVID-19 Impact Assessment
- PESTLE Analysis
- Porter's Five Forces Analysis
- Geopolitical Tensions: Market Impact
- Regulatory and Technology Landscape
- Market Dynamics
- Drivers
- Restraints
- Opportunities
- Trends
- Price Trend Analysis, 2020 – 2033
- Region-wise Price Analysis
- Price by Segments
- Price Impact Factors
- Global Managed Learning Services Market Outlook: Historical (2020 – 2025) and Forecast (2026 – 2033)
- Key Highlights
- Global Managed Learning Services Market Outlook: Service
- Introduction/Key Findings
- Historical Market Size (US$ Bn) Analysis by Service, 2020-2025
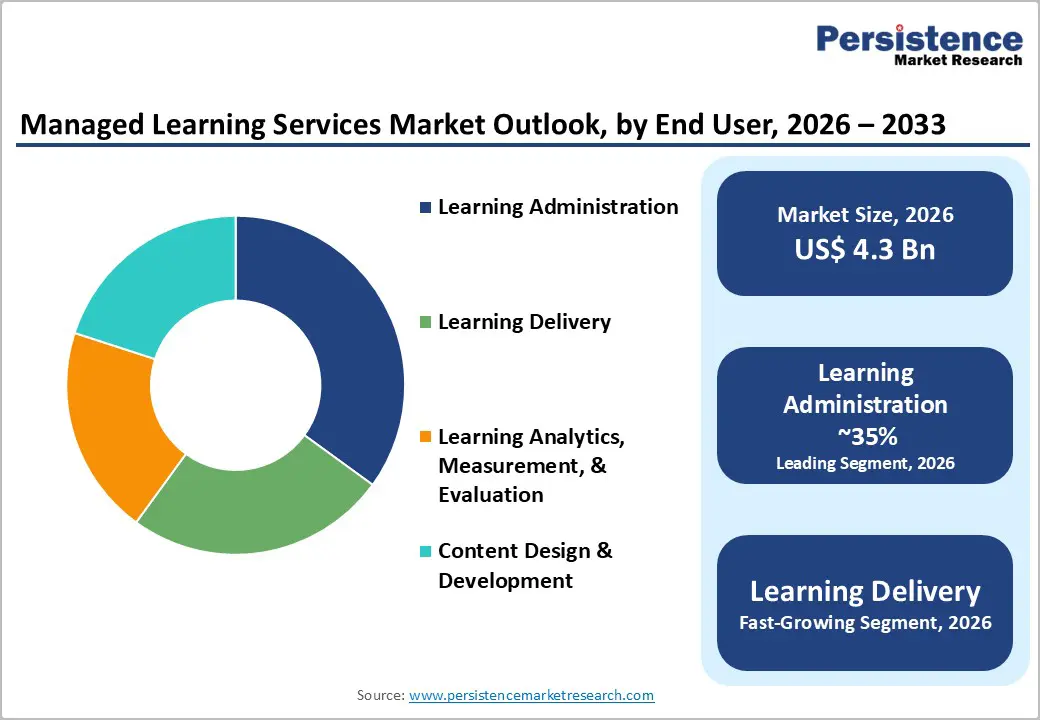
- Current Market Size (US$ Bn) Forecast, by Service, 2026-2033
- Learning Administration
- Learning Delivery
- Learning Analytics, Measurement, & Evaluation
- Content Design & Development
- Market Attractiveness Analysis: Service
- Global Managed Learning Services Market Outlook: Applications
- Introduction/Key Findings
- Historical Market Size (US$ Bn) Analysis by Applications, 2020-2025
- Current Market Size (US$ Bn) Forecast, by Applications, 2026-2033
- Small & Medium Enterprises (SMEs)
- Large Enterprises
- Market Attractiveness Analysis: Applications
- Global Managed Learning Services Market Outlook: End User
- Introduction/Key Findings
- Historical Market Size (US$ Bn) Analysis by End User, 2020-2025
- Current Market Size (US$ Bn) Forecast, by End User, 2026-2033
- BFSI
- Consumer Goods and Retail
- Telecommunication & IT
- Healthcare
- Manufacturing
- Market Attractiveness Analysis: End User
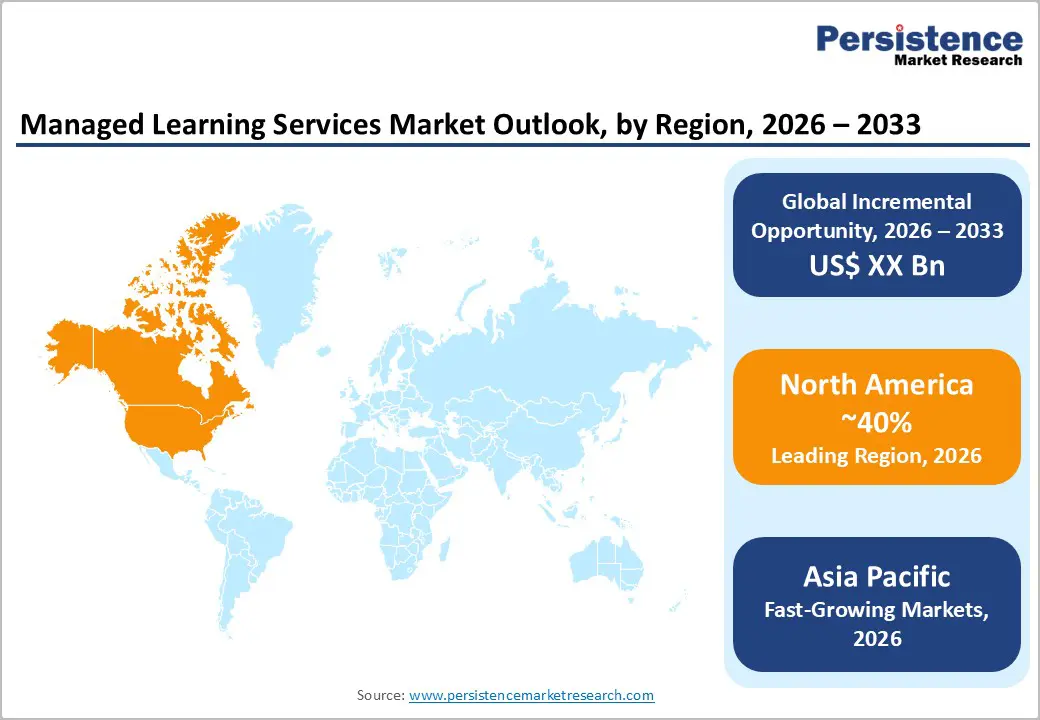
- Global Managed Learning Services Market Outlook: Region
- Key Highlights
- Historical Market Size (US$ Bn) Analysis by Region, 2020-2025
- Current Market Size (US$ Bn) Forecast, by Region, 2026-2033
- North America
- Europe
- East Asia
- South Asia & Oceania
- Latin America
- Middle East & Africa
- Market Attractiveness Analysis: Region
- North America Managed Learning Services Market Outlook: Historical (2020 – 2025) and Forecast (2026 – 2033)
- Key Highlights
- Pricing Analysis
- North America Market Size (US$ Bn) Forecast, by Country, 2026-2033
- U.S.
- Canada
- North America Market Size (US$ Bn) Forecast, by Service, 2026-2033
- Learning Administration
- Learning Delivery
- Learning Analytics, Measurement, & Evaluation
- Content Design & Development
- North America Market Size (US$ Bn) Forecast, by Applications, 2026-2033
- Small & Medium Enterprises (SMEs)
- Large Enterprises
- North America Market Size (US$ Bn) Forecast, by End User, 2026-2033
- BFSI
- Consumer Goods and Retail
- Telecommunication & IT
- Healthcare
- Manufacturing
- Europe Managed Learning Services Market Outlook: Historical (2020 – 2025) and Forecast (2026 – 2033)
- Key Highlights
- Pricing Analysis
- Europe Market Size (US$ Bn) Forecast, by Country, 2026-2033
- Germany
- Italy
- France
- U.K.
- Spain
- Russia
- Rest of Europe
- Europe Market Size (US$ Bn) Forecast, by Service, 2026-2033
- Learning Administration
- Learning Delivery
- Learning Analytics, Measurement, & Evaluation
- Content Design & Development
- Europe Market Size (US$ Bn) Forecast, by Applications, 2026-2033
- Small & Medium Enterprises (SMEs)
- Large Enterprises
- Europe Market Size (US$ Bn) Forecast, by End User, 2026-2033
- BFSI
- Consumer Goods and Retail
- Telecommunication & IT
- Healthcare
- Manufacturing
- East Asia Managed Learning Services Market Outlook: Historical (2020 – 2025) and Forecast (2026 – 2033)
- Key Highlights
- Pricing Analysis
- East Asia Market Size (US$ Bn) Forecast, by Country, 2026-2033
- China
- Japan
- South Korea
- East Asia Market Size (US$ Bn) Forecast, by Service, 2026-2033
- Learning Administration
- Learning Delivery
- Learning Analytics, Measurement, & Evaluation
- Content Design & Development
- East Asia Market Size (US$ Bn) Forecast, by Applications, 2026-2033
- Small & Medium Enterprises (SMEs)
- Large Enterprises
- East Asia Market Size (US$ Bn) Forecast, by End User, 2026-2033
- BFSI
- Consumer Goods and Retail
- Telecommunication & IT
- Healthcare
- Manufacturing
- South Asia & Oceania Managed Learning Services Market Outlook: Historical (2020 – 2025) and Forecast (2026 – 2033)
- Key Highlights
- Pricing Analysis
- South Asia & Oceania Market Size (US$ Bn) Forecast, by Country, 2026-2033
- India
- Southeast Asia
- ANZ
- Rest of SAO
- South Asia & Oceania Market Size (US$ Bn) Forecast, by Service, 2026-2033
- Learning Administration
- Learning Delivery
- Learning Analytics, Measurement, & Evaluation
- Content Design & Development
- South Asia & Oceania Market Size (US$ Bn) Forecast, by Applications, 2026-2033
- Small & Medium Enterprises (SMEs)
- Large Enterprises
- South Asia & Oceania Market Size (US$ Bn) Forecast, by End User, 2026-2033
- BFSI
- Consumer Goods and Retail
- Telecommunication & IT
- Healthcare
- Manufacturing
- Latin America Managed Learning Services Market Outlook: Historical (2020 – 2025) and Forecast (2026 – 2033)
- Key Highlights
- Pricing Analysis
- Latin America Market Size (US$ Bn) Forecast, by Country, 2026-2033
- Brazil
- Mexico
- Rest of LATAM
- Latin America Market Size (US$ Bn) Forecast, by Service, 2026-2033
- Learning Administration
- Learning Delivery
- Learning Analytics, Measurement, & Evaluation
- Content Design & Development
- Latin America Market Size (US$ Bn) Forecast, by Applications, 2026-2033
- Small & Medium Enterprises (SMEs)
- Large Enterprises
- Latin America Market Size (US$ Bn) Forecast, by End User, 2026-2033
- BFSI
- Consumer Goods and Retail
- Telecommunication & IT
- Healthcare
- Manufacturing
- Middle East & Africa Managed Learning Services Market Outlook: Historical (2020 – 2025) and Forecast (2026 – 2033)
- Key Highlights
- Pricing Analysis
- Middle East & Africa Market Size (US$ Bn) Forecast, by Country, 2026-2033
- GCC Countries
- South Africa
- Northern Africa
- Rest of MEA
- Middle East & Africa Market Size (US$ Bn) Forecast, by Service, 2026-2033
- Learning Administration
- Learning Delivery
- Learning Analytics, Measurement, & Evaluation
- Content Design & Development
- Middle East & Africa Market Size (US$ Bn) Forecast, by Applications, 2026-2033
- Small & Medium Enterprises (SMEs)
- Large Enterprises
- Middle East & Africa Market Size (US$ Bn) Forecast, by End User, 2026-2033
- BFSI
- Consumer Goods and Retail
- Telecommunication & IT
- Healthcare
- Manufacturing
- Competition Landscape
- Market Share Analysis, 2025
- Market Structure
- Competition Intensity Mapping
- Competition Dashboard
- Company Profiles
- GP Strategies Corporation
- Company Overview
- Product Portfolio/Offerings
- Key Financials
- SWOT Analysis
- Company Strategy and Key Developments
- Learning Tree International, Inc.
- Infopro Learning, Inc.
- Hemsley Fraser Group Ltd.
- G-Cube
- TTA (The Training Associates)
- KnowledgePool
- NIIT
- DDLS Australia Pty Ltd.
- NetCom Learning
- KPMG
- GP Strategies Corporation
- Appendix
- Research Methodology
- Research Assumptions
- Acronyms and Abbreviations

Loading page data
Please wait a moment


