


- Executive Summary
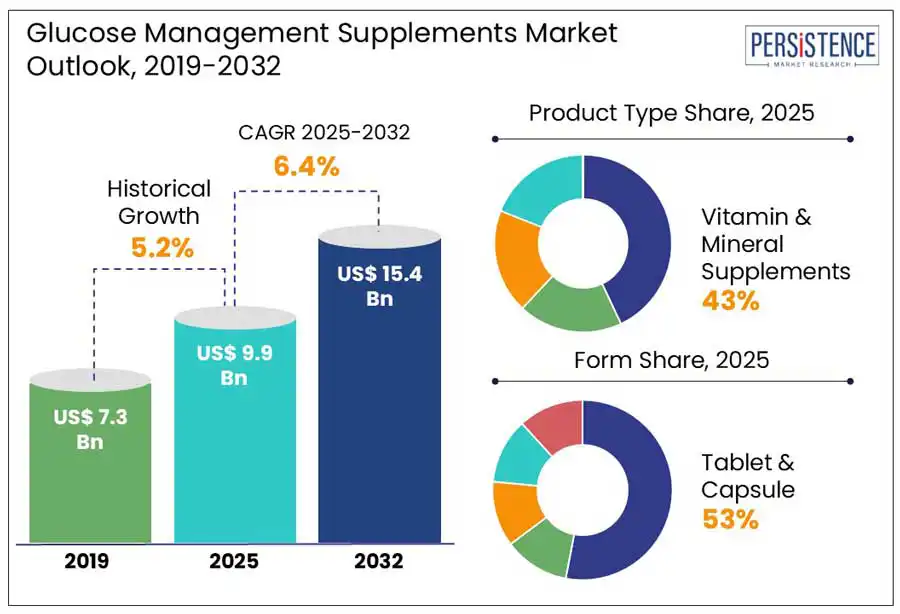
- Global Glucose Management Supplements Market Snapshot, 2025 and 2032
- Market Opportunity Assessment, 2025 - 2032, US$ Bn
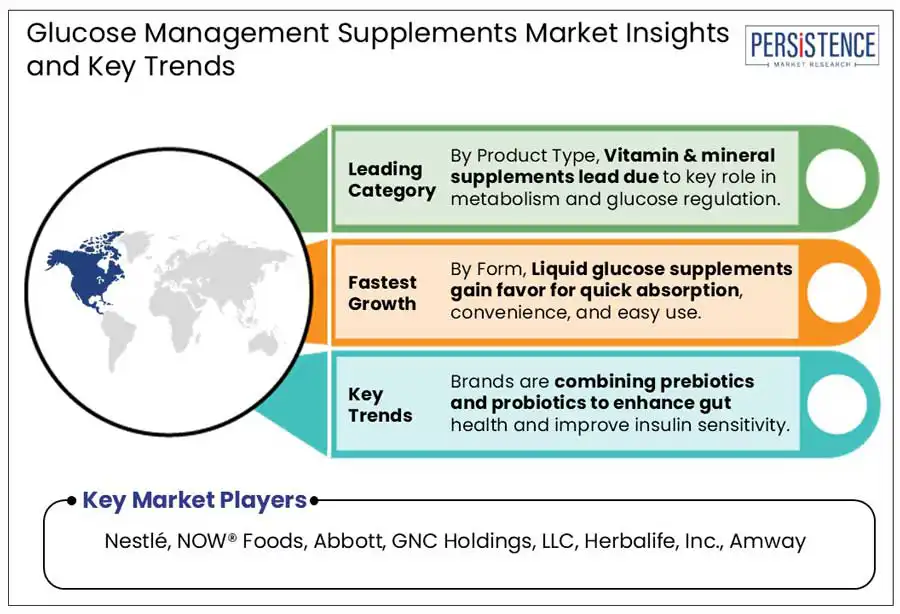
- Key Market Trends
- Future Market Projections
- Premium Market Insights
- Industry Developments and Key Market Events
- PMR Analysis and Recommendations
- Market Overview
- Market Scope and Definition
- Market Dynamics
- Drivers
- Restraints
- Opportunity
- Challenges
- Key Trends
- COVID-19 Impact Analysis
- Forecast Factors - Relevance and Impact
- Value Added Insights
- Value Chain Analysis
- Key Market Players
- Regulatory Landscape
- PESTLE Analysis
- Porter’s Five Force Analysis
- Consumer Behavior Analysis
- Price Trend Analysis, 2019 - 2032
- Key Factors Impacting Product Prices
- Pricing Analysis, By Product Type/ Form
- Regional Prices and Product Preferences
- Global Glucose Management Supplements Market Outlook
- Market Size (US$ Bn) Analysis and Forecast
- Historical Market Size (US$ Bn) Analysis, 2019-2024
- Market Size (US$ Bn) Analysis and Forecast, 2025-2032
- Global Glucose Management Supplements Market Outlook: Product Type
- Historical Market Size (US$ Bn) Analysis, By Product Type, 2019-2024
- Market Size (US$ Bn) Analysis and Forecast, By Product Type, 2025-2032
- Vitamin & Mineral Supplements
- Proteins & Amino Acids Supplements
- Herbal Supplements
- Others
- Market Attractiveness Analysis: Product Type
- Global Glucose Management Supplements Market Outlook: Form
- Historical Market Size (US$ Bn) Analysis, By Form, 2019-2024
- Market Size (US$ Bn) Analysis and Forecast, By Form, 2025-2032
- Tablet & Capsule
- Soft gels
- Powder
- Liquid
- Others
- Market Attractiveness Analysis: Form
- Global Glucose Management Supplements Market Outlook: Sales Channel
- Historical Market Size (US$ Bn) Analysis, By Sales Channel, 2019-2024
- Market Size (US$ Bn) Analysis and Forecast, By Sales Channel, 2025-2032
- Food & Beverages
- Hypermarkets/Supermarkets
- Hospitals & Clinics
- Pharmacy & Drug Stores
- Specialty Wellness Stores
- Online Retail
- Others
- Market Attractiveness Analysis: Sales Channel
- Market Size (US$ Bn) Analysis and Forecast
- Global Glucose Management Supplements Market Outlook: Region
- Historical Market Size (US$ Bn) Analysis, By Region, 2019-2024
- Market Size (US$ Bn) Analysis and Forecast, By Region, 2025-2032
- North America
- Latin America
- Europe
- East Asia
- South Asia and Oceania
- Middle East & Africa
- Market Attractiveness Analysis: Region
- North America Glucose Management Supplements Market Outlook
- Historical Market Size (US$ Bn) Analysis, By Market, 2019-2024
- By Country
- By Product Type
- By Form
- By Sales Channel
- Market Size (US$ Bn) Analysis and Forecast, By Country, 2025-2032
- U.S.
- Canada
- Market Size (US$ Bn) Analysis and Forecast, By Product Type, 2025-2032
- Vitamin & Mineral Supplements
- Proteins & Amino Acids Supplements
- Herbal Supplements
- Others
- Market Size (US$ Bn) Analysis and Forecast, By Form, 2025-2032
- Tablet & Capsule
- Soft gels
- Powder
- Liquid
- Others
- Market Size (US$ Bn) Analysis and Forecast, By Sales Channel, 2025-2032
- Hypermarkets/Supermarkets
- Hospitals & Clinics
- Pharmacy & Drug Stores
- Specialty Wellness Stores
- Online Retail
- Others
- Market Attractiveness Analysis
- Historical Market Size (US$ Bn) Analysis, By Market, 2019-2024
- Europe Glucose Management Supplements Market Outlook
- Historical Market Size (US$ Bn) Analysis, By Market, 2019-2024
- By Country
- By Product Type
- By Form
- By Sales Channel
- Market Size (US$ Bn) Analysis and Forecast, By Country, 2025-2032
- Germany
- France
- U.K.
- Italy
- Spain
- Russia
- Rest of Europe
- Market Size (US$ Bn) Analysis and Forecast, By Product Type, 2025-2032
- Vitamin & Mineral Supplements
- Proteins & Amino Acids Supplements
- Herbal Supplements
- Others
- Market Size (US$ Bn) Analysis and Forecast, By Form, 2025-2032
- Tablet & Capsule
- Soft gels
- Powder
- Liquid
- Others
- Market Size (US$ Bn) Analysis and Forecast, By Sales Channel, 2025-2032
- Hypermarkets/Supermarkets
- Hospitals & Clinics
- Pharmacy & Drug Stores
- Specialty Wellness Stores
- Online Retail
- Others
- Market Attractiveness Analysis
- Historical Market Size (US$ Bn) Analysis, By Market, 2019-2024
- East Asia Glucose Management Supplements Market Outlook
- Historical Market Size (US$ Bn) Analysis, By Market, 2019-2024
- By Country
- By Product Type
- By Form
- By Sales Channel
- Market Size (US$ Bn) Analysis and Forecast, By Country, 2025-2032
- China
- Japan
- South Korea
- Market Size (US$ Bn) Analysis and Forecast, By Product Type, 2025-2032
- Vitamin & Mineral Supplements
- Proteins & Amino Acids Supplements
- Herbal Supplements
- Others
- Market Size (US$ Bn) Analysis and Forecast, By Form, 2025-2032
- Tablet & Capsule
- Soft gels
- Powder
- Liquid
- Others
- Market Size (US$ Bn) Analysis and Forecast, By Sales Channel, 2025-2032
- Hypermarkets/Supermarkets
- Hospitals & Clinics
- Pharmacy & Drug Stores
- Specialty Wellness Stores
- Online Retail
- Others
- Market Attractiveness Analysis
- Historical Market Size (US$ Bn) Analysis, By Market, 2019-2024
- South Asia & Oceania Glucose Management Supplements Market Outlook
- Historical Market Size (US$ Bn) Analysis, By Market, 2019-2024
- By Country
- By Product Type
- By Form
- By Sales Channel
- Market Size (US$ Bn) Analysis and Forecast, By Country, 2025-2032
- India
- Indonesia
- Thailand
- Singapore
- ANZ
- Rest of South Asia & Oceania
- Market Size (US$ Bn) Analysis and Forecast, By Product Type, 2025-2032
- Vitamin & Mineral Supplements
- Proteins & Amino Acids Supplements
- Herbal Supplements
- Others
- Market Size (US$ Bn) Analysis and Forecast, By Form, 2025-2032
- Tablet & Capsule
- Soft gels
- Powder
- Liquid
- Others
- Market Size (US$ Bn) Analysis and Forecast, By Sales Channel, 2025-2032
- Hypermarkets/Supermarkets
- Hospitals & Clinics
- Pharmacy & Drug Stores
- Specialty Wellness Stores
- Online Retail
- Others
- Market Attractiveness Analysis
- Historical Market Size (US$ Bn) Analysis, By Market, 2019-2024
- Latin America Glucose Management Supplements Market Outlook
- Historical Market Size (US$ Bn) Analysis, By Market, 2019-2024
- By Country
- By Product Type
- By Form
- By Sales Channel
- Market Size (US$ Bn) Analysis and Forecast, By Country, 2025-2032
- Brazil
- Mexico
- Rest of Latin America
- Market Size (US$ Bn) Analysis and Forecast, By Product Type, 2025-2032
- Vitamin & Mineral Supplements
- Proteins & Amino Acids Supplements
- Herbal Supplements
- Others
- Market Size (US$ Bn) Analysis and Forecast, By Form, 2025-2032
- Tablet & Capsule
- Soft gels
- Powder
- Liquid
- Others
- Market Size (US$ Bn) Analysis and Forecast, By Sales Channel, 2025-2032
- Hypermarkets/Supermarkets
- Hospitals & Clinics
- Pharmacy & Drug Stores
- Specialty Wellness Stores
- Online Retail
- Others
- Market Attractiveness Analysis
- Historical Market Size (US$ Bn) Analysis, By Market, 2019-2024
- Middle East & Africa Glucose Management Supplements Market Outlook
- Historical Market Size (US$ Bn) Analysis, By Market, 2019-2024
- By Country
- By Product Type
- By Form
- By Sales Channel
- Market Size (US$ Bn) Analysis and Forecast, By Country, 2025-2032
- GCC Countries
- Egypt
- South Africa
- Northern Africa
- Rest of Middle East & Africa
- Market Size (US$ Bn) Analysis and Forecast, By Product Type, 2025-2032
- Vitamin & Mineral Supplements
- Proteins & Amino Acids Supplements
- Herbal Supplements
- Others
- Market Size (US$ Bn) Analysis and Forecast, By Form, 2025-2032
- Tablet & Capsule
- Soft gels
- Powder
- Liquid
- Others
- Market Size (US$ Bn) Analysis and Forecast, By Sales Channel, 2025-2032
- Hypermarkets/Supermarkets
- Hospitals & Clinics
- Pharmacy & Drug Stores
- Specialty Wellness Stores
- Online Retail
- Others
- Market Attractiveness Analysis
- Historical Market Size (US$ Bn) Analysis, By Market, 2019-2024
- Competition Landscape
- Market Share Analysis, 2024
- Market Structure
- Competition Intensity Mapping By Market
- Competition Dashboard
- Company Profiles (Details - Overview, Financials, Strategy, Recent Developments)
- Nestlé
- Overview
- Segments and Product Type
- Key Financials
- Market Developments
- Market Strategy
- NOW® Foods
- Abbott
- Life Extension
- Nutri Advanced Ltd
- Vitabiotics Ltd.
- Naturecan
- GNC Holdings, LLC
- Pharmavite LLC
- Nature's Way Brands, LLC
- Dr. Reddy’s Laboratories Ltd.
- Jarrow Formulas, Inc.
- Herbalife, Inc.
- Amway
- Gaia Herbs
- Sigrid Therapeutics AB
- HealthyCell
- Others
- Nestlé
- Appendix
- Research Methodology
- Research Assumptions
- Acronyms and Abbreviations

Loading page data
Please wait a moment


