


- Executive Summary
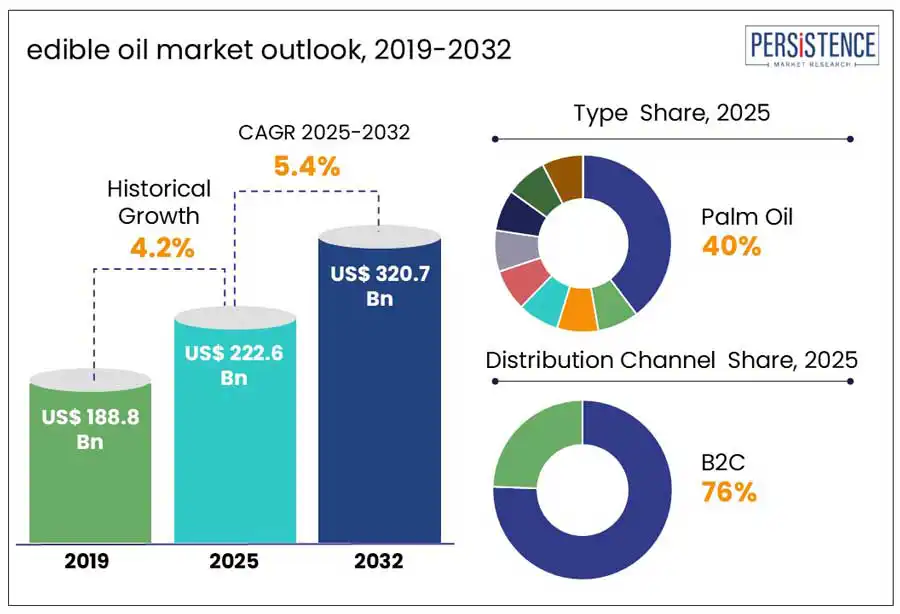
- Global Edible Oil Market Snapshot 2025 and 2032
- Market Opportunity Assessment, 2025-2032, US$ Bn
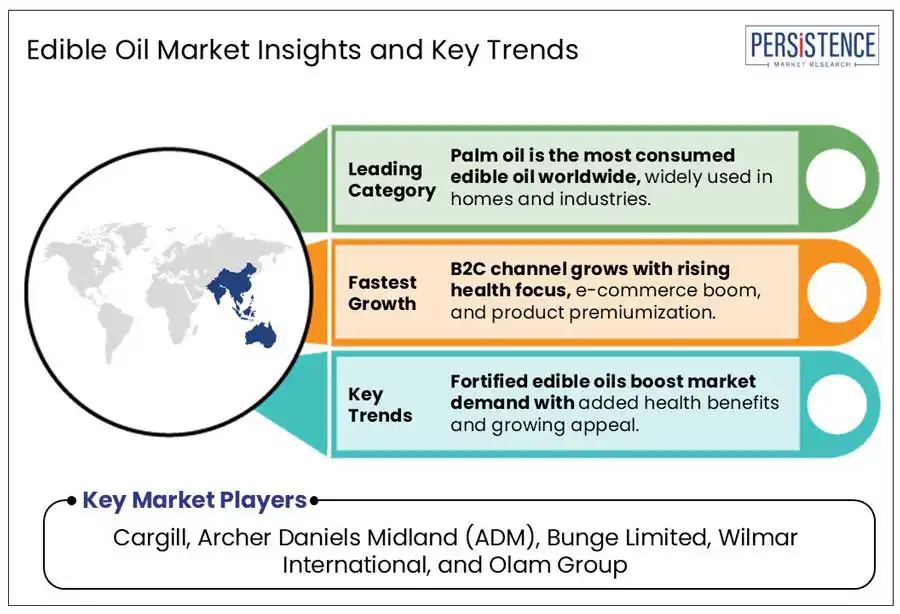
- Key Market Trends
- Industry Developments and Key Market Events
- Demand Side and Supply Side Analysis
- PMR Analysis and Recommendations
- Market Overview
- Market Scope and Definitions
- Value Chain Analysis
- Macro-Economic Factors
- Global GDP Outlook
- Global Food Industry Overview
- Global GDP Overview
- Forecast Factors – Relevance and Impact
- COVID-19 Impact Assessment
- PESTLE Analysis
- Porter's Five Forces Analysis
- Geopolitical Tensions: Market Impact
- Regulatory and Technology Landscape
- Market Dynamics
- Drivers
- Restraints
- Opportunities
- Trends
- Price Trend Analysis, 2019 – 2032
- Region-wise Price Analysis
- Price by Segments
- Price Impact Factors
- Global Edible Oil Market Outlook: Historical (2019 – 2024) and Forecast (2025 – 2032)
- Key Highlights
- Global Edible Oil Market Outlook: Type
- Introduction/Key Findings
- Historical Market Size (US$ Bn) and Volume (Metric Tons) Analysis by Type, 2019-2024
- Current Market Size (US$ Bn) and Volume (Metric Tons) Forecast, by Type, 2025-2032
- Palm oil
- Sunflower oil
- Groundnut oil
- Rapeseed oil
- Mustard oil
- Olive oil
- Coconut oil
- Sesame oil
- Others
- Market Attractiveness Analysis: Type
- Global Edible Oil Market Outlook: Packaging Type
- Introduction/Key Findings
- Historical Market Size (US$ Bn) and Volume (Metric Tons) Analysis by Packaging Type, 2019-2024
- Current Market Size (US$ Bn) and Volume (Metric Tons) Forecast, by Packaging Type, 2025-2032
- Pouches
- Jars
- Cans
- Bottles
- Market Attractiveness Analysis: Packaging Type
- Global Edible Oil Market Outlook: Distribution Channel
- Introduction/Key Findings
- Historical Market Size (US$ Bn) and Volume (Metric Tons) Analysis by Distribution Channel, 2019-2024
- Current Market Size (US$ Bn) and Volume (Metric Tons) Forecast, by Distribution Channel, 2025-2032
- B2B
- B2C
- Market Attractiveness Analysis: Distribution Channel
- Global Edible Oil Market Outlook: Processing Type
- Introduction/Key Findings
- Historical Market Size (US$ Bn) and Volume (Metric Tons) Analysis by Processing Type, 2019-2024
- Current Market Size (US$ Bn) and Volume (Metric Tons) Forecast, by Processing Type, 2025-2032
- Refined
- Cold-pressed
- Market Attractiveness Analysis: Processing Type
- Global Edible Oil Market Outlook: End-User
- Introduction/Key Findings
- Historical Market Size (US$ Bn) and Volume (Metric Tons) Analysis by End-User , 2019-2024
- Current Market Size (US$ Bn) and Volume (Metric Tons) Forecast, by End-User , 2025-2032
- Food sevice
- household retail
- industrial
- Market Attractiveness Analysis: End-User
- Global Edible Oil Market Outlook: Region
- Key Highlights
- Historical Market Size (US$ Bn) and Volume (Metric Tons) Analysis by Region, 2019-2024
- Current Market Size (US$ Bn) and Volume (Metric Tons) Forecast, by Region, 2025-2032
- North America
- Europe
- East Asia
- South Asia & Oceania
- Latin America
- Middle East & Africa
- Market Attractiveness Analysis: Region
- North America Edible Oil Market Outlook: Historical (2019 – 2024) and Forecast (2025 – 2032)
- Key Highlights
- Pricing Analysis
- North America Market Size (US$ Bn) and Volume (Metric Tons) Forecast, by Country, 2025-2032
- U.S.
- Canada
- North America Market Size (US$ Bn) and Volume (Metric Tons) Forecast, by Type, 2025-2032
- Palm oil
- Sunflower oil
- Groundnut oil
- Rapeseed oil
- Mustard oil
- Olive oil
- Coconut oil
- Sesame oil
- Others
- North America Market Size (US$ Bn) and Volume (Metric Tons) Forecast, by Packaging Type, 2025-2032
- Pouches
- Jars
- Cans
- Bottles
- North America Market Size (US$ Bn) and Volume (Metric Tons) Forecast, by Distribution Channel, 2025-2032
- B2B
- B2C
- North America Market Size (US$ Bn) and Volume (Metric Tons) Forecast, by Processing Type, 2025-2032
- Refined
- Cold-pressed
- North America Market Size (US$ Bn) and Volume (Metric Tons) Forecast, by End-User , 2025-2032
- Food sevice
- household retail
- industrial
- Europe Edible Oil Market Outlook: Historical (2019 – 2024) and Forecast (2025 – 2032)
- Key Highlights
- Pricing Analysis
- Europe Market Size (US$ Bn) and Volume (Metric Tons) Forecast, by Country, 2025-2032
- Germany
- Italy
- France
- U.K.
- Spain
- Russia
- Rest of Europe
- Europe Market Size (US$ Bn) and Volume (Metric Tons) Forecast, by Type, 2025-2032
- Palm oil
- Sunflower oil
- Groundnut oil
- Rapeseed oil
- Mustard oil
- Olive oil
- Coconut oil
- Sesame oil
- Others
- Europe Market Size (US$ Bn) and Volume (Metric Tons) Forecast, by Packaging Type, 2025-2032
- Pouches
- Jars
- Cans
- Bottles
- Europe Market Size (US$ Bn) and Volume (Metric Tons) Forecast, by Distribution Channel, 2025-2032
- B2B
- B2C
- Europe Market Size (US$ Bn) and Volume (Metric Tons) Forecast, by Processing Type, 2025-2032
- Refined
- Cold-pressed
- Europe Market Size (US$ Bn) and Volume (Metric Tons) Forecast, by End-User , 2025-2032
- Food sevice
- household retail
- industrial
- East Asia Edible Oil Market Outlook: Historical (2019 – 2024) and Forecast (2025 – 2032)
- Key Highlights
- Pricing Analysis
- East Asia Market Size (US$ Bn) and Volume (Metric Tons) Forecast, by Country, 2025-2032
- China
- Japan
- South Korea
- East Asia Market Size (US$ Bn) and Volume (Metric Tons) Forecast, by Type, 2025-2032
- Palm oil
- Sunflower oil
- Groundnut oil
- Rapeseed oil
- Mustard oil
- Olive oil
- Coconut oil
- Sesame oil
- Others
- East Asia Market Size (US$ Bn) and Volume (Metric Tons) Forecast, by Packaging Type, 2025-2032
- Pouches
- Jars
- Cans
- Bottles
- East Asia Market Size (US$ Bn) and Volume (Metric Tons) Forecast, by Distribution Channel, 2025-2032
- B2B
- B2C
- East Asia Market Size (US$ Bn) and Volume (Metric Tons) Forecast, by Processing Type, 2025-2032
- Refined
- Cold-pressed
- East Asia Market Size (US$ Bn) and Volume (Metric Tons) Forecast, by End-User , 2025-2032
- Food sevice
- household retail
- industrial
- South Asia & Oceania Edible Oil Market Outlook: Historical (2019 – 2024) and Forecast (2025 – 2032)
- Key Highlights
- Pricing Analysis
- South Asia & Oceania Market Size (US$ Bn) and Volume (Metric Tons) Forecast, by Country, 2025-2032
- India
- Southeast Asia
- ANZ
- Rest of SAO
- South Asia & Oceania Market Size (US$ Bn) and Volume (Metric Tons) Forecast, by Type, 2025-2032
- Palm oil
- Sunflower oil
- Groundnut oil
- Rapeseed oil
- Mustard oil
- Olive oil
- Coconut oil
- Sesame oil
- Others
- South Asia & Oceania Market Size (US$ Bn) and Volume (Metric Tons) Forecast, by Packaging Type, 2025-2032
- Pouches
- Jars
- Cans
- Bottles
- South Asia & Oceania Market Size (US$ Bn) and Volume (Metric Tons) Forecast, by Distribution Channel, 2025-2032
- B2B
- B2C
- South Asia & Oceania Market Size (US$ Bn) and Volume (Metric Tons) Forecast, by Processing Type, 2025-2032
- Refined
- Cold-pressed
- South Asia & Oceania Market Size (US$ Bn) and Volume (Metric Tons) Forecast, by End-User , 2025-2032
- Food sevice
- household retail
- industrial
- Latin America Edible Oil Market Outlook: Historical (2019 – 2024) and Forecast (2025 – 2032)
- Key Highlights
- Pricing Analysis
- Latin America Market Size (US$ Bn) and Volume (Metric Tons) Forecast, by Country, 2025-2032
- Brazil
- Mexico
- Rest of LATAM
- Latin America Market Size (US$ Bn) and Volume (Metric Tons) Forecast, by Type, 2025-2032
- Palm oil
- Sunflower oil
- Groundnut oil
- Rapeseed oil
- Mustard oil
- Olive oil
- Coconut oil
- Sesame oil
- Others
- Latin America Market Size (US$ Bn) and Volume (Metric Tons) Forecast, by Packaging Type, 2025-2032
- Pouches
- Jars
- Cans
- Bottles
- Latin America Market Size (US$ Bn) and Volume (Metric Tons) Forecast, by Distribution Channel, 2025-2032
- B2B
- B2C
- Latin America Market Size (US$ Bn) and Volume (Metric Tons) Forecast, by Processing Type, 2025-2032
- Refined
- Cold-pressed
- Latin America Market Size (US$ Bn) and Volume (Metric Tons) Forecast, by End-User , 2025-2032
- Food sevice
- household retail
- industrial
- Middle East & Africa Edible Oil Market Outlook: Historical (2019 – 2024) and Forecast (2025 – 2032)
- Key Highlights
- Pricing Analysis
- Middle East & Africa Market Size (US$ Bn) and Volume (Metric Tons) Forecast, by Country, 2025-2032
- GCC Countries
- South Africa
- Northern Africa
- Rest of MEA
- Middle East & Africa Market Size (US$ Bn) and Volume (Metric Tons) Forecast, by Type, 2025-2032
- Palm oil
- Sunflower oil
- Groundnut oil
- Rapeseed oil
- Mustard oil
- Olive oil
- Coconut oil
- Sesame oil
- Others
- Middle East & Africa Market Size (US$ Bn) and Volume (Metric Tons) Forecast, by Packaging Type, 2025-2032
- Pouches
- Jars
- Cans
- Bottles
- Middle East & Africa Market Size (US$ Bn) and Volume (Metric Tons) Forecast, by Distribution Channel, 2025-2032
- B2B
- B2C
- Middle East & Africa Market Size (US$ Bn) and Volume (Metric Tons) Forecast, by Processing Type, 2025-2032
- Refined
- Cold-pressed
- Middle East & Africa Market Size (US$ Bn) and Volume (Metric Tons) Forecast, by End-User , 2025-2032
- Food sevice
- household retail
- industrial
- Competition Landscape
- Market Share Analysis, 2024
- Market Structure
- Competition Intensity Mapping
- Competition Dashboard
- Company Profiles
- Cargill, Incorporated
- Company Overview
- Product Portfolio/Offerings
- Key Financials
- SWOT Analysis
- Company Strategy and Key Developments
- ADM
- FUJI OIL CO., LTD
- Wilmar International Ltd
- CJ Cheiljedang Corporation
- Bunge
- IFFCO Group
- OTTOGI CORP.
- Olam Agri Holdings Pte Ltd.
- Marico
- Cargill, Incorporated
- Appendix
- Research Methodology
- Research Assumptions
- Acronyms and Abbreviations

Loading page data
Please wait a moment


