


- Executive Summary
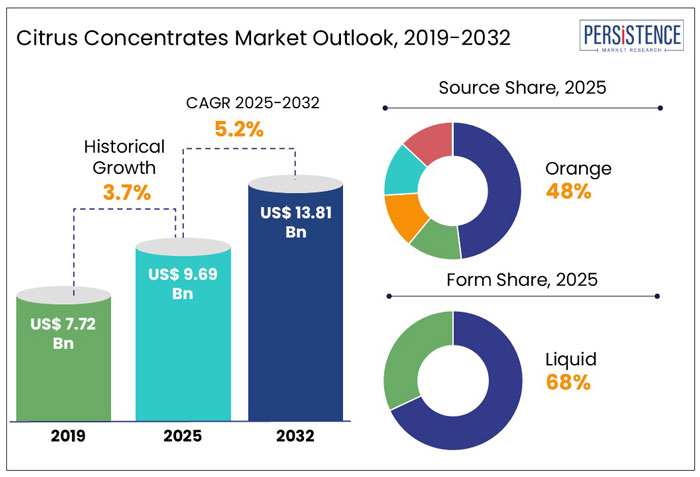
- Global Citrus Concentrate Market Snapshot, 2025 and 2032
- Market Opportunity Assessment, 2025 - 2032, US$ Mn
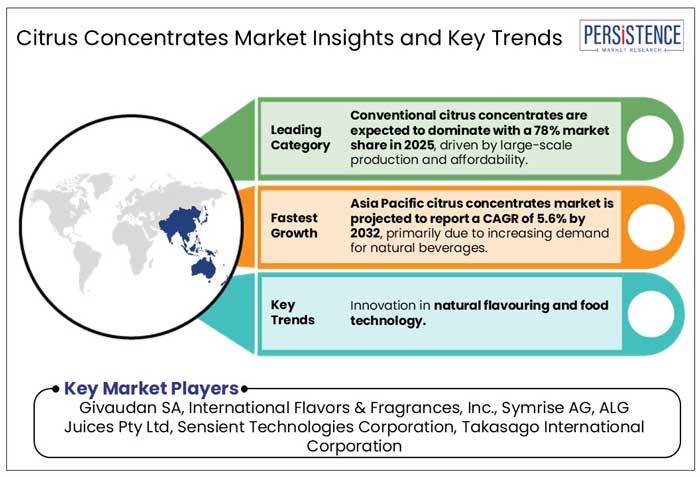
- Key Market Trends
- Future Market Projections
- Premium Market Insights
- Industry Developments and Key Market Events
- PMR Analysis and Recommendations
- Market Overview
- Market Scope and Definition
- Market Dynamics
- Drivers
- Restraints
- Opportunity
- Challenges
- Key Trends
- COVID-19 Impact Analysis
- Forecast Factors - Relevance and Impact
- Value Added Insights
- Value Chain Analysis
- Key Market Players
- Regulatory Landscape
- PESTLE Analysis
- Porter’s Five Force Analysis
- Consumer Behavior Analysis
- Price Trend Analysis, 2019 - 2032
- Key Factors Impacting Product Prices
- Pricing Analysis, By Source
- Regional Prices and Product Preferences
- Global Citrus Concentrate Market Outlook
- Key Highlights
- Market Volume (Tons) Projections
- Market Size (US$ Mn) and Y-o-Y Growth
- Absolute $ Opportunity
- Market Size (US$ Mn) Analysis and Forecast
- Historical Market Size (US$ Mn) Analysis, 2019-2024
- Current Market Size (US$ Mn) Analysis and Forecast, 2025-2032
- Global Citrus Concentrate Market Outlook: Source
- Historical Market Size (US$ Mn) and Volume (Tons) Analysis, By Source, 2019-2024
- Current Market Size (US$ Mn) and Volume (Tons) Analysis and Forecast, By Source, 2025-2032
- Orange
- Lemon & Lime
- Grapefruit
- Tangerine
- Others
- Market Attractiveness Analysis: Source
- Global Citrus Concentrate Market Outlook: Nature
- Historical Market Size (US$ Mn) and Volume (Tons) Analysis, By Nature, 2019-2024
- Current Market Size (US$ Mn) and Volume (Tons) Analysis and Forecast, By Nature, 2025-2032
- Organic
- Conventional
- Market Attractiveness Analysis: Nature
- Global Citrus Concentrate Market Outlook: Form
- Historical Market Size (US$ Mn) and Volume (Tons) Analysis, By Form, 2019-2024
- Current Market Size (US$ Mn) and Volume (Tons) Analysis and Forecast, By Form, 2025-2032
- Dry
- Liquid
- Market Attractiveness Analysis: Form
- Global Citrus Concentrate Market Outlook: End Use
- Historical Market Size (US$ Mn) and Volume (Tons) Analysis, By End Use, 2019-2024
- Current Market Size (US$ Mn) and Volume (Tons) Analysis and Forecast, By End Use, 2025-2032
- Food & Beverage Industry
- Bakery & Confectionery
- Dairy & Dessert
- Alcoholic Beverages
- Non-Alcoholic Beverages
- Pharmaceuticals
- Nutraceuticals
- Personal Care & Cosmetics
- Others
- Food & Beverage Industry
- Market Attractiveness Analysis: End Use
- Key Highlights
- Global Citrus Concentrate Market Outlook: Region
- Historical Market Size (US$ Mn) and Volume (Tons) Analysis, By Region, 2019-2024
- Current Market Size (US$ Mn) and Volume (Tons) Analysis and Forecast, By Region, 2025-2032
- North America
- Latin America
- Europe
- East Asia
- South Asia and Oceania
- Middle East & Africa
- Market Attractiveness Analysis: Region
- North America Citrus Concentrate Market Outlook
- Historical Market Size (US$ Mn) and Volume (Tons) Analysis, By Market, 2019-2024
- By Country
- By Source
- By Nature
- By Form
- By End Use
- Current Market Size (US$ Mn) and Volume (Tons) Analysis and Forecast, By Country, 2025-2032
- U.S.
- Canada
- Current Market Size (US$ Mn) and Volume (Tons) Analysis and Forecast, By Source, 2025-2032
- Orange
- Lemon & Lime
- Grapefruit
- Tangerine
- Others
- Current Market Size (US$ Mn) and Volume (Tons) Analysis and Forecast, By Nature, 2025-2032
- Organic
- Conventional
- Current Market Size (US$ Mn) and Volume (Tons) Analysis and Forecast, By Form, 2025-2032
- Dry
- Liquid
- Current Market Size (US$ Mn) and Volume (Tons) Analysis and Forecast, By End Use, 2025-2032
- Food & Beverage Industry
- Bakery & Confectionery
- Dairy & Dessert
- Alcoholic Beverages
- Non-Alcoholic Beverages
- Pharmaceuticals
- Nutraceuticals
- Personal Care & Cosmetics
- Others
- Food & Beverage Industry
- Market Attractiveness Analysis
- Historical Market Size (US$ Mn) and Volume (Tons) Analysis, By Market, 2019-2024
- Europe Citrus Concentrate Market Outlook
- Historical Market Size (US$ Mn) and Volume (Tons) Analysis, By Market, 2019-2024
- By Country
- By Source
- By Nature
- By Form
- By End Use
- Current Market Size (US$ Mn) and Volume (Tons) Analysis and Forecast, By Country, 2025-2032
- Germany
- France
- U.K.
- Italy
- Spain
- Russia
- Rest of Europe
- Current Market Size (US$ Mn) and Volume (Tons) Analysis and Forecast, By Source, 2025-2032
- Orange
- Lemon & Lime
- Grapefruit
- Tangerine
- Others
- Current Market Size (US$ Mn) and Volume (Tons) Analysis and Forecast, By Nature, 2025-2032
- Organic
- Conventional
- Current Market Size (US$ Mn) and Volume (Tons) Analysis and Forecast, By Form, 2025-2032
- Dry
- Liquid
- Current Market Size (US$ Mn) and Volume (Tons) Analysis and Forecast, By End Use, 2025-2032
- Food & Beverage Industry
- Bakery & Confectionery
- Dairy & Dessert
- Alcoholic Beverages
- Non-Alcoholic Beverages
- Pharmaceuticals
- Nutraceuticals
- Personal Care & Cosmetics
- Others
- Food & Beverage Industry
- Market Attractiveness Analysis
- Historical Market Size (US$ Mn) and Volume (Tons) Analysis, By Market, 2019-2024
- East Asia Citrus Concentrate Market Outlook
- Historical Market Size (US$ Mn) and Volume (Tons) Analysis, By Market, 2019-2024
- By Country
- By Source
- By Nature
- By Form
- By End Use
- Current Market Size (US$ Mn) and Volume (Tons) Analysis and Forecast, By Country, 2025-2032
- China
- Japan
- South Korea
- Current Market Size (US$ Mn) and Volume (Tons) Analysis and Forecast, By Source, 2025-2032
- Orange
- Lemon & Lime
- Grapefruit
- Tangerine
- Others
- Current Market Size (US$ Mn) and Volume (Tons) Analysis and Forecast, By Nature, 2025-2032
- Organic
- Conventional
- Current Market Size (US$ Mn) and Volume (Tons) Analysis and Forecast, By Form, 2025-2032
- Dry
- Liquid
- Current Market Size (US$ Mn) and Volume (Tons) Analysis and Forecast, By End Use, 2025-2032
- Food & Beverage Industry
- Bakery & Confectionery
- Dairy & Dessert
- Alcoholic Beverages
- Non-Alcoholic Beverages
- Pharmaceuticals
- Nutraceuticals
- Personal Care & Cosmetics
- Others
- Food & Beverage Industry
- Market Attractiveness Analysis
- Historical Market Size (US$ Mn) and Volume (Tons) Analysis, By Market, 2019-2024
- South Asia & Oceania Citrus Concentrate Market Outlook
- Historical Market Size (US$ Mn) and Volume (Tons) Analysis, By Market, 2019-2024
- By Country
- By Source
- By Nature
- By Form
- By End Use
- Current Market Size (US$ Mn) and Volume (Tons) Analysis and Forecast, By Country, 2025-2032
- India
- Indonesia
- Thailand
- Singapore
- ANZ
- Rest of South Asia & Oceania
- Current Market Size (US$ Mn) and Volume (Tons) Analysis and Forecast, By Source, 2025-2032
- Orange
- Lemon & Lime
- Grapefruit
- Tangerine
- Others
- Current Market Size (US$ Mn) and Volume (Tons) Analysis and Forecast, By Nature, 2025-2032
- Organic
- Conventional
- Current Market Size (US$ Mn) and Volume (Tons) Analysis and Forecast, By Form, 2025-2032
- Dry
- Liquid
- Current Market Size (US$ Mn) and Volume (Tons) Analysis and Forecast, By End Use, 2025-2032
- Food & Beverage Industry
- Bakery & Confectionery
- Dairy & Dessert
- Alcoholic Beverages
- Non-Alcoholic Beverages
- Pharmaceuticals
- Nutraceuticals
- Personal Care & Cosmetics
- Others
- Food & Beverage Industry
- Market Attractiveness Analysis
- Historical Market Size (US$ Mn) and Volume (Tons) Analysis, By Market, 2019-2024
- Latin America Citrus Concentrate Market Outlook:
- Historical Market Size (US$ Mn) and Volume (Tons) Analysis, By Market, 2019-2024
- By Country
- By Source
- By Nature
- By Form
- By End Use
- Current Market Size (US$ Mn) and Volume (Tons) Analysis and Forecast, By Country, 2025-2032
- Brazil
- Mexico
- Rest of Latin America
- Current Market Size (US$ Mn) and Volume (Tons) Analysis and Forecast, By Source, 2025-2032
- Orange
- Lemon & Lime
- Grapefruit
- Tangerine
- Others
- Current Market Size (US$ Mn) and Volume (Tons) Analysis and Forecast, By Nature, 2025-2032
- Organic
- Conventional
- Current Market Size (US$ Mn) and Volume (Tons) Analysis and Forecast, By Form, 2025-2032
- Dry
- Liquid
- Current Market Size (US$ Mn) and Volume (Tons) Analysis and Forecast, By End Use, 2025-2032
- Food & Beverage Industry
- Bakery & Confectionery
- Dairy & Dessert
- Alcoholic Beverages
- Non-Alcoholic Beverages
- Pharmaceuticals
- Nutraceuticals
- Personal Care & Cosmetics
- Others
- Food & Beverage Industry
- Market Attractiveness Analysis
- Historical Market Size (US$ Mn) and Volume (Tons) Analysis, By Market, 2019-2024
- Middle East & Africa Citrus Concentrate Market Outlook:
- Historical Market Size (US$ Mn) and Volume (Tons) Analysis, By Market, 2019-2024
- By Country
- By Source
- By Nature
- By Form
- By End Use
- Current Market Size (US$ Mn) and Volume (Tons) Analysis and Forecast, By Country, 2025-2032
- GCC Countries
- Egypt
- South Africa
- Northern Africa
- Rest of Middle East & Africa
- Current Market Size (US$ Mn) and Volume (Tons) Analysis and Forecast, By Source, 2025-2032
- Orange
- Lemon & Lime
- Grapefruit
- Tangerine
- Others
- Current Market Size (US$ Mn) and Volume (Tons) Analysis and Forecast, By Nature, 2025-2032
- Organic
- Conventional
- Current Market Size (US$ Mn) and Volume (Tons) Analysis and Forecast, By Form, 2025-2032
- Dry
- Liquid
- Current Market Size (US$ Mn) and Volume (Tons) Analysis and Forecast, By End Use, 2025-2032
- Food & Beverage Industry
- Bakery & Confectionery
- Dairy & Dessert
- Alcoholic Beverages
- Non-Alcoholic Beverages
- Pharmaceuticals
- Nutraceuticals
- Personal Care & Cosmetics
- Others
- Food & Beverage Industry
- Market Attractiveness Analysis
- Historical Market Size (US$ Mn) and Volume (Tons) Analysis, By Market, 2019-2024
- Competition Landscape
- Market Share Analysis, 2025
- Market Structure
- Competition Intensity Mapping By Market
- Competition Dashboard
- Company Profiles (Details - Overview, Financials, Strategy, Recent Developments)
- Givaudan SA
- Overview
- Segments and Product Type
- Key Financials
- Market Developments
- Market Strategy
- International Flavors & Fragrances, Inc.
- Symrise AG
- ALG Juices Pty Ltd
- Sensient Technologies Corporation
- Takasago International Corporation
- Firmenich SA
- Döhler
- Kerry Group
- Archer Daniels Midland Company
- Mane Group
- Others
- Givaudan SA
- Appendix
- Research Methodology
- Research Assumptions
- Acronyms and Abbreviations

Loading page data
Please wait a moment


