


- Processed Food
- Camel Milk Products Market
Camel Milk Products Market Size, Share, and Growth Forecast 2026 - 2033
Camel Milk Products Market by Product (Plain Milk, Flavored Milk, Powder, Ice Cream, Fermented, Others), by Distribution Channel (Offline, Online), by Regional Analysis, 2026 2033
Camel Milk Products Market Size and Trend Analysis
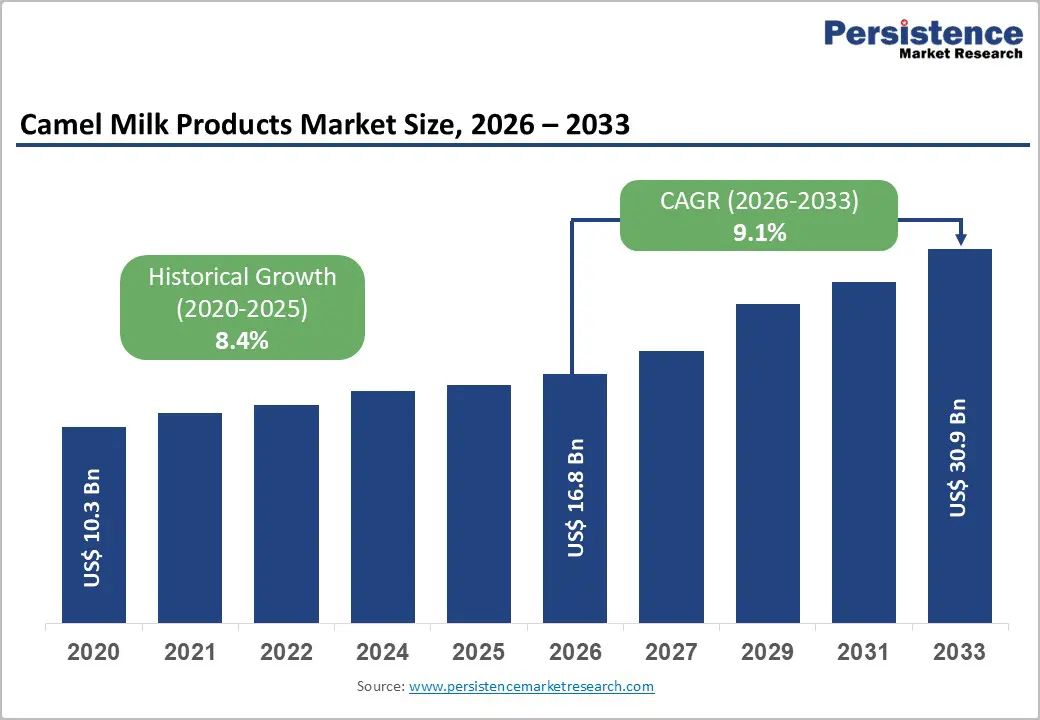
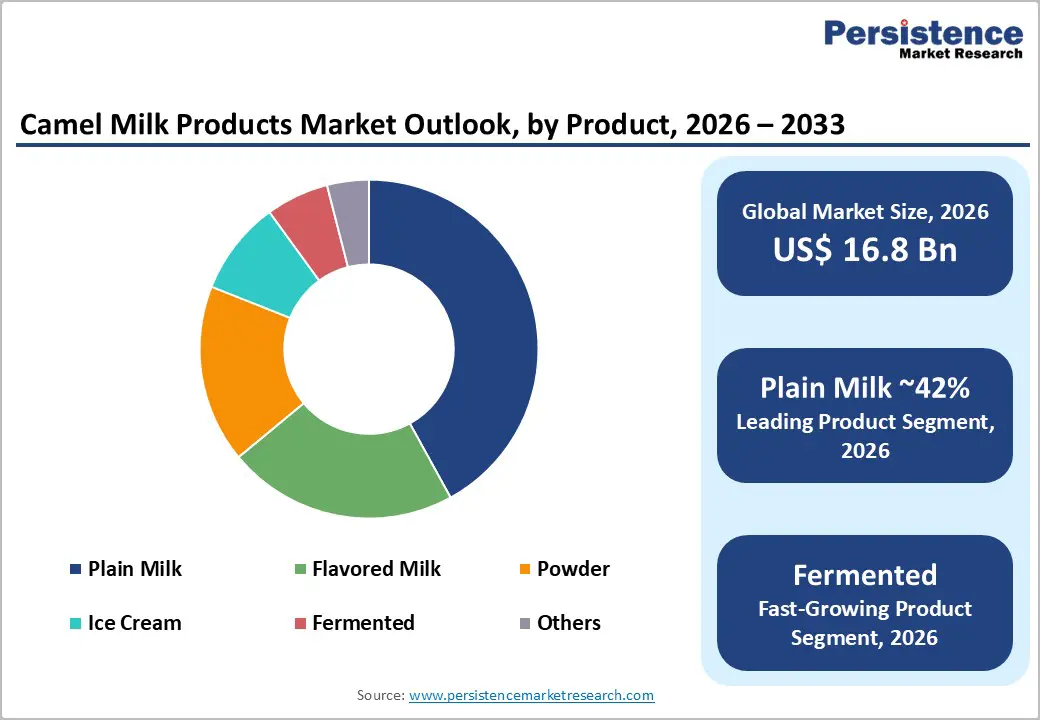
The global camel milk products market size is expected to be valued at US$ 16.8 billion in 2026 and projected to reach US$ 30.9 billion by 2033, growing at a CAGR of 9.1% between 2026 and 2033.
Rising awareness of the nutritional and functional benefits of camel milk, combined with product innovation in powders, fermented drinks, and ice creams, is driving rapid premiumization in this niche dairy category. According to FAO and associated expert groups, global camel milk production reached around 4.12 million tonnes in 2023, with consistent growth over the last decade, reflecting increasing formalization of camel dairies in Africa, the Middle East, and Asia. This expanding supply base, together with scientific evidence on potential benefits in conditions such as diabetes and autism spectrum disorders, is underpinning long-term demand for packaged camel milk products worldwide.
Key Market Highlights
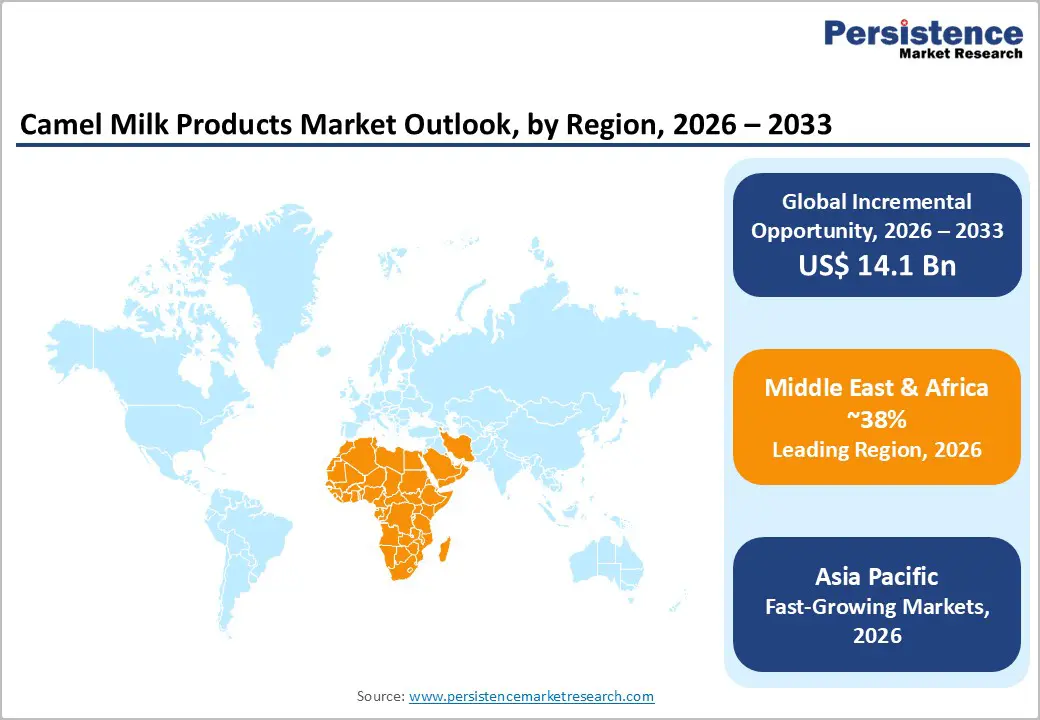
- The Middle East and Africa lead the camel milk market, supported by cultural preferences, traditional consumption, abundant camel populations, local production, and growing demand for functional products.
- Asia Pacific is the fastest-growing camel milk market, driven by India’s expanding dairying, branded products, e-commerce, and urban retail access.
- Plain camel milk dominates with 42% share in 2025, aided by cultural acceptance, pasteurized/UHT launches, and functional dairy positioning.
- Fermented and cultured camel milk products grew rapidly, with production rising tenfold (2020 - 2025), reflecting global demand for probiotics and gut health.
- Opportunities include value-added innovations, fermented drinks, powders, ice creams, cheeses, and nutraceuticals, expanding into high-income regions and integrating pastoral communities.
| Key Insights | Details |
|---|---|
| Camel Milk Products Market Size (2026E) | US$ 16.8 billion |
| Market Value Forecast (2033F) | US$ 30.9 billion |
| Projected Growth CAGR (2026 - 2033) | 9.1% |
| Historical Market Growth (2020 - 2025) | 8.4% |
Market Dynamics
Drivers - Nutritional and functional health benefits of camel milk
The primary growth driver for the camel milk products market is rising consumer recognition of camel milk’s unique nutritional profile and potential functional health benefits. Meta-analyses and clinical trials indicate that camel milk contains higher levels of vitamin C, various minerals, immunoglobulins, and insulin-like proteins than cow’s milk, conferring antioxidant, antibacterial, and antiviral properties that may support metabolic and neurological health. A 2022 meta-analysis of randomized clinical trials found that consumption of raw or boiled camel milk led to statistically significant improvements in Childhood Autism Rating Scale (CARS) scores in children with autism spectrum disorder, supporting its potential as an adjunctive therapy. Other studies and case reports suggest benefits for glycemic control in people with type 1 and type 2 diabetes, owing to insulin-like molecules and high zinc levels that may improve insulin sensitivity. As health-conscious consumers seek natural, nutrient-dense alternatives to conventional dairy, this evidence strengthens the positioning of camel milk products as premium functional foods and beverages.
Expanding camel milk production and formal dairy value chains
A second key growth driver is the steady expansion of camel milk production and the formalization of camel dairy value chains across producing regions. FAO and FAOSTAT data indicate that global fresh camel milk output reached approximately 4.1 million tonnes in 2023, up strongly from earlier in the decade, with countries such as Kenya, Somalia, Mali, Ethiopia, Saudi Arabia, Niger, and the United Arab Emirates ranking among the largest producers. In Kenya, annual camel milk production is estimated at around 1.165 million tonnes, making it the world’s leading producer and reflecting rapid growth supported by pastoral development programs and improved processing infrastructure. At the same time, integrated dairies such as Camelicious in the UAE, which operates over 7,000-8,000 camels and one of the world’s largest camel milk powder facilities, and pioneering processors like Tiviski in Mauritania, have demonstrated successful models for collecting milk from nomadic herders and converting it into pasteurized milk, cheese, and value-added products for domestic and export markets. These developments secure a more reliable raw-milk supply for branded camel milk product manufacturers.
Restraints - Limited supply, high production costs, and price premiums
Despite strong demand, limited supply and high production costs act as significant restraints on the Camel Milk Products Market. Camel herds are concentrated in arid and semi-arid areas, and only a fraction of animals is lactating at any given time. FAO-linked assessments estimate that about 16% of the global camel population are lactating females, and average yields remain modest at roughly 1,200 liters per camel per year, far lower than those of intensively managed dairy cows. As a result, camel milk is substantially more expensive than cow’s milk; in markets such as Kenya and India, farm-gate prices reported for raw camel milk can reach several times those of bovine milk, and powdered camel milk is often sold as a premium niche product costing many multiples of standard milk powder. High retail prices limit penetration into price-sensitive consumer segments and constrain usage in mass-market food processing.
Regulatory gaps and safety perceptions in emerging markets
Another restraint is regulatory uncertainty and varying safety perceptions in some markets. While the global dairy sector increasingly follows harmonized standards, camel milk still lacks widely adopted product standards in several jurisdictions, although Codex Alimentarius committees under FAO/WHO have recently begun addressing camel milk and fermented camel milk in global discussions. In some countries, camel milk is traditionally consumed raw, raising concerns about microbiological safety and zoonotic risks if hygiene is poor. Establishing cold chains in remote, hot regions is challenging and expensive, and the absence of clear guidelines on pasteurization, labeling, and health claims can slow the development of branded packaged products. These issues can limit access to modern retail channels and delay regulatory approvals in high-income importing markets, increasing the risk profile for new entrants.
Opportunities - Rising demand for fermented camel milk and functional dairy products
One of the most attractive opportunities lies in fermented camel milk products, which align with global trends toward probiotics and gut-health-oriented functional foods. FAO and Codex background documents highlight that production of fermented camel milk has grown rapidly in recent years: reported volumes increased from about 9.1 tonnes in 2019 to more than 106.5 tonnes in 2023, reflecting the growing popularity of cultured camel milk products such and yogurts. Brands in the Middle East and Africa offer traditional fermented beverages alongside modern probiotic formulations, while Tiviski’s portfolio in Mauritania includes cultured creams and the unique “Caravane” camel cheese, demonstrating the feasibility of premium artisan products. Consumers increasingly associate fermented camel milk with digestive, immune, and metabolic benefits, and innovations such as flavored lassi-style drinks, kefir-inspired beverages, and fortified probiotic shots offer significant growth opportunities in both retail and foodservice channels.
Product diversification, e-commerce, and export-oriented brands
A parallel opportunity emerges from the diversification of camel milk products and the expansion of online and export channels. Companies such as Camelicious in the UAE and Aadvik Foods in India showcase the breadth of possible offerings, ranging from fresh and UHT camel milk to powders, ice creams, chocolates, protein bars, and even personal care products. Camelicious reports distribution in more than 30 countries, supported by ISO 22000 and EU certifications, while Aadvik Foods exports camel milk powder and derivative products to markets such as the United States, Malaysia, and the Philippines, enabled by freeze-drying technology that extends shelf life and simplifies logistics. At the same time, established dairy cooperatives like GCMMF (Amul) in India have launched branded camel milk and UHT camel milk in select regions, leveraging large retail networks and strong consumer trust. The combination of diversified product portfolios, omnichannel distribution (offline plus e-commerce), and export-oriented branding offers substantial upside for producers and processors.
Category-wise Analysis
Product Insights
Within the product category, plain milk is the leading segment, accounting for about 42% of the global market share in 2025. Pasteurized and UHT camel milk remains the primary entry point for consumers transitioning from traditional unpackaged milk to branded products, as well as for new customers exploring camel milk’s health benefits. Early pioneer dairies like Tiviski in Mauritania introduced fresh pasteurized camel milk in cartons as early as 1989, effectively creating one of the first modern camel milk brands in Africa. Integrated operations such as Camelicious in Dubai and cooperative giants like GCMMF (Amul) in India now supply fresh, chilled, and UHT camel milk in bottles, cartons, and pouches, catering to both local consumers and tourists. Because plain liquid milk aligns closely with traditional consumption habits and can be promoted on the basis of purity and therapeutic value, it naturally captures the largest share of volume and underpins subsequent line extensions into flavored milk and value-added dairy.
Distribution Channel Insights
In the distribution channel category, Offline channels are the leading segment, encompassing supermarkets, hypermarkets, specialty stores, cooperative outlets, and traditional groceries. In camel-producing regions such as Kenya, Mauritania, and the Gulf Cooperation Council (GCC) countries, formal dairies rely heavily on local retail and cooperative networks to move pasteurized camel milk and fermented products, often delivering directly from processing plants to shops to safeguard cold chain integrity. For example, GCMMF (Amul) distributes camel milk through its extensive network of over 1,00,000 dealers and 10,00,000 retailers in India, while Camelicious leverages supermarket chains and hotel channels across the UAE and export markets. Although online sales are growing, especially for high-value powder and specialty products, the need for refrigerated storage, the perishable nature of fresh milk, and the strong role of cooperatives and local retailers ensure that offline outlets currently account for most global camel milk product sales.
Regional Insights
Middle East & Africa Camel Milk Products Market Trends and Insights
The Middle East & Africa (MEA) region continues to dominate the global camel milk products market, holding a significant revenue share driven by long-standing cultural preferences and deeply embedded consumption patterns in countries such as Saudi Arabia, the UAE, Somalia, and Kenya. Traditional demand remains robust as camel milk has historically been a dietary staple, underpinning steady market leadership.
Increasingly, the region is formalizing camel dairy production through government backing, expanded cold-chain infrastructure, and modern commercial farms, which are enabling the growth of pasteurized, UHT, and value-added camel milk products. This transition is supported by rising urbanization, higher disposable incomes, and growing consumer interest in health and wellness categories. Product innovation is gaining traction in MEA, with flavored milks, yogurts, ice creams, and powdered formats being introduced to appeal to both traditional and modern buyers. Retail expansion, especially into supermarkets, hypermarkets, and online channels, further broadens access to these products.
Export ambitions are also strengthening, particularly from Gulf countries like the UAE that are focusing on certified processing and international distribution. Combined with rising awareness of camel milk’s nutritional benefits, these trends position MEA as both a consumption heartland and a future growth engine in the global camel milk market.
Asia Pacific Camel Milk Products Market Trends and Insights
The Asia Pacific region is expected to be the fastest-growing market for camel milk products, owing to expanding camel dairying, supportive government initiatives, and rising health awareness in countries like India, China, and parts of Central and East Asia. In India, brands such as Aadvik Foods and the cooperative giant GCMMF (Amul) have transformed camel milk from a largely localized pastoral product into a branded, packaged dairy segment. Aadvik Foods pioneered commercial camel milk powder and a wide range of derivative products, including chocolates and soaps, and reports exports to countries such as the United States, Malaysia, and the Philippines, supported by freeze-drying technology and a network of more than 200 camel-herding families in Rajasthan and Gujarat.
Government-backed cooperatives like GCMMF (Amul) have launched fresh and UHT camel milk in select markets in Gujarat, including Ahmedabad and Kutch, highlighting benefits for people with diabetes and lactose intolerance and later rolling out long-life UHT variants to address cold-chain challenges. Beyond India, producing countries in West Asia and Central Asia continue to expand camel dairies, while major milk producers like China are exploring camel farming in selected arid regions as part of broader diversification strategies. As e-commerce penetration deepens and logistics infrastructure improves across the Asia Pacific, online and omnichannel sales of camel milk powders, flavored drinks, and functional foods are expected to outpace traditional distribution, making the region the fastest-growing revenue contributor to the camel milk products market.
Competitive Landscape
The camel milk products market is moderately fragmented, with competition driven by product innovation, quality, and regional presence. Key players focus on expanding value-added offerings such as flavored milk, yogurt, ice creams, and powdered formats to cater to health-conscious consumers. Companies are investing in certified processing facilities, modern cold-chain infrastructure, and e-commerce distribution to strengthen market reach. Branding and early-mover advantage in pasteurized and UHT milk segments also provide competitive leverage. Additionally, partnerships with local pastoral communities help secure consistent supply while supporting sustainable sourcing. Overall, strategic innovation and market expansion remain the primary differentiators in this growing market.
Key Market Developments
- In January 2026, Summer Land Camels, a camel milk products manufacturer, planned to enter the U.S. health and wellness market, seeking funding to support expansion at a $22 million valuation.
- In November 2025, Kazakh honey, shubat (fermented camel milk), kumyz (fermented mare’s milk), and sweets are set to appear in stores run by China Co-Op, a leading Chinese cooperative retail chain, as announced by Kazakhstan’s Ministry of Trade.
- In September 2023, Sawani Company launched its first retail stores in Riyadh under the “Noug” trademark, specializing in camel dairy products.
Companies Covered in Camel Milk Products Market
- Camelicious
- Desert Farms, Inc.
- The Camel Milk Co. Australia Pty Ltd.
- Camilk
- CAMEL DAIRY SMITS (KAMELENMELKERIJ SMITS)
- Al Ain Farms
- Tiviski pvt Ltd.
- UK Camel Milk Ltd
- Aadvik Foods
- QCamel
- GCMMF (Gujarat Cooperative Milk Marketing Federation)
- Others
Frequently Asked Questions
The camel milk products market is expected to reach approximately US$ 16.8 billion in 2026.
Demand is driven by camel milk’s high nutritional value, functional health benefits, and growing consumer preference for natural, clean-label dairy alternatives.
Middle East and Africa lead the camel milk market, driven by traditional consumption, large camel populations, local production, and growing health awareness.
Key opportunities include developing fermented camel milk beverages, probiotic yogurts, and innovative functional dairy products targeting global health-focused consumers.
Major companies include Camelicious, Desert Farms, Aadvik Foods, Al Ain Farms, QCamel, and GCMMF (Amul).


