


- Electrical Equipment & Services
- Busway Market
Busway Market Size, Share, and Growth Forecast, 2026-2033
Busway Market by Design (Plug-In, Feeder, Lighting, Enclosed, Air-Insulated, Isolated Phase, Others), Material (Copper, Aluminum, Hybrid Materials, Plated Conductors), End-User (Industrial Facilities, Commercial Buildings, Data Centers & IT Facilities, Public Sector, Residential Buildings, Others), and Regional Forecast for 2026-2033
Busway Market Share and Trends Analysis
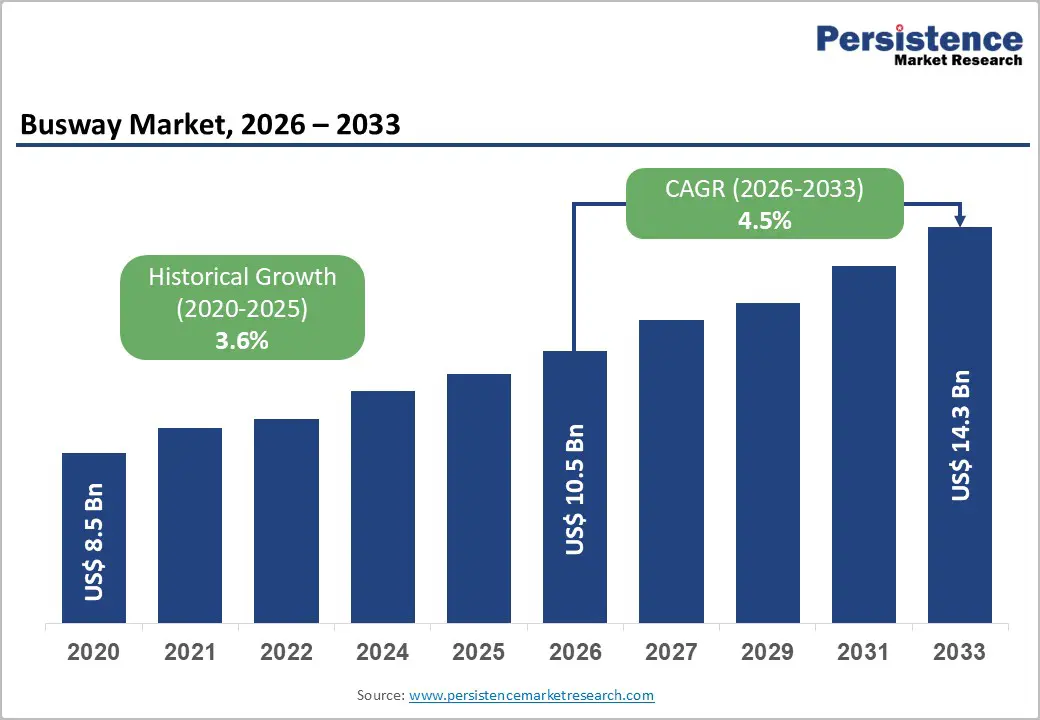
The global busway market size is likely to be valued at US$ 10.5 billion in 2026, and is projected to reach US$ 14.3 billion by 2033, growing at a CAGR of 4.5% during the forecast period 2026 - 2033. Accelerating power density requirements across commercial and industrial infrastructure, particularly in environments where space efficiency and load scalability are becoming critical, are aiding market expansion. Rising investments in data centers are further strengthening demand, as operators are prioritizing flexible and high capacity power distribution architectures. Regulatory mandates are favoring energy efficient electrical distribution systems and safer power management solutions, promoting market growth. The adoption of modular power systems is increasing across urban infrastructure projects, manufacturing facilities, and digital economy assets due to their ease of installation, reduced downtime, and lifecycle efficiency benefits. Electrification trends, rapid urbanization, and grid modernization initiatives are continuing to support structural expansion across both developed and emerging economies.
Key Industry Highlights
- Dominant Product Category: Plug-in busway systems are projected to account for 42% of revenue share in 2026, while feeder and lighting busways are expected to grow the fastest at a 5.8% CAGR through 2033, driven by flexible power distribution needs.
- Material Leadership: Copper busway systems are anticipated to lead with 56% share in 2026, whereas aluminum busways are forecast to expand at a 5.2% CAGR during 2026–2033, supported by cost and weight advantages.
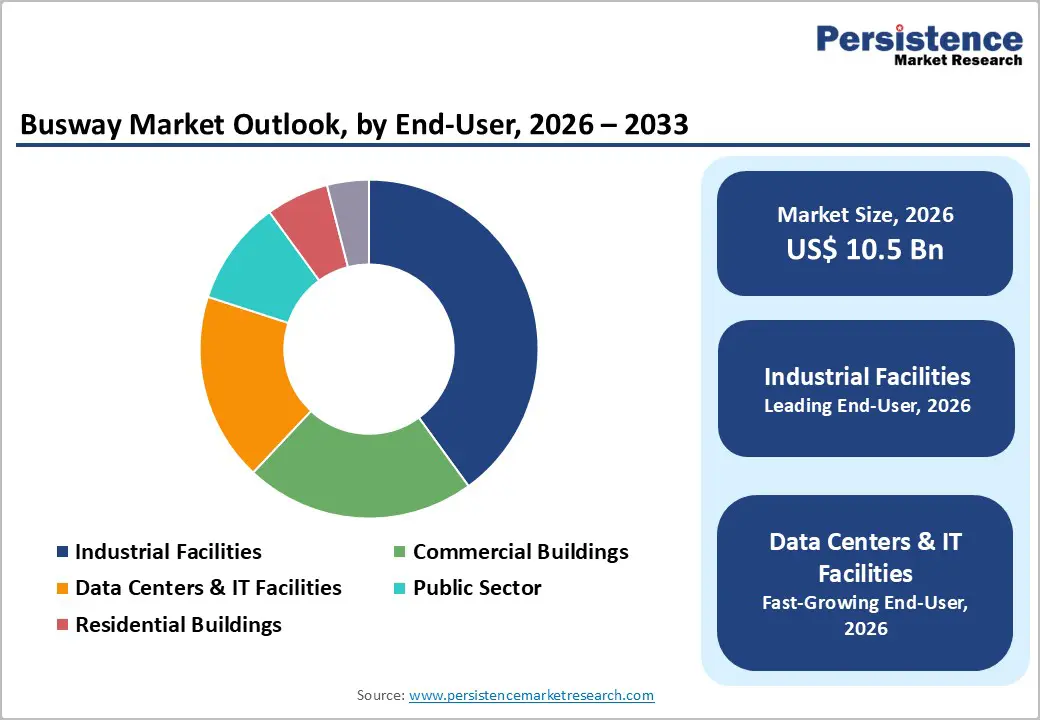
- Leading End-Users: Industrial and commercial facilities are expected to represent 40% of demand in 2026, while data centers & IT facilities are projected to be the fastest-growing at about 6.5% CAGR through 2033.
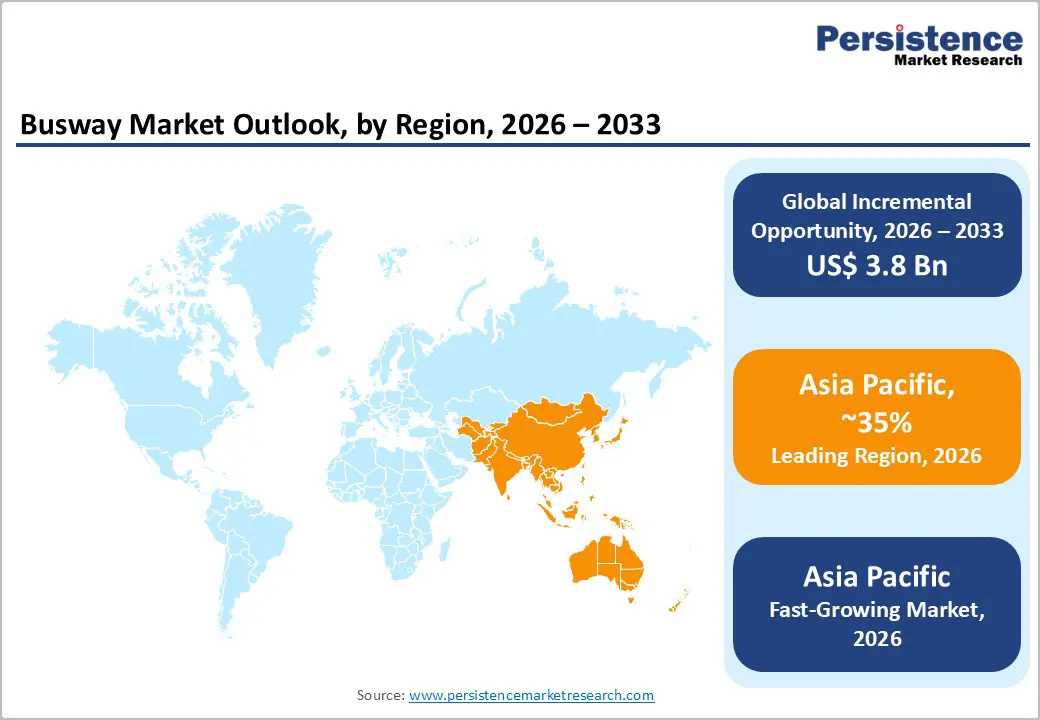
- Regional Dominance: Asia Pacific is estimated to hold 35% market share in 2026 and register a 6.2% CAGR through 2033, led by infrastructure expansion and data center investments.
- Technology Trends: Smart, digitally enabled busway systems are projected to grow at nearly twice the market’s growth rate, as energy monitoring and predictive maintenance capabilities gain priority.
- June 2025: Legrand acquired Malaysian busway specialist Linkk Busway Systems as part of its targeted bolt-on acquisition strategy to support growth in energy and digital transition segments.
| Key Insights | Details |
|---|---|
| Busway Market Size (2026E) | US$ 10.5 Bn |
| Market Value Forecast (2033F) | US$ 14.3 Bn |
| Projected Growth (CAGR 2026 to 2033) | 4.5% |
| Historical Market Growth (CAGR 2020 to 2025) | 3.6% |
Market Factors – Growth, Barriers, and Opportunity Analysis
Structural Shift toward Energy-Efficient, High-Density Electrical Infrastructure
The rapid expansion of hyperscale and colocation data centers, along with rising power density across commercial and industrial facilities, is a central growth driver for the busway systems market. According to the U.S. Department of Energy (DOE) and the International Energy Agency (IEA), global data center electricity demand surpassed 460 TWh in 2024, with sustained growth expected through 2030, reinforcing the need for scalable and space-efficient power distribution. Busway power distribution systems support modular expansion, faster deployment, and efficient load management, which are critical for modern data center design. Compared to traditional cabling, busways reduce installation time by over 30%, directly improving project execution timelines and total cost of ownership. This structural shift continues to favor plug-in and feeder busway configurations across digital infrastructure environments.
Regulatory frameworks and industrial electrification trends are strengthening long-term demand prospects. National Electrical Code (NEC), International Electrotechnical Commission (IEC), and European Commission (EC) Ecodesign Directives increasingly favor low-loss electrical distribution architectures, positioning busways as a preferred solution for compliance-driven upgrades. At the industrial level, the World Bank and UN Industrial Development Organization (UNIDO) highlight that industrial electricity consumption continues to outpace overall energy demand growth, driven by automation, robotics, and digital manufacturing. The modular design of industrial busway systems aligns with Industry 4.0 requirements, enabling manufacturers to scale production lines without extensive electrical rework, thereby improving operational resilience, safety, and capital efficiency.
Cost Escalation and Workforce Complexity in Busway Deployment
Despite strong long-term operational advantages, busway systems face significant upfront capital cost barriers relative to traditional cable-based electrical distribution. Initial installation expenses are often 10–20% higher depending on conductor material and system rating, continue to strain project budgets, particularly in small-scale facilities and emerging markets. Escalating construction material prices and tariff-driven cost increases including higher duties on copper, steel, and aluminum, have amplified procurement budgets for busway components. For example, copper prices exceeded US$ 13,000 per ton in early 2026, forcing developers to revise cost estimates and adjust procurement planning. These factors make conventional cabling more appealing for cost-sensitive projects despite long-term efficiency advantages.
Compounding these financial pressures is the ongoing workforce and technical implementation complexity associated with busway systems. Installation requires specialized engineering expertise and strict adherence to regional standards, increasing reliance on skilled labor. The global infrastructure reports indicate labor shortages for trained electrical technicians persist through 2026, extending project timelines and inflating costs in major infrastructure markets. Coupled with standardization discrepancies across regions, these challenges elevate compliance risk, often requiring outsourcing or additional training. This combination of higher upfront costs and technical complexity continues to constrain rapid adoption in price-conscious and smaller-scale markets.
Expanding Demand through Infrastructure Growth and Technological Integration
The rapid development and modernization of infrastructure across emerging and developed economies are creating significant growth opportunities for the busway systems market. Large-scale initiatives, such as urban transport hubs, industrial parks, and smart city projects, increasingly prioritize modular power distribution solutions to meet high power density and scalability requirements. Substantial infrastructure spending in Asia Pacific, the Middle East, and Latin America is driving predictable long-term demand for busway adoption. Greenfield projects in commercial and industrial sectors are specifying flexible, low-loss busway systems, providing manufacturers with sustained revenue visibility. The rising energy efficiency mandates and the increasing adoption of high-density electrical infrastructure in new developments further reinforce these trends.
Technological integration is creating additional value propositions for busway suppliers. Siemens introduced AI-based predictive analytics for busway fault monitoring, while Eaton launched a high-capacity data center busway series with enhanced monitoring and modular features. These innovations enable real-time load monitoring, predictive maintenance, and energy optimization, aligning with ESG and operational efficiency goals. Simultaneously, retrofitting aging electrical infrastructure in North America and Europe continues to expand, as public buildings and commercial facilities increasingly adopt busway systems for safety, scalability, and energy efficiency improvements. These infrastructure expansions, digital integration, and retrofit demand create strong, sustained growth potential across multiple regions and market segments.
Category-wise Analysis
Design Insights
Plug?in busway systems are expected to be the leading segment, capturing an estimated 42% of market revenues in 2026. Their modular design and rapid deployment advantages allow adjustments without service interruption, making them ideal for environments such as large commercial buildings and growing data centers. These systems enable scalable load management while reducing downtime during expansions or configuration changes. Siemens launched the “Busway Xtreme” low?voltage modular system, designed for high?capacity deployment in commercial and data center applications, demonstrating continued innovation in plug?in busway technology. Their flexibility and ease of installation sustain their dominant position in modern infrastructure projects.
Feeder and lighting busways are anticipated to be the fastest?growing design types, expected to expand at a 5.8% CAGR through 2033. Rising demand comes from industrial and smart building projects that require ceiling-mounted or distributed power delivery. These systems support segmented load routing, improve safety compliance, and enable scalable infrastructure for complex facilities. ABB unveiled a high-performance busbar trunking system for large industrial installations, reflecting ongoing portfolio upgrades to meet evolving feeder and branch power distribution needs. These innovations enhance adoption in both retrofit and greenfield projects where operational efficiency is critical.
Material Insights
Copper is projected to be the dominant material, holding an estimated 56% of the busway market revenue share in 2026, due to superior electrical conductivity, thermal stability, and long-term reliability. Copper minimizes resistive losses in high-current applications, making it the preferred choice for hyperscale data centers, industrial plants, and critical commercial facilities. Its durability ensures consistent performance, which is essential for mission-critical power distribution networks requiring operational continuity and energy efficiency.
Aluminum busway systems are likely to be the fastest-growing, projected to grow at a 5.2% CAGR through 2033. Lightweight construction and cost advantages facilitate installation in large commercial buildings and retrofit projects. Hybrid solutions combining aluminum with optimized conductors are increasingly introduced to balance performance with cost. Government-backed modernization initiatives in emerging markets are also driving interest in lighter, cost-effective busway solutions where supply chain reliability and installation efficiency are key considerations.
End?User Insights
Industrial facilities are likely to remain the largest end-users, estimated to secure nearly 40% of total busway demand in 2026. The continuous investments in automation, electrification, and digital operations drive robust, scalable power distribution needs in automotive, aerospace, semiconductor, and process manufacturing plants. Busway systems reduce downtime and support reconfiguration of production lines efficiently. Government-led initiatives, such as India’s Revamped Distribution Sector Scheme (RDSS), which aims at upgrading distribution networks through 2025–26, further enhance infrastructure readiness and incentivize industrial adoption of modular electrical systems.
Data centers and IT facilities are anticipated to be the fastest-growing end-use segment, with a projected 6.5% CAGR through 2033. The growth is fueled by hyperscale data center expansion and increased edge compute deployments. Policy support is evident in projects such as New South Wales establishing a data center Investment Delivery Authority in 2025, which streamlines approvals for large digital infrastructure projects. Busway systems are increasingly preferred over traditional cabling for their modularity, adaptability, and ability to handle high-density electrical loads in dynamic IT environments.
Regional Insights
North America Busway Market Trends
North America holds an influential position in the busway market, anchored by the United States’ advanced data center ecosystem and stringent electrical safety standards. The U.S. drives the majority of regional demand through hyperscale and edge data center expansion, commercial infrastructure projects, and federal infrastructure funding aimed at modernizing the power grid and improving energy resilience. Over 1,200 edge data centers are projected to be operational by 2026, further increasing demand for modular busway systems capable of supporting high power density, simplified reconfiguration, and reduced installation downtime.
The key suppliers are actively expanding capabilities to meet this demand. Vertiv secured a major contract to supply busway-based power distribution for a hyperscale data center campus, while Eaton launched a high-capacity modular busway series featuring enhanced digital load monitoring and real-time operational analytics. These developments demonstrate North America’s strategic focus on mission-critical reliability, scalability, and operational efficiency, addressing the growing need for advanced electrical distribution in commercial, industrial, and IT infrastructure projects across the region.
Europe Busway Market Trends
The Europe market is expected to exhibit steady growth during the 2026-2033 forecast period, driven by regulatory harmonization, energy efficiency initiatives under the European Green Deal, and modernization of industrial, commercial, and public infrastructure. Germany, the U.K., and France are the largest contributors, supported by industrial retrofits, public facility upgrades, and expanding data center deployments. Standardized IEC-compliant busway solutions facilitate cross-border adoption and reduce installation complexity, while energy efficiency regulations continue to encourage replacement of conventional cabling with modular, low-loss distribution systems.
The recent industry developments illustrate product evolution and market momentum. Schneider Electric unveiled its next?generation “I?Line Track” medium power distribution busway in Europe to support scalable, flexible data center builds, reflecting targeted innovation for high?density and low?loss power distribution. Data center and green infrastructure investments across the region are also likely to deepen the emphasis on modular, reliable busway adoption. These developments reinforce Europe’s dual focus on energy efficiency and digitally enhanced power distribution, strengthening long?term demand across commercial, industrial, and digital infrastructure segments.
Asia Pacific Busway Market Trends
Asia Pacific is projected to be the leading and fastest-growing regional market for busway systems, with a 35% revenue share in the 2026, along with a CAGR of 6.5%, driven by rapid urbanization, industrial expansion, and ambitious infrastructure programs in China, India, Japan, and ASEAN nations. Demand is fueled by smart city initiatives, industrial electrification, and high-density commercial developments requiring flexible, scalable busway solutions. China dominates regional production capacity, while India and Southeast Asia are high-growth consumption markets where modular electrical distribution is increasingly adopted in manufacturing, IT, and commercial sectors.
The recent example of the introduction of the BR Series and BL Series cast resin busway systems by Delta Power Solutions, designed to enhance power distribution efficiency and safety, reflects strong uptake of busway systems across industrial and commercial deployments in Asia Pacific. Government-supported programs, including India’s smart city initiatives and industrial corridor electrification projects, further drive demand for advanced busway solutions. Competitive local manufacturing, cost advantages, and integration with digital monitoring platforms continue to position Asia Pacific as the fastest-expanding market for modular, energy-efficient electrical distribution systems across the region.
Competitive Landscape
The global busway market structure is moderately consolidated, with leading players such as Siemens, Schneider Electric, Eaton, and ABB together accounting for over 50% of global revenue. These companies leverage strong relationships with industrial, commercial, and data center clients, extensive compliance expertise, and integrated hardware-software solutions for modular and digitally monitored busway systems. They also invest significantly in R&D to advance modular design, digital load monitoring, and energy-efficient distribution technologies, ensuring technological leadership.
Meanwhile, regional and niche players such as Delta Power Solutions, Mersen, and Legrand focus on specialized applications, localized markets, or emerging segments such as lightweight aluminum busways and retrofit solutions. High barriers to entry, including technical expertise, adherence to IEC/NEC standards, and project-level system integration complexity, limit new competitors. However, the digitalization of power distribution and the integration of IoT-based monitoring platforms are enabling software-focused firms to collaborate with hardware vendors. Market consolidation is expected to continue gradually, as global leaders pursue acquisitions of smaller regional players and innovation partnerships to expand their geographical footprint and enhance modular, smart busway offerings.
Key Industry Developments
- In October 2025, Hubbell Incorporated completed the US$ 825 million acquisition of DMC Power, a specialist in high-voltage connectors and swage tooling systems used in utility substations and transmission infrastructure. This strategic move strengthens Hubbell’s position in the utility sector, particularly as data center buildouts and aging grid infrastructure increase power distribution demands.
- In September 2025, ABB introduced advanced safety-focused busway solutions through its WavePro-A and Pmax-F series, which provide up to 3 hours of fire resistance at high temperatures, complying with IEC 60331-1 and DIN 4102-12 standards. These systems ensure circuit integrity during fire emergencies, critical for high-rise buildings, data centers, and other infrastructure requiring uninterrupted power for emergency systems.
- In February 2025, TE Connectivity finalized the acquisition of Richards Manufacturing for approximately US$2.3 billion, securing a key supplier of medium-voltage cold-shrink accessories and network protectors. This acquisition enhances TE’s capabilities in North America’s energy grid transformation and supports growing demand for reliable, high-performance electrical infrastructure. Richards Manufacturing will operate under TE’s Industrial Solutions segment, allowing seamless integration with TE’s existing offerings.
Companies Covered in Busway Market
- Schneider Electric
- ABB Ltd.
- Siemens AG
- Eaton Corporation
- Legrand
- General Electric
- Larsen & Toubro
- Mitsubishi Electric
- C&S Electric
- LS Cable & System
- Godrej & Boyce
- Powell Industries
Frequently Asked Questions
The global busway market is projected to reach US$ 10.5 billion in 2026.
Market growth is driven by rapid data center expansion, industrial electrification, rising power density in commercial and industrial facilities, and government-backed infrastructure modernization programs.
The market is poised to witness a CAGR of 4.5% between 2026 and 2033.
Opportunities emerging in the form of integration with smart grid and digital monitoring technologies and retrofitting aging commercial and public electrical systems.
Siemens AG, Schneider Electric, Eaton Corporation, ABB Ltd., Delta Power Solutions, Mersen, and Legrand are few of the key players in the market.


