

- Executive Summary
- Global Bicycle Apparel Market Snapshot 2025 and 2032
- Market Opportunity Assessment, 2025-2032, US$ Bn
- Key Market Trends
- Industry Developments and Key Market Events
- Demand Side and Supply Side Analysis
- PMR Analysis and Recommendations
- Market Overview
- Market Scope and Definitions
- Value Chain Analysis
- Macro-Economic Factors
- Global GDP Outlook
- Global Bicycle Industry Market by Region
- Global Bicycle Industry Market Growth Outlook
- Cyclist Growth Outlook by Region
- Forecast Factors – Relevance and Impact
- COVID-19 Impact Assessment
- PESTLE Analysis
- Porter's Five Forces Analysis
- Geopolitical Tensions: Market Impact
- Regulatory and Technology Landscape
- Market Dynamics
- Drivers
- Restraints
- Opportunities
- Trends
- Price Trend Analysis, 2019 – 2032
- Region-wise Price Analysis
- Price by Segments
- Price Impact Factors
- Global Bicycle Apparel Market Outlook:
- Key Highlights
- Global Bicycle Apparel Market Outlook: Product Type
- Introduction/Key Findings
- Historical Market Size (US$ Bn) and Volume (Th. Units) Analysis by Product Type, 2019-2023
- Current Market Size (US$ Bn) and Volume (Th. Units) Analysis and Forecast, by Product Type, 2025-2032
- Cycling Tops
- Jerseys
- Jackets
- T-shirts
- Body Insulators/ Warmers
- Cycling Bottoms
- Big Shorts
- Tights and Pants
- Cycling Gloves
- Shoes
- Cycling Tops
- Market Attractiveness Analysis: Product Type
- Global Bicycle Apparel Market Outlook: Price range
- Introduction/Key Findings
- Historical Market Size (US$ Bn) and Volume (Th. Units) Analysis by Price range, 2019-2023
- Current Market Size (US$ Bn) and Volume (Th. Units) Analysis and Forecast, by Price range, 2025-2032
- Premium
- Mid-range
- Low-range
- Green Technologies
- Radar and Aerospace Technologies
- Market Attractiveness Analysis: Price range
- Global Bicycle Apparel Market Outlook: End User
- Introduction/Key Findings
- Historical Market Size (US$ Bn) and Volume (Th. Units) Analysis by End User, 2019-2023
- Current Market Size (US$ Bn) and Volume (Th. Units) Analysis and Forecast, by End User, 2025-2032
- Men
- Women
- Kids
- Market Attractiveness Analysis: End User
- Global Bicycle Apparel Market Outlook: Sales Channel
- Introduction/Key Findings
- Historical Market Size (US$ Bn) and Volume (Th. Units) Analysis by Sales Channel, 2019-2023
- Current Market Size (US$ Bn) and Volume (Th. Units) Analysis and Forecast, by Sales Channel, 2025-2032
- Wholesalers/ Distributors
- Supermarkets/ Hypermarkets
- Specialty Stores
- Multi-brand Stores
- Online Retailers
- Other Sales Channels
- Market Attractiveness Analysis: Sales Channel
- Global Bicycle Apparel Market Outlook: Region
- Key Highlights
- Historical Market Size (US$ Bn) and Volume (Th. Units) Analysis by Region, 2019-2023
- Current Market Size (US$ Bn) and Volume (Th. Units) Analysis and Forecast, by Region, 2025-2032
- North America
- Europe
- East Asia
- South Asia & Oceania
- Latin America
- Middle East & Africa
- Market Attractiveness Analysis: Region
- North America Bicycle Apparel Market Outlook:
- Key Highlights
- Pricing Analysis
- North America Market Size (US$ Bn) and Volume (Th. Units) Analysis and Forecast, by Country, 2025-2032
- U.S.
- Canada
- North America Market Size (US$ Bn) and Volume (Th. Units) Analysis and Forecast, by Product Type, 2025-2032
- Cycling Tops
- Jerseys
- Jackets
- T-shirts
- Body Insulators/ Warmers
- Cycling Bottoms
- Big Shorts
- Tights and Pants
- Cycling Gloves
- Shoes
- Cycling Tops
- North America Market Size (US$ Bn) and Volume (Th. Units) Analysis and Forecast, by Price range, 2025-2032
- Premium
- Mid-range
- Low-range
- Green Technologies
- Radar and Aerospace Technologies
- North America Market Size (US$ Bn) and Volume (Th. Units) Analysis and Forecast, by End User, 2025-2032
- Men
- Women
- Kids
- North America Market Size (US$ Bn) and Volume (Th. Units) Analysis and Forecast, by Sales Channel, 2025-2032
- Wholesalers/ Distributors
- Supermarkets/ Hypermarkets
- Specialty Stores
- Multi-brand Stores
- Online Retailers
- Other Sales Channels
- Europe Bicycle Apparel Market Outlook:
- Key Highlights
- Pricing Analysis
- Europe Market Size (US$ Bn) and Volume (Th. Units) Analysis and Forecast, by Country, 2025-2032
- Germany
- Italy
- France
- U.K.
- Spain
- Russia
- Rest of Europe
- Europe Market Size (US$ Bn) and Volume (Th. Units) Analysis and Forecast, by Product Type, 2025-2032
- Cycling Tops
- Jerseys
- Jackets
- T-shirts
- Body Insulators/ Warmers
- Cycling Bottoms
- Big Shorts
- Tights and Pants
- Cycling Gloves
- Shoes
- Cycling Tops
- Europe Market Size (US$ Bn) and Volume (Th. Units) Analysis and Forecast, by Price range, 2025-2032
- Premium
- Mid-range
- Low-range
- Green Technologies
- Radar and Aerospace Technologies
- Europe Market Size (US$ Bn) and Volume (Th. Units) Analysis and Forecast, by End User, 2025-2032
- Men
- Women
- Kids
- Europe Market Size (US$ Bn) and Volume (Th. Units) Analysis and Forecast, by Sales Channel, 2025-2032
- Wholesalers/ Distributors
- Supermarkets/ Hypermarkets
- Specialty Stores
- Multi-brand Stores
- Online Retailers
- Other Sales Channels
- East Asia Bicycle Apparel Market Outlook:
- Key Highlights
- Pricing Analysis
- East Asia Market Size (US$ Bn) and Volume (Th. Units) Analysis and Forecast, by Country, 2025-2032
- China
- Japan
- South Korea
- East Asia Market Size (US$ Bn) and Volume (Th. Units) Analysis and Forecast, by Product Type, 2025-2032
- Cycling Tops
- Jerseys
- Jackets
- T-shirts
- Body Insulators/ Warmers
- Cycling Bottoms
- Big Shorts
- Tights and Pants
- Cycling Gloves
- Shoes
- Cycling Tops
- East Asia Market Size (US$ Bn) and Volume (Th. Units) Analysis and Forecast, by Price range, 2025-2032
- Premium
- Mid-range
- Low-range
- Green Technologies
- Radar and Aerospace Technologies
- East Asia Market Size (US$ Bn) and Volume (Th. Units) Analysis and Forecast, by End User, 2025-2032
- Men
- Women
- Kids
- East Asia Market Size (US$ Bn) and Volume (Th. Units) Analysis and Forecast, by Sales Channel, 2025-2032
- Wholesalers/ Distributors
- Supermarkets/ Hypermarkets
- Specialty Stores
- Multi-brand Stores
- Online Retailers
- Other Sales Channels
- South Asia & Oceania Bicycle Apparel Market Outlook:
- Key Highlights
- Pricing Analysis
- South Asia & Oceania Market Size (US$ Bn) and Volume (Th. Units) Analysis and Forecast, by Country, 2025-2032
- India
- Southeast Asia
- ANZ
- Rest of SAO
- South Asia & Oceania Market Size (US$ Bn) and Volume (Th. Units) Analysis and Forecast, by Product Type, 2025-2032
- Cycling Tops
- Jerseys
- Jackets
- T-shirts
- Body Insulators/ Warmers
- Cycling Bottoms
- Big Shorts
- Tights and Pants
- Cycling Gloves
- Shoes
- Cycling Tops
- South Asia & Oceania Market Size (US$ Bn) and Volume (Th. Units) Analysis and Forecast, by Price range, 2025-2032
- Premium
- Mid-range
- Low-range
- Green Technologies
- Radar and Aerospace Technologies
- South Asia & Oceania Market Size (US$ Bn) and Volume (Th. Units) Analysis and Forecast, by End User, 2025-2032
- Men
- Women
- Kids
- South Asia & Oceania Market Size (US$ Bn) and Volume (Th. Units) Analysis and Forecast, by Sales Channel, 2025-2032
- Wholesalers/ Distributors
- Supermarkets/ Hypermarkets
- Specialty Stores
- Multi-brand Stores
- Online Retailers
- Other Sales Channels
- Latin America Bicycle Apparel Market Outlook:
- Key Highlights
- Pricing Analysis
- Latin America Market Size (US$ Bn) and Volume (Th. Units) Analysis and Forecast, by Country, 2025-2032
- Brazil
- Mexico
- Rest of LATAM
- Latin America Market Size (US$ Bn) and Volume (Th. Units) Analysis and Forecast, by Product Type, 2025-2032
- Cycling Tops
- Jerseys
- Jackets
- T-shirts
- Body Insulators/ Warmers
- Cycling Bottoms
- Big Shorts
- Tights and Pants
- Cycling Gloves
- Shoes
- Cycling Tops
- Latin America Market Size (US$ Bn) and Volume (Th. Units) Analysis and Forecast, by Price range, 2025-2032
- Premium
- Mid-range
- Low-range
- Green Technologies
- Radar and Aerospace Technologies
- Latin America Market Size (US$ Bn) and Volume (Th. Units) Analysis and Forecast, by End User, 2025-2032
- Men
- Women
- Kids
- Latin America Market Size (US$ Bn) and Volume (Th. Units) Analysis and Forecast, by Sales Channel, 2025-2032
- Wholesalers/ Distributors
- Supermarkets/ Hypermarkets
- Specialty Stores
- Multi-brand Stores
- Online Retailers
- Other Sales Channels
- Middle East & Africa Bicycle Apparel Market Outlook:
- Key Highlights
- Pricing Analysis
- Middle East & Africa Market Size (US$ Bn) and Volume (Th. Units) Analysis and Forecast, by Country, 2025-2032
- GCC Countries
- South Africa
- Northern Africa
- Rest of MEA
- Middle East & Africa Market Size (US$ Bn) and Volume (Th. Units) Analysis and Forecast, by Product Type, 2025-2032
- Cycling Tops
- Jerseys
- Jackets
- T-shirts
- Body Insulators/ Warmers
- Cycling Bottoms
- Big Shorts
- Tights and Pants
- Cycling Gloves
- Shoes
- Cycling Tops
- Middle East & Africa Market Size (US$ Bn) and Volume (Th. Units) Analysis and Forecast, by Price range, 2025-2032
- Premium
- Mid-range
- Low-range
- Green Technologies
- Radar and Aerospace Technologies
- Middle East & Africa Market Size (US$ Bn) and Volume (Th. Units) Analysis and Forecast, by End User, 2025-2032
- Men
- Women
- Kids
- Middle East & Africa Market Size (US$ Bn) and Volume (Th. Units) Analysis and Forecast, by Sales Channel, 2025-2032
- Wholesalers/ Distributors
- Supermarkets/ Hypermarkets
- Specialty Stores
- Multi-brand Stores
- Online Retailers
- Other Sales Channels
- Competition Landscape
- Market Share Analysis, 2024
- Market Structure
- Competition Intensity Mapping
- Competition Dashboard
- Company Profiles
- Shimano, Inc.
- Company Overview
- Product Portfolio/Offerings
- Key Financials
- SWOT Analysis
- Company Strategy and Key Developments
- Accell Group N.V.
- Campagnolo S.R.L.
- Garmin Ltd.
- Giant Manufacturing Co., Ltd
- Merida Industry Co. Ltd
- Samchuly Bicycle Co.
- FALKE KGaA
- Endura Ltd
- DT Swiss AG
- Rental Limited
- Head N.V.
- New Balance Athletics Inc.
- 2XU
- Shimano, Inc.
- Appendix
- Research Methodology
- Research Assumptions
- Acronyms and Abbreviations


- Sporting Goods & Equipment
- Bicycle Apparel Market
Bicycle Apparel Market Trends, Size, Share, Growth, Forecasts, 2025 - 2032
Bicycle Apparel Market By Product Type (Cycling Tops, Cycling Bottoms, Cycling Gloves, and Shoes) by Price Range (Premium, Mid-range, and Low-range) End-user (Men, Women, and Kids) Sales Channel (Wholesalers/Distributors, Supermarkets/Hypermarkets, Specialty Stores, Multi-brand Stores, Online Retailers, and Others) and Regional Analysis for 2025 - 2032
Bicycle Apparel Market Share and Trends Analysis
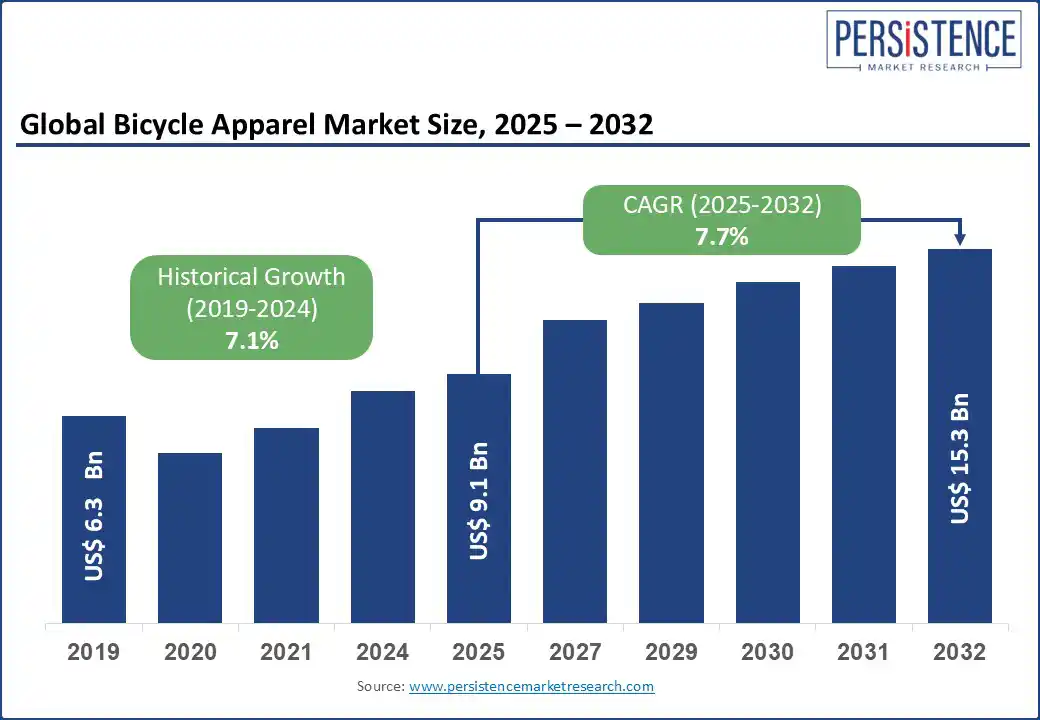
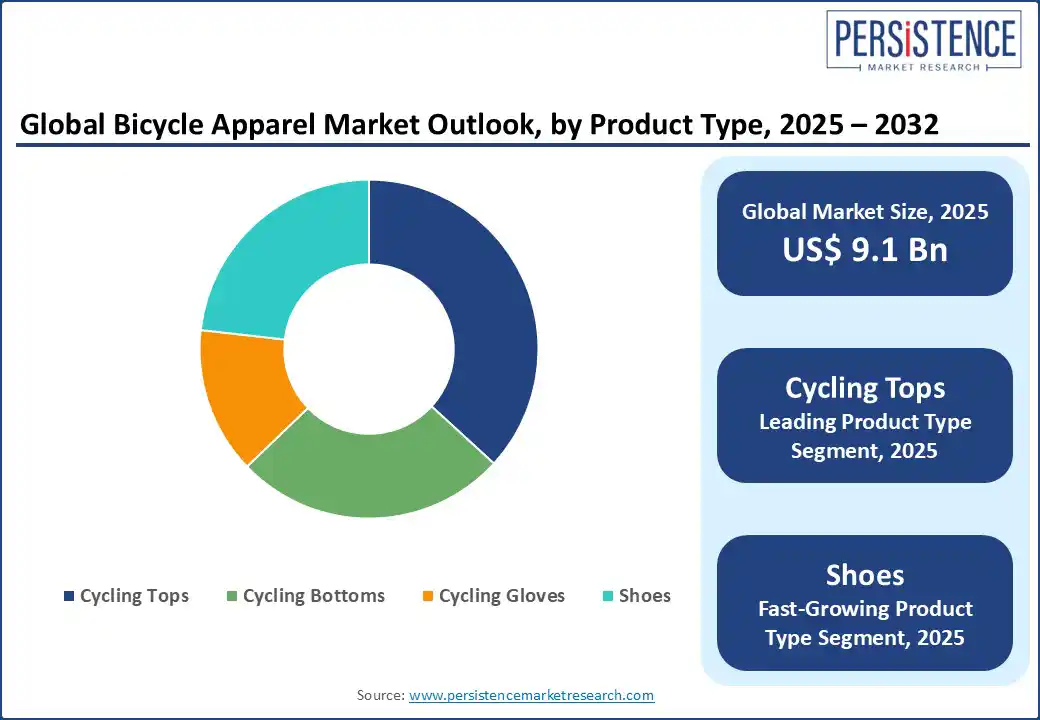
The global bicycle apparel market size is likely to be valued at US$ 9.1 Bn by 2025 and is expected to reach US$ 15.3 Bn by 2032, growing at a CAGR of 7.7% during the forecast period. Rising demand for performance apparel, growing popularity of weather-adaptive jackets, and the increasing consumer preference for jerseys with moisture-wicking and UV protection features are emerging as key trends among cycling commuters.
The growing focus on health and wellness, along with the rising popularity of cycling for recreation, fitness, and eco-friendly transportation, is a key factor driving the growth of the bicycle apparel market. According to recent estimates, the global number of cyclists is expected to reach nearly 1.2 billion by 2025.
Key Industry Highlights:
- Increasing popularity of cycling as a lifestyle choice is a key driver for the global bicycle apparel market
- High cost of technical cycling apparel and increasing competition from local athletic wear brands restrain market growth
- Growing participation of women in cycling presents a major opportunity for market expansion
- Cycling tops are anticipated to dominate the global cycling apparel market in 2025, capturing around 36.8% of the total revenue share.
- The mid-range bicycle apparel market is expected to generate a total opportunity of US$ 2.8 billion between 2025 and 2032, making it the most promising price segment.
- North America is projected to reach US$ 2.1 billion between 2025 and 2032, making it one of the most lucrative regional markets.
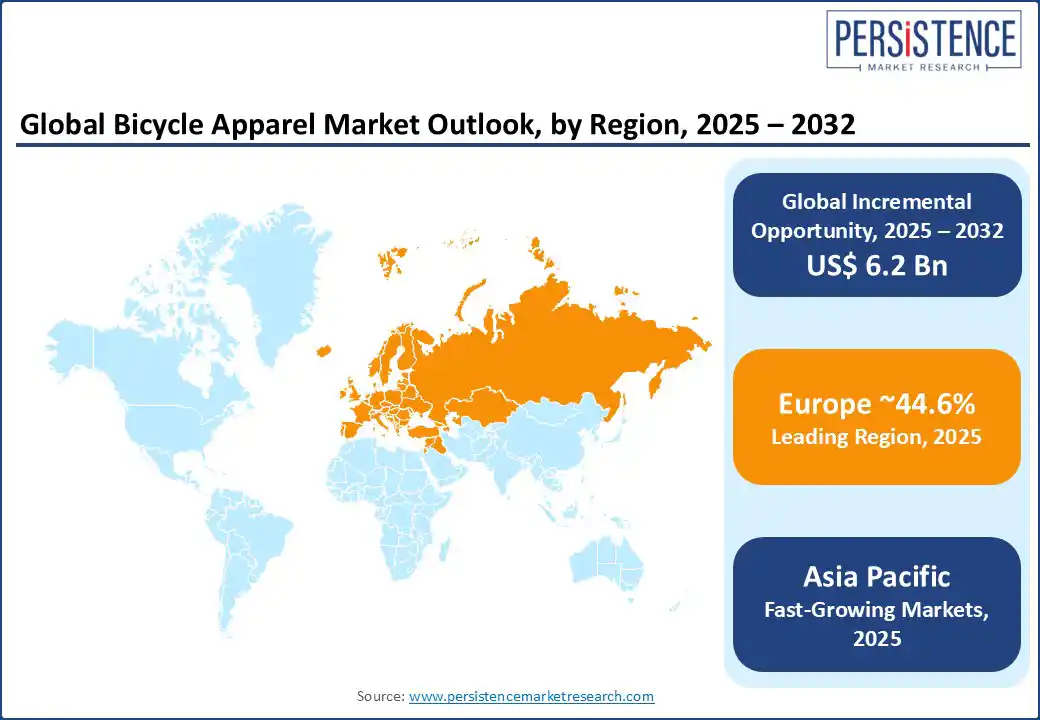
- Europe is projected to dominate the global bicycle apparel market with a substantial 44.6% market share in 2025 fuelled by a strong cycling culture
- The global bicycle apparel market is set to be the fastest-growing market in the Asia Pacific region, and is poised to register a leading CAGR in the entire forecast period.
|
Global Market Attribute |
Details |
|
Market Size (2024A) |
US$ 9.0 Bn |
|
Estimated Market Size (2025E) |
US$ 9.1 Bn |
|
Projected Market Value (2032F) |
US$ 15.3 Bn |
|
Value CAGR (2025 to 2032) |
7.7% |
|
Historical Market Growth (CAGR 2019 to 2024) |
7.1% |
Market Dynamics:
Driver - The increasing popularity of cycling as a lifestyle choice is a key driver for the global bicycle apparel market
The increasing popularity of cycling as a lifestyle choice is one of the key factors driving the growth of the global bicycle apparel market. As more people embrace cycling not only as a sport but also as a daily mode of transportation, fitness activity, and eco-friendly commuting alternative, the demand for specialized cycling clothing is rising steadily. Apparel designed specifically for cycling, such as padded shorts, moisture-wicking jerseys, weather-resistant jackets, and aerodynamic gear, enhances performance, improves comfort, and ensures safety, essential for both casual and professional riders.
The rise of social cycling communities, cycling tourism, and participation in organized events has further accelerated the demand for performance-based and aesthetically appealing apparel. The influence of social media and fitness tracking platforms promoting cycling as a fashionable and aspirational lifestyle is also encouraging consumers to invest in high-quality gear. Urbanization, growing environmental consciousness, and rising health awareness have led individuals to integrate cycling into their everyday lives, resulting the global bicycle sales are estimated to reach nearly 17.5 million units in 2025 and are projected to grow further to 20 million units by 2032, supporting a strong and expanding consumer base for cycling apparel.
Restraint - High cost of technical cycling apparel and increasing competition from local athletic wear brands restrain market growth
The high cost associated with technical and performance-oriented cycling wear is one of the key restraints limiting the growth of the global cycling apparel market. These products, often made with advanced materials offering aerodynamic benefits, moisture-wicking properties, UV protection, and temperature regulation, come with premium pricing. This makes them less accessible to entry-level and recreational cyclists, especially in emerging markets where cost sensitivity remains high. As a result, many potential consumers either postpone their purchase or opt for more affordable alternatives, thereby slowing market penetration for high-end brands.
The rising competition from local athletic wear manufacturers also poses a significant challenge, discouraging new entrants from establishing a foothold in domestic markets. These domestic brands often offer cycling apparel at lower price points while still providing acceptable quality and functionality for casual riders. With increasing localization, flexible pricing strategies, and faster response to regional consumer preferences, these brands are capturing a significant share of the market. This intensifies price-based competition and puts pressure on global players to reduce margins or diversify offerings, impacting overall profitability and brand loyalty.
Opportunity - Growing participation of women in cycling presents a major opportunity for market expansion
The increasing participation of women in cycling presents a significant opportunity for growth in the global bicycle apparel industry. Over the past decade, cycling has evolved from being a male-dominated sport to a more inclusive and diverse activity, with a notable rise in female cyclists engaged in urban commuting, fitness, and competitive cycling. This shift can be attributed to several factors, including greater awareness of health and wellness, increased representation of women in sports, the development of safer cycling infrastructure, and the expansion of women-focused cycling communities and events. As a result, more women are actively seeking apparel that meets their specific performance, comfort, and style preferences.
Marketing campaigns emphasize inclusivity and female empowerment in cycling resonate strongly with the target audience, encouraging more women to participate in the sport. Social media and digital platforms have also played a crucial role in promoting female cycling influencers and communities, which helps boost both participation and apparel sales. Brands that focus on research, innovation, and targeted outreach to this growing customer base are likely to capture a significant market share. As women’s presence in cycling continues to rise, apparel manufacturers have the opportunity to expand their product lines, foster customer loyalty, and tap into a rapidly growing segment with long-term potential.
Category-wise Analysis
Product Type Insights
Cycling tops are anticipated to dominate the global cycling apparel market in 2025, capturing around 36.8% of the total revenue share. This strong market position is driven by their essential role in enhancing comfort, performance, and safety for riders of all levels. These cycling clothes are designed with advanced features, such as breathable, moisture-wicking fabrics, UV protection, rear pockets, and reflective elements for visibility.
Ongoing innovations have led to the use of lightweight, stretchable, and weather-resistant materials, with premium options offering compressive fits and aerodynamic designs. Manufacturers are expanding their product lines with gender-inclusive and youth-friendly designs, ensuring broader appeal and functionality. Increased availability through both online and offline retail channels further supports market growth.
Price Range Insights
The mid-range bicycle apparel market is expected to generate a total opportunity of US$ 2.8 billion between 2025 and 2032, making it the most promising price segment. Positioned between basic and premium options, mid-range products provide a balanced mix of quality, durability, and affordability. This segment is ideal for recreational riders and fitness-focused individuals looking for technical features such as quick-dry fabrics, breathable materials, and comfortable fits without paying premium prices.
The rising number of new cyclists and casual riders in emerging economies is driving strong demand for mid-range cycling apparel. The rise of direct-to-consumer channels and private labels has also made mid-range products more widely available globally. With cycling gaining popularity both as a sport and a lifestyle, the mid-range segment is well-positioned to benefit from rising consumer awareness and evolving preferences.
End-use Insights
The women's category in the bicycle apparel market is projected to grow at a CAGR of 8.7% from 2025 to 2032, making it the fastest-growing end-user. This growth is fuelled by an increasing number of women cyclists participating in both recreational and competitive cycling. Greater representation of women in cycling events, social campaigns, and fitness communities also helps break stereotypes and encourages women to participate in the sport.
Brands acknowledge this demand and are introducing stylish yet functional apparel across different price ranges. The availability of specialized apparel lines that address female-specific needs, including fit, support, color choices, and design, motivates more women to invest in quality cycling clothing.
Regional Insights
North America Bicycle Apparel Market Trends
North America is projected to create an absolute $ opportunity of US$ 2.1 billion between 2025 and 2032, making it one of the most lucrative regional markets. The U.S. is the primary driver of cycling's growing popularity, where it is gaining traction for both fitness and daily commuting. A surge in cycling events, growing interest in active lifestyles, and the adoption of athleisure trends are boosting demand for performance-oriented apparel.
Consumers are increasingly seeking gear that offers comfort, functionality, and aesthetics. Technological advancements such as moisture-wicking fabrics, UV-resistant materials, and reflective detailing are in high demand. With continuous investment in cycling infrastructure and the expansion of product lines across price ranges, North America is poised for steady growth through the forecast period.
Europe Bicycle Apparel Market Trends
Europe is projected to dominate the global bicycle apparel market with a substantial 44.6% market share in 2025. This dominance is fuelled by a strong cycling culture, especially in countries like the Netherlands, Germany, and Denmark, where cycling is deeply integrated into daily life. The region possesses well-developed infrastructure, government initiatives encouraging eco-friendly transportation, and a health-conscious population, all of which support stable demand for high-quality cycling clothing.
The strong growth in e-bicycle sales is also one of the key drivers of the European bicycle apparel market. For example, the European e-bicycle market is expected to grow from 3.3 million units in 2019 to nearly 5.8 million units by 2025 and is projected to reach 8.6 million units by the end of 2032. This surge in e-bike adoption, combined with continuous product innovation and rising brand visibility, is expected to reinforce Europe’s leadership in the global bicycle apparel market through 2032.
Asia Pacific Bicycle Apparel Market Trends
The global bicycle apparel market is set to be the fastest-growing market in the Asia Pacific region, registering a CAGR of 9.6% from 2025 to 2032. The region’s rapid urbanization, growing environmental awareness, and expanding middle-class population are fuelling the demand for bicycles and related apparel. Countries such as China, India, Japan, and South Korea are witnessing a rise in recreational and commuter cycling due to increasing traffic congestion and fitness trends.
The widespread availability and affordability of bicycles and bicycle-related apparel on e-commerce platforms and the increasing number of sporting goods retailers are promoting the sales of bicycle apparel in rapidly developing market such as India. Companies, such as Decathlon, have become a major catalyst in popularizing cycling as a lifestyle and fitness activity in India. Its experience stores, online platform, and community events, such as group rides, have fostered a vibrant cycling culture, especially among youth and urban fitness enthusiasts.
Competitive Landscape
The global bicycle apparel market is moderately fragmented, with key players such as Rapha, Shimano, Inc., and Accell Group N.V. dominating the premium segment, while brands like Decathlon, Endura, and Altura offer competitively priced mass-market products. These companies compete on innovation, performance, comfort, and sustainability, with increasing focus on women-centric designs and weather-adaptive features.
Private labels and direct-to-consumer brands are gaining traction, intensifying competition. Regional players in Asia and Europe are expanding their presence through e-commerce and niche offerings. Strategic partnerships, product launches, and sustainability initiatives are critical differentiators shaping the evolving competitive dynamics of this market.
Key Developments
- In June 2024, GOREWEAR unveiled the Ultimate Bib Shorts+, a high-performance cycling product featuring a proprietary 3D-printed EXPERT N3X seat pad engineered with Elastic Interface. The bib shorts offer body-mapped compression, enhanced breathability, and reduced chafing, and incorporate bio-based, recycled materials to minimize environmental impact. This innovation earned the product a 2023 ISPO Award.
- In June 2024, Decathlon announced a partnership with Cycling UK to make cycling more accessible to all age groups and backgrounds. The collaboration centers around the ‘Be a Bike Hero’ campaign, a social media competition launched during Bike Week 2024, aimed at encouraging cycling participation across the UK. This initiative positions Decathlon as a community-oriented brand focused on cycling inclusivity and engagement.
- In May 2024, Santini Cycling, in collaboration with Pirelli Design, launched the Pirelli Sport Club capsule collection to celebrate Pirelli’s cycling legacy and promote active lifestyles. The collection includes performance jerseys, bib shorts, outerwear, and accessories such as caps, socks, and biodegradable water bottles. Key highlights include Polartec® Power Stretch® fabrics, GITevo gel-core chamois, UPF-certified protection, and reflective safety elements, blending innovation with heritage, inspired by the historic Sport Club Pirelli logo.
Companies Covered in Bicycle Apparel Market
- Shimano, Inc.
- Accell Group N.V.
- Campagnolo S.R.L.
- Garmin Ltd.
- Giant Manufacturing Co., Ltd
- Merida Industry Co. Ltd
- Samchuly Bicycle Co.
- FALKE KGaA
- Endura Ltd
- DT Swiss AG
- Rental Limited
- Head N.V.
- New Balance Athletics Inc.
- 2XU
Frequently Asked Questions
The global bicycle apparel market is projected to be valued at US$ 9.1 Bn in 2025.
Cycling tops are projected to account nearly 36.8% share of the global bicycle apparel market in 2025 due to their essential role in enhancing comfort, performance, and safety for riders of all levels.
The bicycle apparel market is poised to witness a CAGR 7.7% from 2025 to 2032.
The increasing popularity of cycling as a lifestyle choice is a key driver for the global bicycle apparel market.
Growing participation of women in cycling presents a major opportunity for market expansion.
Key market players include Shimano, Inc., Accell Group N.V., Campagnolo S.R.L., Garmin Ltd., Giant Manufacturing Co., Ltd., and Merida Industry Co. Ltd.


