

- Executive Summary
- Global Battery Powered Bath Accessories Market Snapshot 2026 and 2033
- Market Opportunity Assessment, 2026-2033, US$ Bn
- Key Market Trends
- Industry Developments and Key Market Events
- Demand Side and Supply Side Analysis
- PMR Analysis and Recommendations
- Market Overview
- Market Scope and Definitions
- Market Dynamics
- Driver
- Restraint
- Opportunities
- Trends
- Macro-Economic Factors
- Global GDP Outlook
- Global Prison Growth Outlook
- Global Crime Rates by Country
- Global Prison Population by Country
- Global Private Prison Market Growth Outlook
- Other Macro-economic Factors
- Forecast Factors – Relevance and Impact
- COVID-19 Impact Assessment
- Value Added Insights
- Value Chain analysis
- Key Market Players
- Product Adoption Analysis
- Key Promotional Strategies by key players
- PESTLE Analysis
- Porter's Five Forces Analysis
- Regulatory and Technology Landscape
- Price Trend Analysis, 2025
- Region-wise Price Analysis
- Price by Segments
- Price Impact Factors
- Global Battery Powered Bath Accessories Market Outlook: Historical (2020 – 2025) and Forecast (2026 – 2033)
- Key Highlights
- Global Battery Powered Bath Accessories Market Outlook: Product Type
- Introduction/Key Findings
- Historical Market Size (US$ Bn) and Volume (Units) Analysis by Product Type, 2020-2025
- Current Market Size (US$ Bn) and Volume (Units) Forecast, by Product Type, 2026-2033
- Electric Toothbrushes
- Electric Shavers / Razors
- Facial Cleansing Devices
- Others
- Market Attractiveness Analysis: Product Type
- Global Battery Powered Bath Accessories Market Outlook: Distribution Channel
- Introduction/Key Findings
- Historical Market Size (US$ Bn) and Volume (Units) Analysis by Distribution Channel, 2020-2025
- Current Market Size (US$ Bn) and Volume (Units) Forecast, by Distribution Channel, 2026-2033
- Online
- Offline
- Market Attractiveness Analysis: Distribution Channel
- Global Battery Powered Bath Accessories Market Outlook: Region
- Key Highlights
- Historical Market Size (US$ Bn) and Volume (Units) Analysis by Region, 2020-2025
- Current Market Size (US$ Bn) and Volume (Units) Forecast, by Region, 2026-2033
- North America
- Europe
- East Asia
- South Asia & Oceania
- Latin America
- Middle East & Africa
- Market Attractiveness Analysis: Region
- North America Battery Powered Bath Accessories Market Outlook: Historical (2020 – 2025) and Forecast (2026 – 2033)
- Key Highlights
- Pricing Analysis
- North America Market Size (US$ Bn) and Volume (Units) Forecast, by Country, 2026-2033
- U.S.
- Canada
- North America Market Size (US$ Bn) and Volume (Units) Forecast, by Product Type, 2026-2033
- Electric Toothbrushes
- Electric Shavers / Razors
- Facial Cleansing Devices
- Others
- North America Market Size (US$ Bn) and Volume (Units) Forecast, by Distribution Channel, 2026-2033
- Online
- Offline
- Europe Battery Powered Bath Accessories Market Outlook: Historical (2020 – 2025) and Forecast (2026 – 2033)
- Key Highlights
- Pricing Analysis
- Europe Market Size (US$ Bn) and Volume (Units) Forecast, by Country, 2026-2033
- Germany
- Italy
- France
- U.K.
- Spain
- Russia
- Rest of Europe
- Europe Market Size (US$ Bn) and Volume (Units) Forecast, by Product Type, 2026-2033
- Electric Toothbrushes
- Electric Shavers / Razors
- Facial Cleansing Devices
- Others
- Europe Market Size (US$ Bn) and Volume (Units) Forecast, by Distribution Channel, 2026-2033
- Online
- Offline
- East Asia Battery Powered Bath Accessories Market Outlook: Historical (2020 – 2025) and Forecast (2026 – 2033)
- Key Highlights
- Pricing Analysis
- East Asia Market Size (US$ Bn) and Volume (Units) Forecast, by Country, 2026-2033
- China
- Japan
- South Korea
- East Asia Market Size (US$ Bn) and Volume (Units) Forecast, by Product Type, 2026-2033
- Electric Toothbrushes
- Electric Shavers / Razors
- Facial Cleansing Devices
- Others
- East Asia Market Size (US$ Bn) and Volume (Units) Forecast, by Distribution Channel, 2026-2033
- Online
- Offline
- East Asia Market Size (US$ Bn) and Volume (Units) Forecast, by , 2026-2033
- South Asia & Oceania Battery Powered Bath Accessories Market Outlook: Historical (2020 – 2025) and Forecast (2026 – 2033)
- Key Highlights
- Pricing Analysis
- South Asia & Oceania Market Size (US$ Bn) and Volume (Units) Forecast, by Country, 2026-2033
- India
- Southeast Asia
- ANZ
- Rest of SAO
- South Asia & Oceania Market Size (US$ Bn) and Volume (Units) Forecast, by Product Type, 2026-2033
- Electric Toothbrushes
- Electric Shavers / Razors
- Facial Cleansing Devices
- Others
- South Asia & Oceania Market Size (US$ Bn) and Volume (Units) Forecast, by Distribution Channel, 2026-2033
- Online
- Offline
- Latin America Battery Powered Bath Accessories Market Outlook: Historical (2020 – 2025) and Forecast (2026 – 2033)
- Key Highlights
- Pricing Analysis
- Latin America Market Size (US$ Bn) and Volume (Units) Forecast, by Country, 2026-2033
- Brazil
- Mexico
- Rest of LATAM
- Latin America Market Size (US$ Bn) and Volume (Units) Forecast, by Product Type, 2026-2033
- Electric Toothbrushes
- Electric Shavers / Razors
- Facial Cleansing Devices
- Others
- Latin America Market Size (US$ Bn) and Volume (Units) Forecast, by Distribution Channel, 2026-2033
- Online
- Offline
- Middle East & Africa Battery Powered Bath Accessories Market Outlook: Historical (2020 – 2025) and Forecast (2026 – 2033)
- Key Highlights
- Pricing Analysis
- Middle East & Africa Market Size (US$ Bn) and Volume (Units) Forecast, by Country, 2026-2033
- GCC Countries
- South Africa
- Northern Africa
- Rest of MEA
- Middle East & Africa Market Size (US$ Bn) and Volume (Units) Forecast, by Product Type, 2026-2033
- Electric Toothbrushes
- Electric Shavers / Razors
- Facial Cleansing Devices
- Others
- Middle East & Africa Market Size (US$ Bn) and Volume (Units) Forecast, by Distribution Channel, 2026-2033
- Online
- Offline
- Competition Landscape
- Market Share Analysis, 2025
- Market Structure
- Competition Intensity Mapping
- Competition Dashboard
- Company Profiles
- Kohler Co.
- Company Overview
- Product Portfolio/Offerings
- Key Financials
- SWOT Analysis
- Company Strategy and Key Developments
- LIXIL Group Corporation
- TOTO Ltd.
- Sloan Valve Company
- Bradley Corporation
- Chicago Faucets
- Jaquar Group
- Oras Group
- Masco Corporation
- Duravit AG
- Intersan Manufacturing Company
- Hydrotek International, Inc.
- Koninklijke Philips N.V.
- Procter & Gamble Co.
- Panasonic Holdings Corporation
- Kohler Co.
- Appendix
- Research Methodology
- Research Assumptions
- Acronyms and Abbreviations


- Beauty & Personal Care
- Battery Powered Bath Accessories Market
Battery Powered Bath Accessories Market Size, Share, and Growth Forecast 2026 - 2033
Battery Powered Bath Accessories Market by Product Type (Electric Toothbrushes, Electric Shavers / Razors, Facial Cleansing Devices, Others), by Distribution Channel (Online, Offline), by Regional Analysis, 2026-2033
Battery Powered Bath Accessories Market Size and Trend Analysis
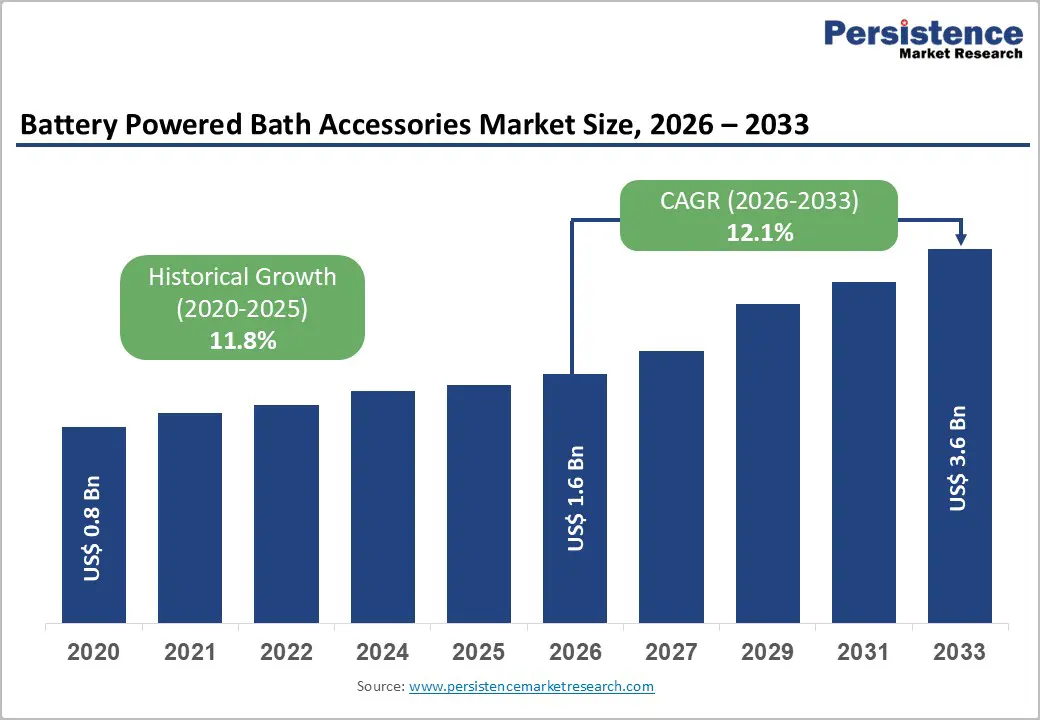
The global battery powered bath accessories market size is expected to be valued at US$ 1.6 billion in 2026 and projected to reach US$ 3.6 billion by 2033, growing at a CAGR of 12.1% between 2026 and 2033. This growth is driven by rising consumer emphasis on personal hygiene, convenience, and time efficiency, alongside rapid technological advancements in battery performance. Innovations in lithium-ion and rechargeable battery systems enable longer usage cycles and improved reliability, aligning well with busy urban lifestyles. Strong demand for electric toothbrushes is supported by global oral health awareness initiatives, while increasing skincare consciousness, particularly post-pandemic, is accelerating the adoption of facial cleansing and grooming devices across residential and commercial settings.
Key Industry Highlights:
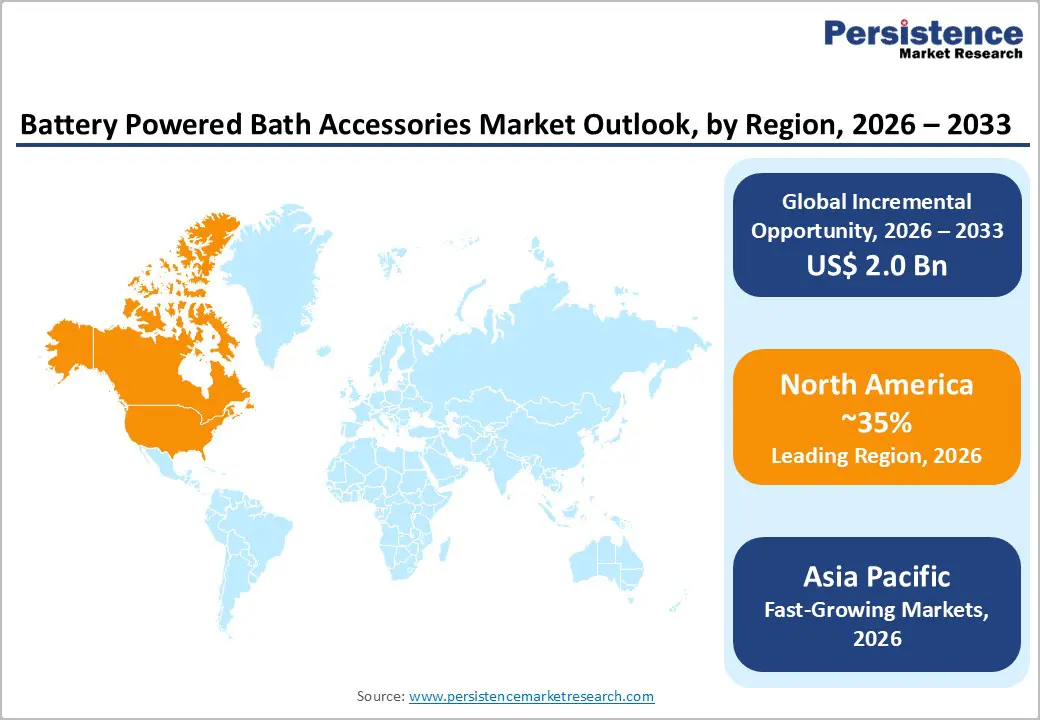
- Leading Region: North America leads the Battery Powered Bath Accessories market with a 35% share in 2025, supported by strong U.S. innovation, high hygiene awareness, and stringent regulatory standards.
- Fastest-Growing Region: Asia Pacific is the fastest-growing region, expanding at a 14% CAGR during 2025–2032, driven by rapid urbanization and large-scale manufacturing growth in China and India.
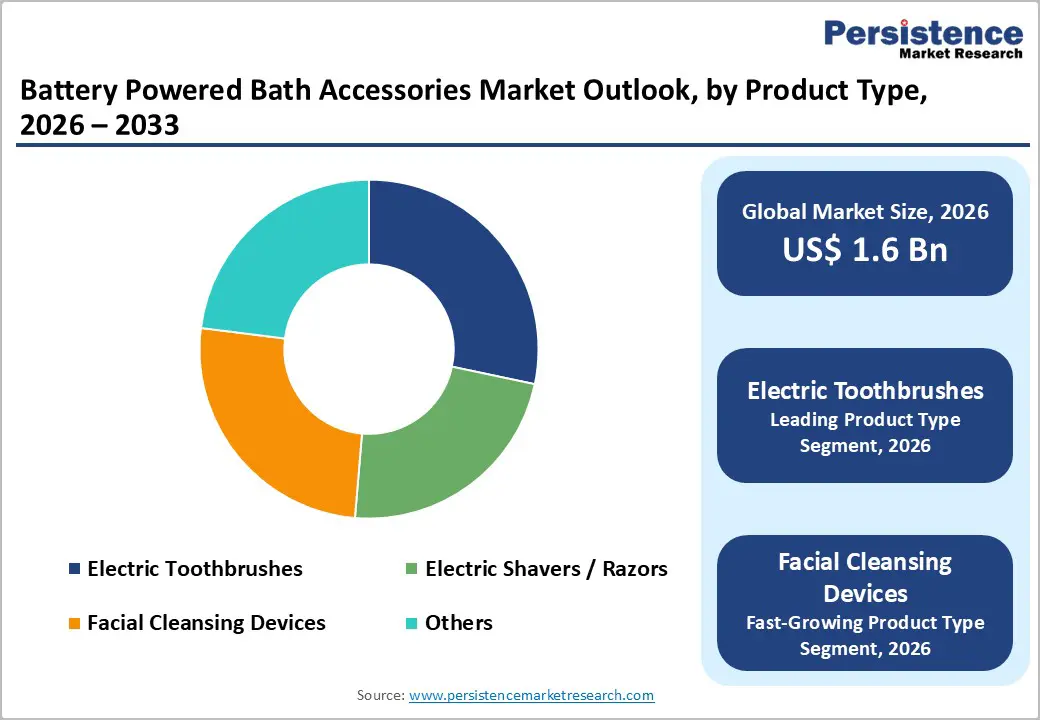
- Leading Category: Electric toothbrushes dominate the market with a 45% share, owing to superior plaque removal efficiency and strong recommendations from dental professionals.
- Fastest-Growing Category: Facial cleansing devices are the fastest-growing category, registering a 7.6% CAGR, fueled by rising skincare awareness and premium personal grooming trends.
- Key Market Opportunity: Smart IoT-enabled bath accessories present a major growth opportunity, especially in emerging markets, supported by rapid e-commerce penetration and connected device adoption.
| Report Attribute | Details |
|---|---|
|
Battery Powered Bath Accessories Size (2026E) |
US$ 1.6 Billion |
|
Market Value Forecast (2033F) |
US$ 3.6 Billion |
|
Projected Growth CAGR(2026-2033) |
12.1% |
|
Historical Market Growth (2020-2025) |
11.8% |
Market Dynamics
Drivers - Technological Progress in Rechargeable and Lithium-Ion Battery Systems
Advancements in rechargeable battery technology, especially lithium-ion variants, are strongly driving the battery-powered bath accessories market by enabling longer runtimes, faster charging, and consistent power output. Modern devices now offer up to 60 minutes of continuous use on a single charge, significantly improving convenience for daily grooming and hygiene routines. This performance upgrade makes cordless accessories more practical for regular and travel use.
Enhanced battery efficiency also lowers long-term replacement costs and supports sustainability goals through reduced disposable battery usage. As consumers increasingly favor cordless, portable solutions, manufacturers are investing heavily in advanced battery integration. This has accelerated innovation across electric toothbrushes, shavers, and facial devices, sustaining market momentum and encouraging broader adoption across residential and commercial applications.
Rising Global Awareness Around Oral and Personal Hygiene
Heightened awareness of oral, skin, and personal hygiene intensified in the post-pandemic period is a key driver of demand for battery-powered bath accessories. Global health initiatives highlight the prevalence of dental and skin conditions, encouraging consumers to adopt electric toothbrushes and facial cleansing devices that deliver superior hygiene outcomes compared to manual alternatives. This behavioral shift is especially pronounced in emerging economies, where urbanization and health consciousness are rising rapidly. Increased product availability, growing brand participation, and technology-enabled hygiene solutions are reinforcing adoption. As consumers seek effective, touch-free, and easy-to-use grooming tools, battery powered accessories continue to gain traction, supporting sustained market growth across age groups and regions.
Restraints - Cost Barriers and Environmental Challenges Linked to Battery Usage
High upfront costs associated with advanced battery powered bath accessories remain a key restraint, particularly in price-sensitive and emerging markets. Premium electric toothbrushes, smart grooming devices, and AI-enabled accessories are often priced 20–50% higher than manual alternatives, limiting affordability despite superior performance. This pricing gap discourages first-time buyers and slows mass adoption outside urban and higher-income segments.
In addition, environmental concerns related to battery disposal create regulatory and operational challenges. Stricter recycling mandates, especially across Europe, increase compliance costs for manufacturers. Improper battery disposal contributes to pollution risks, further influencing consumer hesitation and restraining faster market penetration.
Low Product Awareness and Infrastructure Gaps in Rural Markets
Limited awareness of the functional and health benefits of battery powered bath accessories restricts demand in rural and underdeveloped regions. Manual grooming and hygiene tools continue to dominate due to lower costs and minimal exposure to technology-driven alternatives. Inadequate education around oral and personal hygiene further weakens adoption, particularly in communities with limited healthcare outreach.
Infrastructure constraints also play a critical role, as inconsistent electricity access complicates device charging and long-term usage. These factors collectively reduce appeal in non-urban markets, creating a clear adoption gap between rural and urban consumers and slowing overall market expansion.
Opportunities - Growth Potential Across Emerging and High-Population Economies
Significant opportunities exist in emerging markets across Asia-Pacific and Latin America, driven by rapid urbanization, rising disposable incomes, and an expanding middle-class population. Countries such as China, India, and Brazil are witnessing increased demand for modern grooming and hygiene solutions as lifestyle preferences shift toward convenience and automation. Local manufacturing capabilities, particularly in China, support cost-effective scaling and improved product affordability.
Government-led oral health and hygiene programs further enhance adoption potential, especially for electric toothbrushes and personal care devices. Expanding e-commerce ecosystems provide manufacturers with low-cost market entry and broad consumer reach, enabling faster penetration in both urban and semi-urban areas.
Rising Demand for Smart, Connected, and Personalized Devices
Integration of smart technologies presents strong growth opportunities as consumers increasingly seek personalized and data-driven grooming solutions. AI- and IoT-enabled bath accessories, such as adaptive electric shavers and smart facial cleansing devices, enhance user experience by tailoring performance to individual skin and hygiene needs. These features reduce irritation, improve outcomes, and support routine optimization.
Tech-savvy millennials and Gen Z consumers are driving demand for connected devices, particularly in developed markets with strong innovation ecosystems. Regulatory support and faster product approvals further encourage innovation, allowing companies to command premium pricing and build long-term brand loyalty.
Category-wise Analysis
Product Type Insights
Electric toothbrushes represent the leading product category, accounting for approximately 45% market share in 2025, supported by their proven effectiveness in plaque removal and strong recommendations from dental associations worldwide. Rechargeable electric toothbrushes are particularly dominant, as they offer better long-term value, consistent performance, and reduced battery replacement costs. Widespread prevalence of dental disorders, highlighted by global health statistics, reinforces the necessity of advanced oral care solutions. Features such as sonic and oscillating technologies further appeal to health-conscious consumers seeking professional-level hygiene at home.
Facial cleansing devices and electric shavers are emerging as the fastest-growing product categories, driven by rising skincare awareness, demand for personalized grooming, and growing adoption among younger consumers focused on convenience and appearance.
Distribution Channel Insights
Offline retail channels continue to lead, capturing around 60% of total market share in 2025, as consumers prefer physical evaluation of battery powered bath accessories before purchase. Hands-on assessment of ergonomics, durability, and battery life in hypermarkets and specialty stores builds buyer confidence, particularly for first-time users. Immediate product availability and in-store demonstrations further strengthen offline dominance across grooming and hygiene products.
At the same time, online distribution is the fastest-growing channel, supported by expanding e-commerce penetration, wider product assortments, and competitive pricing. Digital platforms enable easy product comparison, access to reviews, and doorstep delivery, making them increasingly attractive to tech-savvy and urban consumers.
Regional Insights
North America Battery Powered Bath Accessories Market Trends
North America holds a significant share of the global Battery Powered Bath Accessories market, accounting for around 35% share, led by strong demand from the United States. High consumer spending power, early adoption of advanced grooming technologies, and widespread availability of premium products support market leadership. Electric toothbrushes and battery-powered shavers benefit from strong oral health awareness, reinforced by national dental care initiatives and professional endorsements.
The region also benefits from a robust innovation ecosystem, with frequent product launches and rapid integration of smart features. Regulatory clarity and approvals encourage manufacturers to introduce advanced devices such as AI-enabled shavers and facial cleansers. High penetration of organized retail and e-commerce further strengthens adoption across residential and commercial end users.
Europe Battery Powered Bath Accessories Market Trends
Europe represents a mature yet steadily expanding market, supported by strong sustainability regulations and high hygiene awareness. Countries such as Germany, the UK, and France emphasize eco-friendly product designs, encouraging adoption of rechargeable and low-waste battery technologies. These regulatory frameworks align well with consumer preference for durable, energy-efficient grooming and hygiene devices.
The European market is projected to grow at a CAGR of 12.4%, driven by rising demand for electric toothbrushes, grooming tools, and skincare devices. Increasing preventive oral care initiatives and aging populations further support growth. Manufacturers focusing on recyclable batteries, compliance-ready designs, and premium positioning continue to find strong traction across the region.
Asia Pacific Battery Powered Bath Accessories Market Trends
Asia Pacific is emerging as the fastest-expanding regional market, capturing approximately 30% share, driven by rapid urbanization, population growth, and rising disposable incomes. China leads demand through widespread adoption of tech-enabled grooming devices, while India’s increasing focus on hygiene and oral health is accelerating uptake of electric toothbrushes and facial care tools.
The region also benefits from cost-efficient manufacturing hubs in China, Japan, and ASEAN countries, supporting both domestic consumption and exports. Expanding middle-class populations, growing e-commerce penetration, and increasing brand awareness are driving adoption across urban and semi-urban areas. As affordability improves and awareness rises, Asia Pacific is expected to remain a key growth engine for the global market.
Competitive Landscape
The battery powered bath accessories market is highly fragmented, characterized by the presence of both global players and numerous regional and local manufacturers. Competition is primarily driven by continuous product innovation, with companies investing heavily in research and development to enhance battery efficiency, durability, and smart functionality. Expansion through online retail platforms and direct-to-consumer channels is increasingly used to widen market reach and improve brand visibility.
Key competitive differentiators include extended battery life, ergonomic design, and integration of smart applications that enable personalized usage and performance tracking. Many manufacturers are adopting consumable-based business models, such as replacement head subscriptions, to build long-term customer loyalty. Despite active innovation, industry consolidation remains gradual, maintaining a competitive landscape.
Key Developments:
- In January 2025, Supermouth introduced the ULTIM8 SmartBrush electric toothbrush featuring advanced sonic technology and eco-friendly, replaceable heads, targeting sustainability-conscious consumers while enhancing plaque removal efficiency through smart brushing modes and improved battery performance.
- In February 2025, AI-enabled shavers from Braun and Philips were launched with adaptive blade technology designed to adjust in real time to skin sensitivity, improving shaving comfort, reducing irritation, and delivering personalized grooming experiences through intelligent sensor-driven performance optimization.
- In September 2025, Panasonic unveiled an advanced battery-powered facial cleanser equipped with multi-speed operational settings, enabling customized skincare routines, deeper pore cleansing, and improved user control, while addressing rising demand for premium at-home personal care devices.
Companies Covered in Battery Powered Bath Accessories Market
- Kohler Co.
- LIXIL Group Corporation
- TOTO Ltd.
- Sloan Valve Company
- Bradley Corporation
- Chicago Faucets
- Jaquar Group
- Oras Group
- Masco Corporation
- Duravit AG
- Intersan Manufacturing Company
- Hydrotek International, Inc.
- Koninklijke Philips N.V.
- Procter & Gamble Co.
- Panasonic Holdings Corporation
Frequently Asked Questions
The Battery Powered Bath Accessories market is projected to reach US$ 1.6 billion by 2026, supported by rising adoption of powered oral and personal care devices.
Growing hygiene awareness, reinforced by global WHO-led oral health and cleanliness campaigns, is accelerating demand for electric toothbrushes and related accessories.
North America leads with a 35% market share in 2025, driven by strong U.S. regulatory support, innovation intensity, and high consumer awareness.
Smart IoT-enabled bath accessories offer strong growth potential in Asia Pacific, leveraging rapid e-commerce expansion and tech adoption in emerging economies.
Leaders include Kohler Co., LIXIL Group Corporation, TOTO Ltd., Sloan Valve Company, and Bradley Corporation.


